


-
fredbernAsked on October 24, 2014 at 4:04 AM
Hi,
I would like to setup a kind of self assessment: users answer question and get a mark (let's say from 1 to 5) depending on responses.
I would like to add a chart (radar or histogram) showing in detail the results of individual user on various dimensions (a single dimension is calculated from various questions). Do you know if it's possible to had such a chart
thanks in advance
Frederic
-
jonathanReplied on October 24, 2014 at 6:38 AM
Hi Frederic,
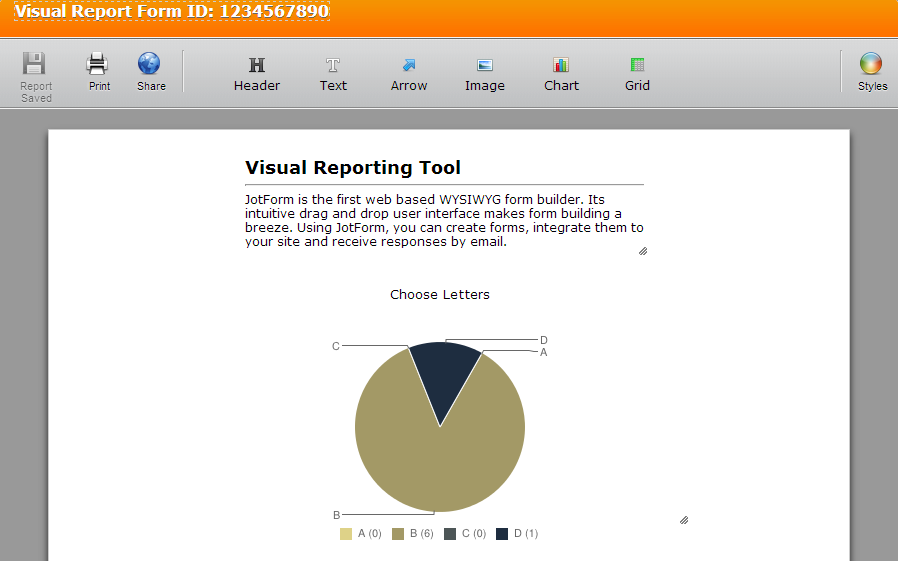
You can use the Visual Reports to have submission reports that have chart and graphs on them.
Check this user guide: https://www.jotform.com/help/187-How-to-Create-a-Visual-Report-with-your-Form-Submissions
To create the report filters check this also https://www.jotform.com/help/281-How-To-Use-Visual-Report-Filters
Hope this help. Please inform us if you need further assistance.
Thanks.
-
fredbernReplied on October 24, 2014 at 12:32 PM
Thanks Jonathan,
As far as I understand, it will show charts based on all the responses collected with the form.
It would like to show the result of the last submission. The idea is to use the form as a self assessment and the chart should help the user to interpret its results.
Do you know if it is possible ?
-
raulReplied on October 24, 2014 at 2:08 PM
Hello,
Unfortunately, you cannot filter visual reports to show only one submission.
However, you might be able to do this by exporting your submissions to an Excel spreadsheet and creating your charts for each submission using Excel.
Please let us know if this works for you.
Best Regards.
- Templates
- Integrations
- INTEGRATIONS
- See 100+ integrations
- FEATURED INTEGRATIONS
 PayPal
- Slack
- Google Sheets
- Mailchimp
- Zoom
- Dropbox
- Google Calendar
- Hubspot
- Salesforce
- See more Integrations
- Products
- PRODUCTS
- Form Builder
- Jotform Enterprise
- Jotform Apps
- Store Builder
- Jotform Tables
- Jotform Inbox
- Jotform Mobile App
- Jotform Approvals
- Report Builder
- Smart PDF Forms
- PDF Editor
- Jotform Sign
- Jotform for Salesforce Discover Now
- Support

