-
GoldsmithPRAsked on February 5, 2016 at 3:31 PM
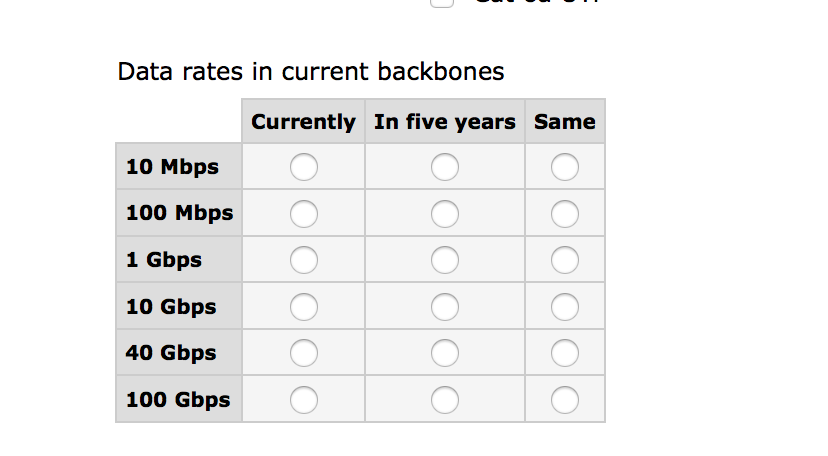
We ask some very important questions in our survey for which I need to show visual comparisons. Here is a link to the survey. https://form.jotform.com/60114323509142.
I am disappointed that I cannot figure out a way to display this. Also I cannot seem to change the colors in the bar charts, only the pie charts.
Please advise.
 Page URL: https://form.jotform.com/60114323509142
 -
BenReplied on February 5, 2016 at 4:27 PM
Since you mention "in the survey" I would like to confirm if you would like to have the report shown on the form, or if you want to have a visual chart report of the data submitted on the form instead?
Once we know more we would be happy to assist and help with the setup of the same.
- Mobile Forms
- My Forms
- Templates
- Integrations
- INTEGRATIONS
- See 100+ integrations
- FEATURED INTEGRATIONS
PayPal
Slack
Google Sheets
Mailchimp
Zoom
Dropbox
Google Calendar
Hubspot
Salesforce
- See more Integrations
- Products
- PRODUCTS
Form Builder
Jotform Enterprise
Jotform Apps
Store Builder
Jotform Tables
Jotform Inbox
Jotform Mobile App
Jotform Approvals
Report Builder
Smart PDF Forms
PDF Editor
Jotform Sign
Jotform for Salesforce Discover Now
- Support
- GET HELP
- Contact Support
- Help Center
- FAQ
- Dedicated Support
Get a dedicated support team with Jotform Enterprise.
Contact SalesDedicated Enterprise supportApply to Jotform Enterprise for a dedicated support team.
Apply Now - Professional ServicesExplore
- Enterprise
- Pricing


