


-
gilroymillerAsked on July 11, 2017 at 2:18 PM
there is no way to insert a hard page return
there is no snap to grid function
there is no alignment function
result is the report looks crappy.
... WHY would you just give us two examples at the beginning and then make us manually load the rest one at a time ...
there ... was that specific enough for you to get to work on something? Sorry for the sarcasm, but you take money out of my account every month and the reporting tool is sub sub par.
I look forward to a hasty improvement.
Gordon
-
Elton Support Team LeadReplied on July 11, 2017 at 2:21 PM
1. If you're referring to the entire page, hard page return isn't yet supported but you can increase the page to create long visual reports. To do that, just drag the holder found at the bottom right corner of the page.

2. Could you please elaborate the snap to grid function and how you'd like it to work in the visual report builder? Should it be a separate tool or part of the visual charts? We'd be happy to submit this as a feature request.
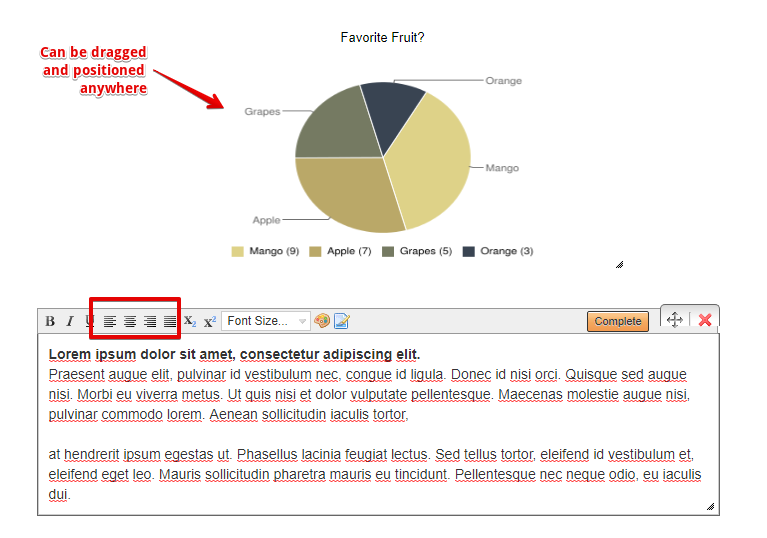
3. Elements in the visual report builder can be dragged and positioned anywhere by holding the move icon near the delete icon.
If it's about the text tool, alignment tools are on the formatting toolbar.
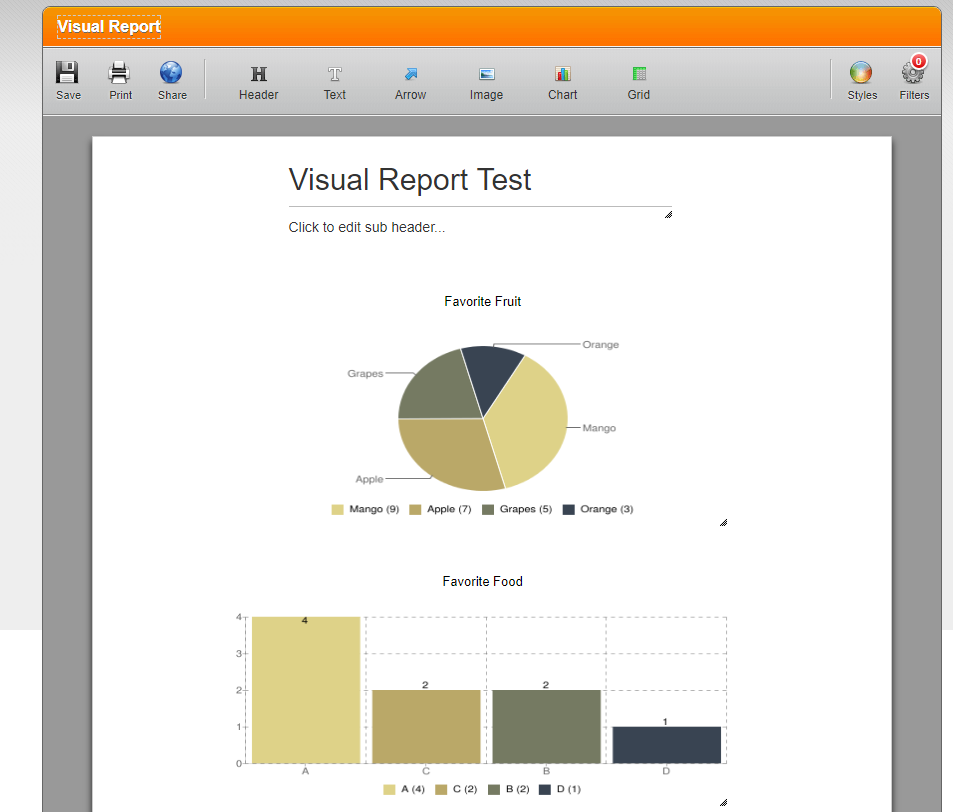
When you create a visual report, 3 elements are added automatically by default. First one is the header followed by 2 visual charts.
Example:
-
gilroymillerReplied on July 13, 2017 at 2:27 PM
Hello again Elton, I am breaking this down into individual items. I am worried that you are not seeing or hearing these concerns clearly. Or how much frustration I am experiencing with your reports.
RE: Hard Page return.
When the document is printed or exported in PDF form, sometimes the header "Favourite Fruit" as in your example above will appear at the bottom of the page with the graph on the following page. Without the ability to insert a page break at that point the user is left "dragging" and "stretching" and "repositioning" these report elements and THEN has to test print after each change to see if the desired result has occurred.
Q- Given that "insert hard page break" is an elementary function that has been around for decades ... do you think that NOT having this function makes your functionality a little bit Mickey Mouse?
-
gilroymillerReplied on July 13, 2017 at 2:39 PM
RE: SNAP TO GRID.
This was your answer:

You asked: "Please elaborate"
"snapping to a grid" allows a user to align elements to:
- a left margin
- a right margin
- a center line
- one element with another side by side, with their tops aligned.
- one element above another with their sides aligned.
"can be dragged and positioned anywhere" was a terrible answer. WE KNOW WE CAN DRAG IT ANYWHERE. That is obvious. BUT DRAG IT TO WHERE ?!?! There is NO GRID! Just a floating sea of "anywhere". The visual result is not professional and dragging it anywhere and aligning by eye is VERY time consuming.
Q- WHY would you want us to create a horrible looking result and put us to the work of aligning by eye when snap to grids is an obvious alignment tool that is missing from Jotforms reporting functionality?
AND no, I was not asking about the text tool.
-
gilroymillerReplied on July 13, 2017 at 2:46 PM
RE: ... WHY would you just give us two examples at the beginning and then make us manually load the rest one at a time.
In repeated threads I see people are asking you: "I can only see two of my questions, how do I get the rest?" Please don't answer that question we know how ... but it took us ALL time to figure it out.
Q- why are you creating a stock report with 2 sample questions in it? This does not make any sense. If we have gone to the trouble of asking 30 questions in a survey would it not make sense to give us a "stock" report that gives us all 30 sets of answers. ... It would be no trouble for you.
We could then go in and change the graph choice, or delete questions we didn't need to see answers for.
-
gilroymillerReplied on July 13, 2017 at 2:52 PM
RE NEW PROBLEM:
Please see the image below. ... there IS data for this question. I have tried deleting the question and re-inserting it and it stays for a while and then back up with this error message.
I am concluding that: While some parts of Jotform are excellent. Jotform's reporting tool is under powered and flakey. I am being as generous as I can possibly be. I am actively search for a better tool and will cancel my subscription as soon as I find one. Unless I see some efforts from you to up your game.

-
jonathanReplied on July 13, 2017 at 4:26 PM
I will elevate this thread to the next level support as a feature request ticket.
Please understand that it may take longer to have updates on this request thread as these are feature request.
You will be notified on this thread for any news/updates on the status updates when available.
Thank you.
- Templates
- Integrations
- INTEGRATIONS
- See 100+ integrations
- FEATURED INTEGRATIONS
 PayPal
- Slack
- Google Sheets
- Mailchimp
- Zoom
- Dropbox
- Google Calendar
- Hubspot
- Salesforce
- See more Integrations
- Products
- PRODUCTS
- Form Builder
- Jotform Enterprise
- Jotform Apps
- Store Builder
- Jotform Tables
- Jotform Inbox
- Jotform Mobile App
- Jotform Approvals
- Report Builder
- Smart PDF Forms
- PDF Editor
- Jotform Sign
- Jotform for Salesforce Discover Now
- Support


