


-
NortheastKYAHECAsked on November 18, 2017 at 8:55 PM
I am trying to build a visual report using pie charts of my form. When i select the questions and attempt to build the report, the report isn't pulling any information. I just get a blank spot where the chart should be and all the options say 'NaN%'. Can someone help me figure out what's going on and resolve this issue please?
-
liyamReplied on November 19, 2017 at 12:12 AM
I checked the field and it seems that there is a misuse of the pie chart. The field it is calling is the last 4 digits of SS# so the chart itself could not pick up some data for comparison.
Can you try modifying the report and let us know if the problem persists?
Thanks.
-
NortheastKYAHECReplied on November 19, 2017 at 9:58 AM
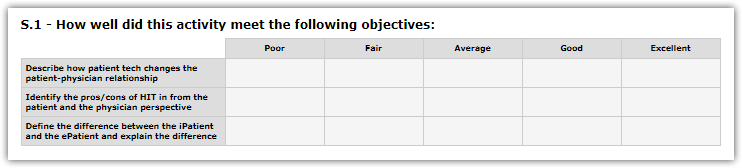
I wasn't trying to generate information from the SS# field, I was trying to generate data from the question "S.1 - How well did this activity meet the following objectives: - Describe how patient tech changes the patient-physician relationship." And this is the question it is generating the error for. I also added several more questions and a bar graph, and every question is generating this same error.
-
MikeReplied on November 19, 2017 at 11:06 AM
The S.1 question seems to be not answered on the form entries, this is why the visual report tool is unable to create a proper chart.
It should work once you have the form entries with the filled S.1 field.
If you need any further assistance, please let us know.
- Templates
- Integrations
- INTEGRATIONS
- See 100+ integrations
- FEATURED INTEGRATIONS
 PayPal
- Slack
- Google Sheets
- Mailchimp
- Zoom
- Dropbox
- Google Calendar
- Hubspot
- Salesforce
- See more Integrations
- Products
- PRODUCTS
- Form Builder
- Jotform Enterprise
- Jotform Apps
- Store Builder
- Jotform Tables
- Jotform Inbox
- Jotform Mobile App
- Jotform Approvals
- Report Builder
- Smart PDF Forms
- PDF Editor
- Jotform Sign
- Jotform for Salesforce Discover Now
- Support

