


-
CraigCormickAsked on February 14, 2018 at 10:33 PM
Hi Jotform people - I love the graphs you can make when you Build a Visual Report - but HOW do you get graphs for the whole survey and not just the first two questions???
I love the filters options too - but again - can I apply them beyond the first few questions??
I am sure there is a simple answer to this - I just haven't been able to figure it out yet.
thanks
CC
-
AdrianReplied on February 15, 2018 at 3:48 AM
The first two questions are added by default.
You can edit the which question the chart data comes from by clicking the Gear button and selecting the question in the Chart Data Dropdown.

You can also choose the Chart Type (Pie or Bar) and other options.

You can add extra charts by clicking the Chart button.

-
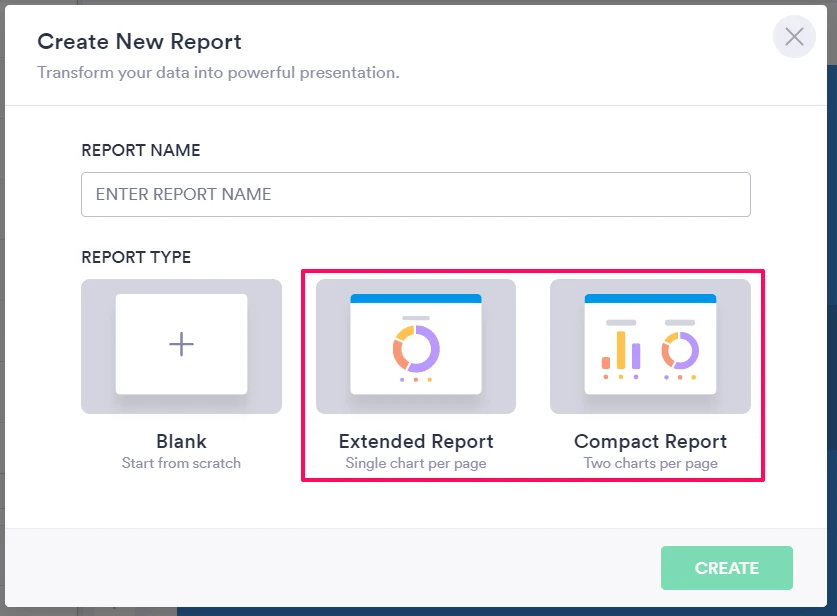
Sonnyfer JotForm SupportReplied on August 31, 2020 at 3:14 AM
Greetings! We're glad to inform you that we recently launched the new JotForm Report Builder. To check out its newest features, please click here.
You can also add all questions at once upon report creation.
- Templates
- Integrations
- INTEGRATIONS
- See 100+ integrations
- FEATURED INTEGRATIONS
 PayPal
- Slack
- Google Sheets
- Mailchimp
- Zoom
- Dropbox
- Google Calendar
- Hubspot
- Salesforce
- See more Integrations
- Products
- PRODUCTS
- Form Builder
- Jotform Enterprise
- Jotform Apps
- Store Builder
- Jotform Tables
- Jotform Inbox
- Jotform Mobile App
- Jotform Approvals
- Report Builder
- Smart PDF Forms
- PDF Editor
- Jotform Sign
- Jotform for Salesforce Discover Now
- Support


