


-
ccoltdAsked on March 8, 2018 at 3:49 PM
Hi,
We want to make some chart reports from a survey we just done. I can create a pie chart from a survey question bu going into reports, but how do i then export the chart into a word or excel document for example?
-
Elton Support Team LeadReplied on March 8, 2018 at 4:55 PM
You can't export them from the visual report builder but you can save it into PDF format using your Chrome browser.
Here's how:
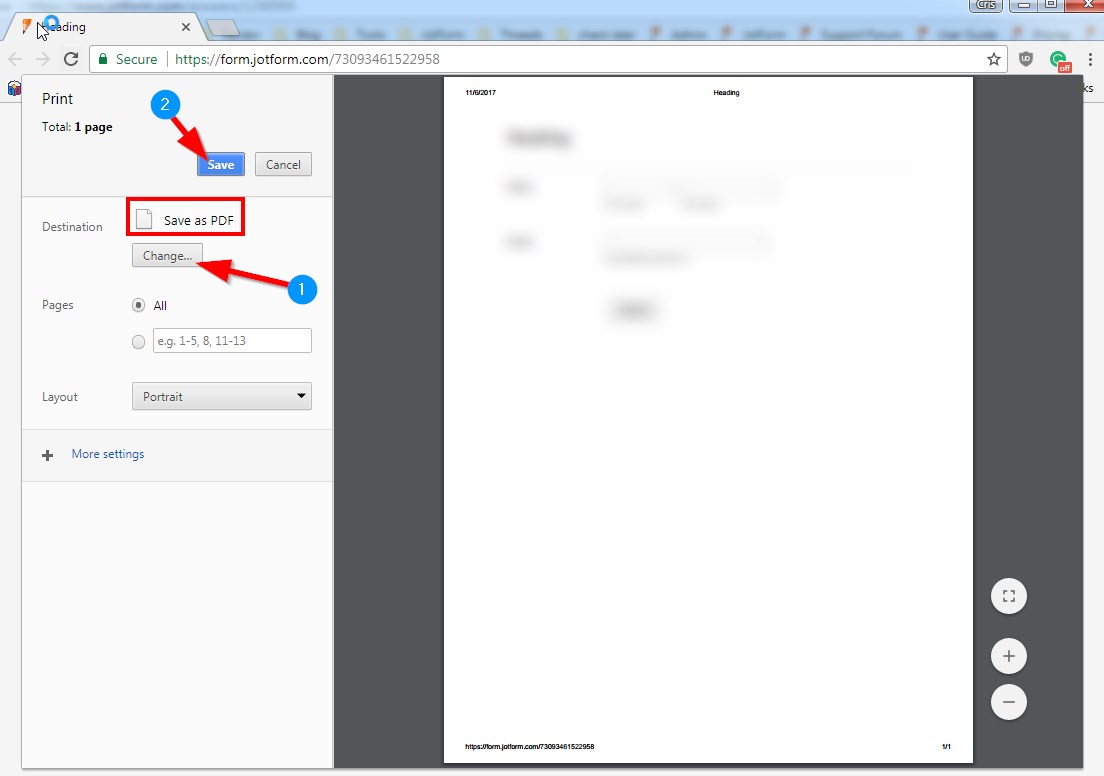
1. Open your visual report using Chrome browser
2. Print the page (Ctrl+P)
3. On print preview, change the Destination to "Save as PDF"
4. Click the save button to save the PDF
-
ccoltdReplied on March 8, 2018 at 5:43 PMThanks for the response. I have around 15 questions in the survey, so will need around 15 graphs. Is it possible to save more than one graph per pdf Page?
Kind Regards
Robbie
Robert Kyle
Operations Manager
CCO (Int) Ltd
Tel: 00447900216586
... -
Elton Support Team LeadReplied on March 8, 2018 at 6:56 PM
Yes, you can add the more charts as many as you want and adjust them accordingly to fit them on the page.
Example:

-
Sonnyfer JotForm SupportReplied on August 31, 2020 at 3:18 AM
Greetings! We're glad to inform you that we recently launched the new JotForm Report Builder. To check out its newest features, please click here.
You can now also add all supported questions at once upon report creation.

- Templates
- Integrations
- INTEGRATIONS
- See 100+ integrations
- FEATURED INTEGRATIONS
 PayPal
- Slack
- Google Sheets
- Mailchimp
- Zoom
- Dropbox
- Google Calendar
- Hubspot
- Salesforce
- See more Integrations
- Products
- PRODUCTS
- Form Builder
- Jotform Enterprise
- Jotform Apps
- Store Builder
- Jotform Tables
- Jotform Inbox
- Jotform Mobile App
- Jotform Approvals
- Report Builder
- Smart PDF Forms
- PDF Editor
- Jotform Sign
- Jotform for Salesforce Discover Now
- Support


