


-
PaulaMendesAsked on October 19, 2018 at 11:25 PM
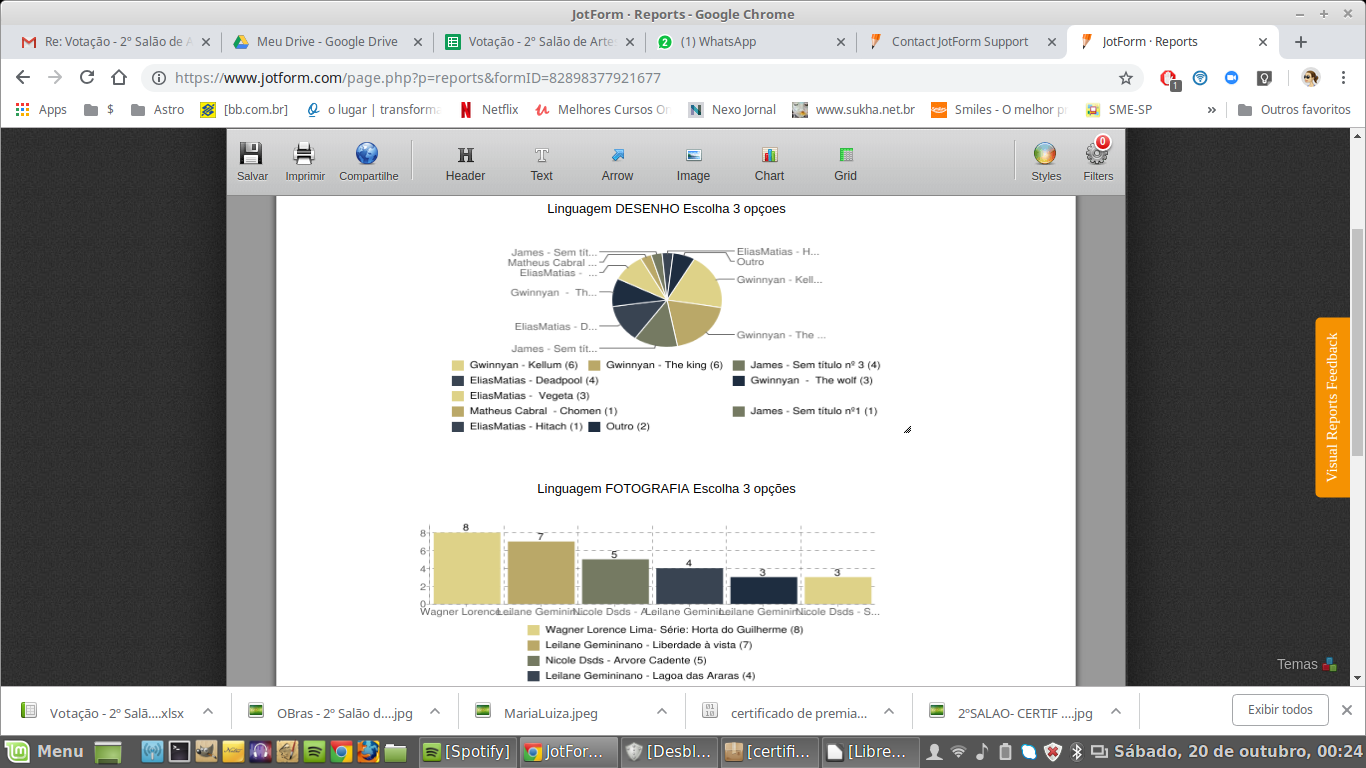
Ola, estou fazendo uma votação de um concurso q inclui as linguagens desenho, pintura e fotografia.
Ao gerar um relatorio visual, faltou gerar o grafico das respostas da linguagem de pintura. Como posso resolver isso?
-
liyamReplied on October 20, 2018 at 8:34 AM
Hello,
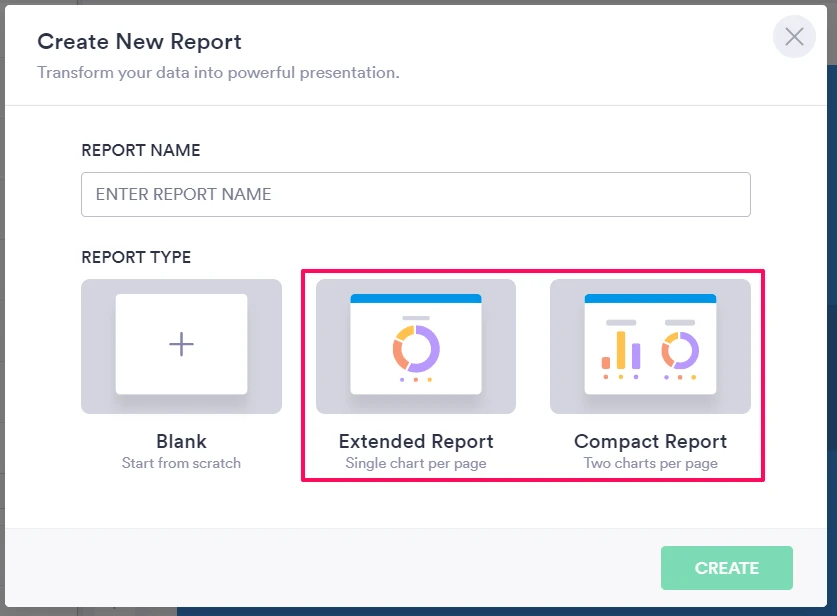
You can add charts on your visual report field in order to have your 3rd question be included in the report. To do this:
1) Expand your report canvas to allow to have more charts in it. Scroll down to the bottom of the report and then click and drag the bottom-most right part of the report canvas
2) Scroll to the top again and click chart on the tool bar. This will add a new chart in your report. Once added you can position it to your preferred location in the report.
3). click the properties icon (gear icon).
4) On chart data drop down menu, select the question that you wish to be added.

Note, you can do the same process to add more charts.
Feel free to let us know if you have more questions.
-
PaulaMendesReplied on October 22, 2018 at 10:43 AMI did this.
Thanks
Em sáb, 20 de out de 2018 às 09:34, JotForm escreveu:
... -
Sonnyfer JotForm SupportReplied on August 30, 2020 at 10:29 PM
Greetings! We're glad to inform you that we recently launched the new JotForm Report Builder. To check out its newest features, please click here.
The new version also now automatically displays all supported questions upon report creation.
- Templates
- Integrations
- INTEGRATIONS
- See 100+ integrations
- FEATURED INTEGRATIONS
 PayPal
- Slack
- Google Sheets
- Mailchimp
- Zoom
- Dropbox
- Google Calendar
- Hubspot
- Salesforce
- See more Integrations
- Products
- PRODUCTS
- Form Builder
- Jotform Enterprise
- Jotform Apps
- Store Builder
- Jotform Tables
- Jotform Inbox
- Jotform Mobile App
- Jotform Approvals
- Report Builder
- Smart PDF Forms
- PDF Editor
- Jotform Sign
- Jotform for Salesforce Discover Now
- Support


