


-
ctsiaousisAsked on March 14, 2019 at 8:35 PM
Hello.
I use a Template with more than 10 Questions.
When i go to see the visual Data from those Questions, i can See Data just from 2 Questions!!!Why?
-
David JotForm Support ManagerReplied on March 14, 2019 at 11:23 PM
The visual report will show you just the two charts for the first two questions. You will need to pull down the page from the bottom right corner, so you can have more space to add a new chart:

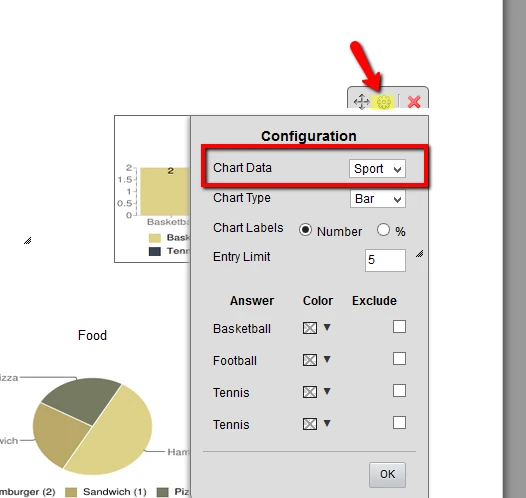
You can select the Question to display in the chart from the settings of each chart:
Let us know if you need more help.
-
Sonnyfer JotForm SupportReplied on August 28, 2020 at 2:06 AM
Greetings! We're glad to inform you that we recently launched the new JotForm Report Builder. To check out its vastly improved features, please click here.
- Templates
- Integrations
- INTEGRATIONS
- See 100+ integrations
- FEATURED INTEGRATIONS
 PayPal
- Slack
- Google Sheets
- Mailchimp
- Zoom
- Dropbox
- Google Calendar
- Hubspot
- Salesforce
- See more Integrations
- Products
- PRODUCTS
- Form Builder
- Jotform Enterprise
- Jotform Apps
- Store Builder
- Jotform Tables
- Jotform Inbox
- Jotform Mobile App
- Jotform Approvals
- Report Builder
- Smart PDF Forms
- PDF Editor
- Jotform Sign
- Jotform for Salesforce Discover Now
- Support


