


-
joannanctennisAsked on June 26, 2019 at 9:54 AM
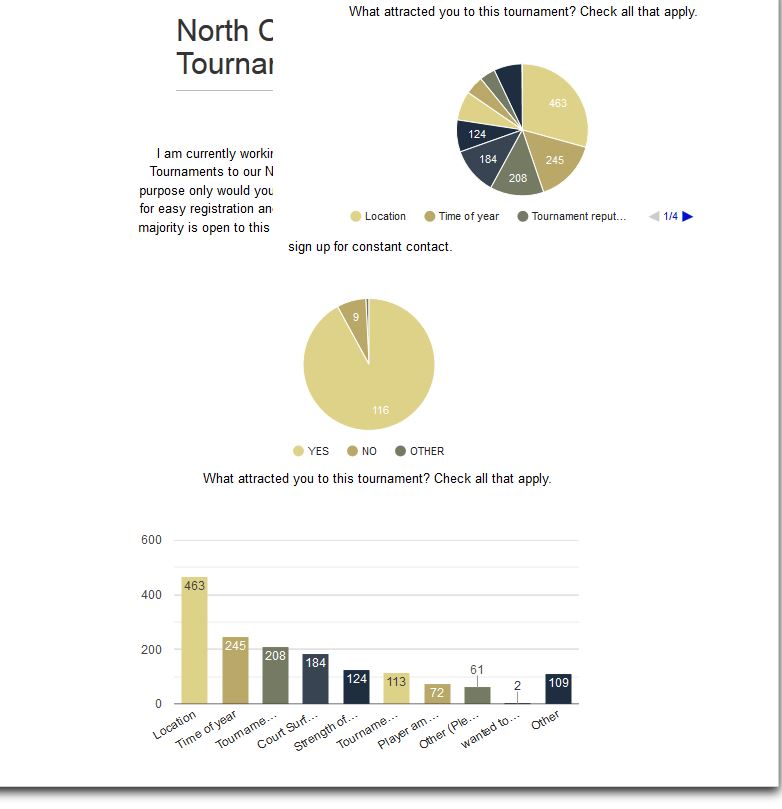
I've been using Visual Report Generator.
I'd like to make all my questions into a visual graph, not just my 1st question
-
Ivaylo JotForm SupportReplied on June 26, 2019 at 11:48 AM
You can get a visual report for all questions. You should click on Filters, which is located at top right corner and then select the other questions. You can create rules to determine, which results are included in your charts and graphs. There are two type of filters (Data Filter and Question and Answers filters). Here is the walkthrough:
https://eu.jotform.com/help/281-How-to-Use-Visual-Report-Filters
-
David JotForm Support ManagerReplied on August 20, 2020 at 1:23 PM
Good day, we are glad to inform you that we recently launched the new JotForm Report Builder. Kindly check it out here. It will by default generate the graph for all questions.
- Templates
- Integrations
- INTEGRATIONS
- See 100+ integrations
- FEATURED INTEGRATIONS
 PayPal
- Slack
- Google Sheets
- Mailchimp
- Zoom
- Dropbox
- Google Calendar
- Hubspot
- Salesforce
- See more Integrations
- Products
- PRODUCTS
- Form Builder
- Jotform Enterprise
- Jotform Apps
- Store Builder
- Jotform Tables
- Jotform Inbox
- Jotform Mobile App
- Jotform Approvals
- Report Builder
- Smart PDF Forms
- PDF Editor
- Jotform Sign
- Jotform for Salesforce Discover Now
- Support

