


-
capitalfundAsked on August 9, 2014 at 11:49 PM
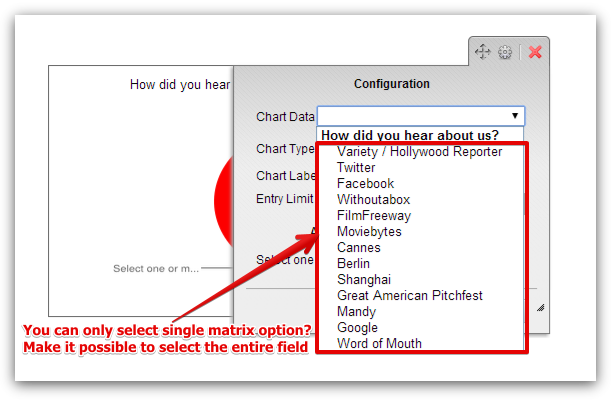
i see u can chart each answer of a matrix here
but what about one pie with all matrix answers together like the pie chart does for a question with dropdown choices
we have a simple matrix asking folks where they heard of our site and want a chart for results, thnx
-
Elton Support Team LeadReplied on August 10, 2014 at 3:36 AM
Hi,
I have escalated your request to our developers. I couldn't promise you any ETA but rest assured once this is rolled out, we will let you know here.
I believe this is precisely what you're requesting.
Thanks!
-
runjitchandraReplied on November 18, 2014 at 3:53 PM
Is there any follow up on this? I would like to know if this works now or not.
-
Jeanette JotForm SupportReplied on November 18, 2014 at 5:05 PM
This ticket was already assigned to a developer, however, our devs work on prioritized tasks.
Therefore I cannot give you an ETA for when this will be available.
- Templates
- Integrations
- INTEGRATIONS
- See 100+ integrations
- FEATURED INTEGRATIONS
 PayPal
- Slack
- Google Sheets
- Mailchimp
- Zoom
- Dropbox
- Google Calendar
- Hubspot
- Salesforce
- See more Integrations
- Products
- PRODUCTS
- Form Builder
- Jotform Enterprise
- Jotform Apps
- Store Builder
- Jotform Tables
- Jotform Inbox
- Jotform Mobile App
- Jotform Approvals
- Report Builder
- Smart PDF Forms
- PDF Editor
- Jotform Sign
- Jotform for Salesforce Discover Now
- Support

