


-
davewebbAsked on October 23, 2014 at 8:34 AM
I have made a survey. Other than a excel spreadsheet how do I get data? When I looked at jotform survey tools it said I could make charts and pie charts with the data, this it why I chose Jotform to do my survey. Now I cant find how to pull out the data in a chart form.
Thanks
Dave
-
davewebbReplied on October 23, 2014 at 10:06 AM
I guess i did not explain properly. I can make the charts but they dont show both answers, only one at a time. How can I get a chart to show both answers at one time?
Thanks
Dave
-
Jeanette JotForm SupportReplied on October 23, 2014 at 12:08 PM
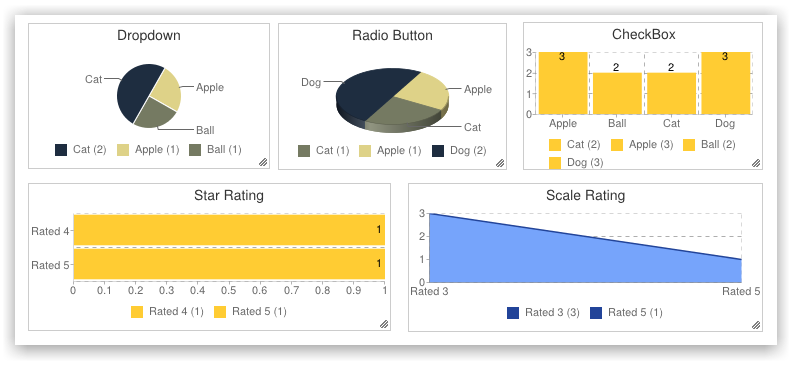
I assume you are talking about these visual reports, right?
Please check this guide:
https://www.jotform.com/help/187-How-to-Create-a-Visual-Report-with-your-Form-Submissions
If you want to embed the chart into a form, you can just use the Text field (under Form Tools) and paste the iFrame code of the report.
-
davewebbReplied on October 23, 2014 at 12:13 PM
HA!! Thats it. Thanks Jeanette for your help.
Have a great day!
Dave
-
Jeanette JotForm SupportReplied on October 23, 2014 at 1:14 PM
Thanks and likewise. Very glad to be able to assist you!
Cheers!
-
davewebbReplied on October 23, 2014 at 2:19 PM
I did as was said in the how to guide but I only see one answer.
How can I see both answers in the same chart?

-
davewebbReplied on October 23, 2014 at 2:29 PM
My filter only gives me date range.
No question & answer filter.
Strange.
Dave
-
Jeanette JotForm SupportReplied on October 23, 2014 at 5:23 PM
I just inspected this, seems like the problem is that you are using matrix for the responses, rather than checkboxes. Please change these so they can be included in the chart.
-
davewebbReplied on October 24, 2014 at 9:20 AM
Can I change them now that the survey is over?
The reason I use matrix is that is the choose under survey tools. There is no check box under survey tools.
Thanks
Dave
-
Jeanette JotForm SupportReplied on October 24, 2014 at 12:42 PM
Hello Dave
The problem is that if you delete the matrix, then the data will be also deleted. In light of that, the only way for you to reproduce a chart is by downloading submissions in a Excel file and use Excel graphic chart features.
-
davewebbReplied on October 24, 2014 at 1:29 PM
Jeanette,
Yeah that is what I been doing. So next time I do a survey I should not use the survey tools but use checkboxes? LOL, who would have guessed!
Thanks for your help Jeanette.
Have a good weekend,
Dave
-
Jeanette JotForm SupportReplied on October 24, 2014 at 3:42 PM
You're welcome
- Templates
- Integrations
- INTEGRATIONS
- See 100+ integrations
- FEATURED INTEGRATIONS
 PayPal
- Slack
- Google Sheets
- Mailchimp
- Zoom
- Dropbox
- Google Calendar
- Hubspot
- Salesforce
- See more Integrations
- Products
- PRODUCTS
- Form Builder
- Jotform Enterprise
- Jotform Apps
- Store Builder
- Jotform Tables
- Jotform Inbox
- Jotform Mobile App
- Jotform Approvals
- Report Builder
- Smart PDF Forms
- PDF Editor
- Jotform Sign
- Jotform for Salesforce Discover Now
- Support


