


-
LCnetworksAsked on December 4, 2014 at 8:50 AM
Hi,
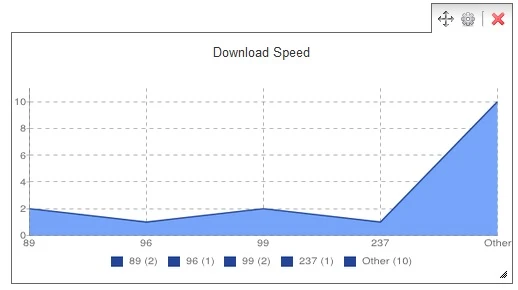
I have created a field with a numeric value, in this case we are recording download speed, upload speed and latency in these fields. So every time this value is enter and submitted, it will be a different value.
I am trying to generate a chart to show the stats over a time, but the problem is that I need to X-axis to indicate the values enter. I am using a line chart and would ideally like the line to indicate the download/upload/latency speed going up and down accordingly.
Thanks,
-
BenReplied on December 4, 2014 at 9:34 AM
Hi,
Could you please tell us the jotform where the chart is located, or if the chart is in some other place, such as reports?
Once we know more we would be able to check and provide you with the further assistance.
Best Regards,
Ben -
LCnetworksReplied on December 8, 2014 at 6:09 AM
Hi,
You can find the form here...
http://www.myjotform.com/form/43373230401542
The internet status section specifically is the data report I am interested in.
The report I get is below.
-
Welvin Support Team LeadReplied on December 8, 2014 at 7:38 AM
Unfortunately, it's not possible for now. But I just sent a request to our developers about this certain feature. Our developers would decide and update you here when it becomes available.
Thank you!
-
BenReplied on December 15, 2014 at 11:23 AM
Hi,
In my colleague's name you are welcome.
I see that he has already opened a feature request for this and as soon as there are any updates we will let you know about them through this thread.
Best Regards,
Ben
- Templates
- Integrations
- INTEGRATIONS
- See 100+ integrations
- FEATURED INTEGRATIONS
 PayPal
- Slack
- Google Sheets
- Mailchimp
- Zoom
- Dropbox
- Google Calendar
- Hubspot
- Salesforce
- See more Integrations
- Products
- PRODUCTS
- Form Builder
- Jotform Enterprise
- Jotform Apps
- Store Builder
- Jotform Tables
- Jotform Inbox
- Jotform Mobile App
- Jotform Approvals
- Report Builder
- Smart PDF Forms
- PDF Editor
- Jotform Sign
- Jotform for Salesforce Discover Now
- Support


