


-
ercangenisAsked on December 18, 2014 at 7:26 PM
Hi guys ,
I wanna choose more than 1 value for my charts. I have teams in the field and they are reporting their daily visits via jotform. I want to be able to see , Which team worked how many hours , how many sites they got done etc. Is this possible ?
Thanks.
-
jonathanReplied on December 18, 2014 at 9:09 PM
Hi,
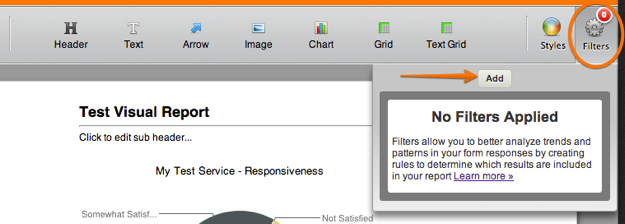
Please follow this user guide on how to assign filters in your Visual Reports.
-How-To-Use-Visual-Report-Filters
You need to click on the gear/cog icon on upper right to start using filters
Hope this help. Please let us know if you need further assistance.
Thanks!
-
ercangenisReplied on December 18, 2014 at 10:08 PM
I'm sorry but are you sure that you understood my question ? I'm asking how to choose more than 1 value for the charts.. I don't have any question about how to use the filters.
Thanks.
-
jonathanReplied on December 18, 2014 at 10:36 PM
Hi,
I apologize for my blunder and the confusion.
I did not find an existing Visual Report on your jotform http://www.jotform.us/form/43346370588159 ,and it was wrong for me to assume that you could be referring to filtering as the option values.
Please use this user guide instead
-How-to-Create-a-Visual-Report-with-your-Form-Submissions
You can edit the charts then on the report

Hope this help. Please let us know if need further assistance.
Thanks.
- Templates
- Integrations
- INTEGRATIONS
- See 100+ integrations
- FEATURED INTEGRATIONS
 PayPal
- Slack
- Google Sheets
- Mailchimp
- Zoom
- Dropbox
- Google Calendar
- Hubspot
- Salesforce
- See more Integrations
- Products
- PRODUCTS
- Form Builder
- Jotform Enterprise
- Jotform Apps
- Store Builder
- Jotform Tables
- Jotform Inbox
- Jotform Mobile App
- Jotform Approvals
- Report Builder
- Smart PDF Forms
- PDF Editor
- Jotform Sign
- Jotform for Salesforce Discover Now
- Support


