


-
larryformmasterAsked on January 30, 2015 at 1:29 PM
-
CarinaReplied on January 30, 2015 at 2:32 PM
Please provide more details on your inquiry so we can assist you further.
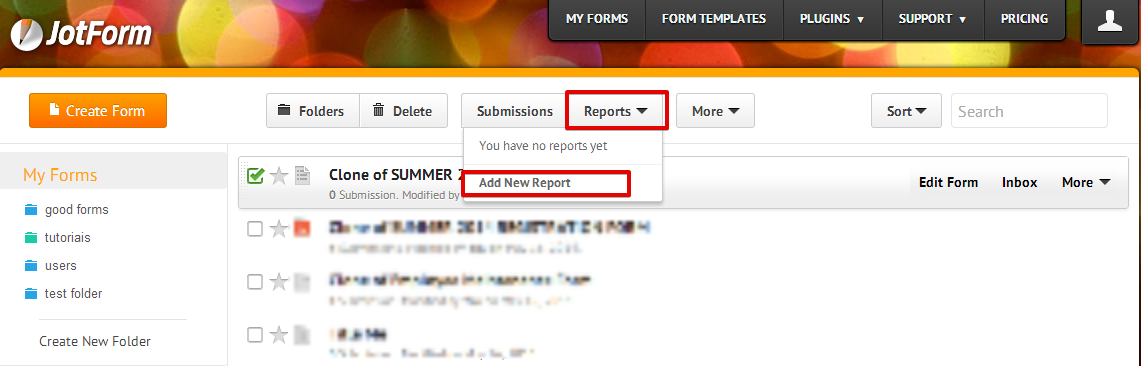
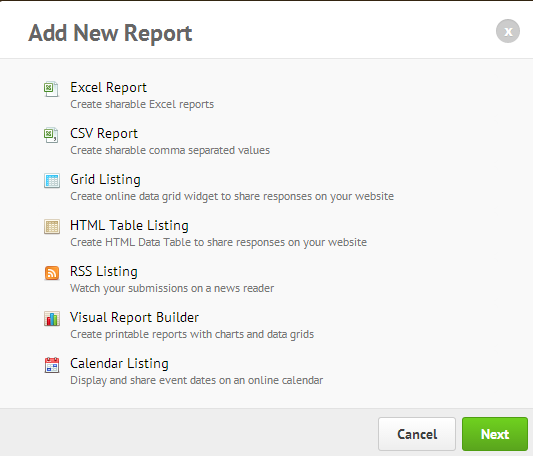
After receiving submissions you can create reports. Jotform has several options. If you need to create graphics you can select the visual report that allows you to have circle, bar or line graphics:
You can also take a look on our analytics apps:
http://apps.jotform.com/category/analytics_and_reporting
Let us know if we can assist you further.
- Templates
- Integrations
- INTEGRATIONS
- See 100+ integrations
- FEATURED INTEGRATIONS
 PayPal
- Slack
- Google Sheets
- Mailchimp
- Zoom
- Dropbox
- Google Calendar
- Hubspot
- Salesforce
- See more Integrations
- Products
- PRODUCTS
- Form Builder
- Jotform Enterprise
- Jotform Apps
- Store Builder
- Jotform Tables
- Jotform Inbox
- Jotform Mobile App
- Jotform Approvals
- Report Builder
- Smart PDF Forms
- PDF Editor
- Jotform Sign
- Jotform for Salesforce Discover Now
- Support
