


-
seniorschoolAsked on July 7, 2015 at 1:30 AM
-
BorisReplied on July 7, 2015 at 3:30 AM
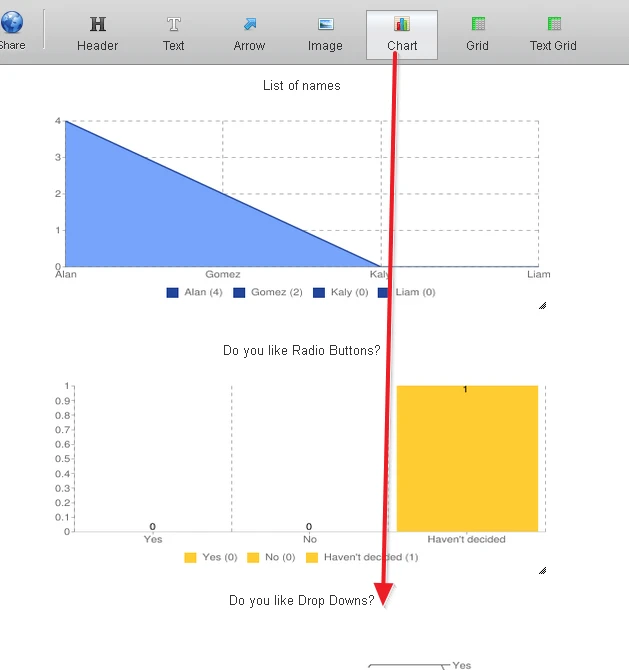
I am sorry, but you can have only one question per chart in the Visual Reports. You can instead set up multiple charts on your Visual Report to display your questions separately, by following this guide: How-To-Use-Visual-Report-Filters.
I hope this helps.
- Templates
- Integrations
- INTEGRATIONS
- See 100+ integrations
- FEATURED INTEGRATIONS
 PayPal
- Slack
- Google Sheets
- Mailchimp
- Zoom
- Dropbox
- Google Calendar
- Hubspot
- Salesforce
- See more Integrations
- Products
- PRODUCTS
- Form Builder
- Jotform Enterprise
- Jotform Apps
- Store Builder
- Jotform Tables
- Jotform Inbox
- Jotform Mobile App
- Jotform Approvals
- Report Builder
- Smart PDF Forms
- PDF Editor
- Jotform Sign
- Jotform for Salesforce Discover Now
- Support