


-
dorokeechAsked on September 18, 2015 at 10:52 AM
-
victorReplied on September 18, 2015 at 12:56 PM
Hello,
This is some what tedious. To add extra charts of the other question, click the type of chart (top tool bar) you wish to add in your form.

A new chart will appear, you will need to change the properties for this

In the properties you can select the question you wish to represent. Once you have finished you may click OK to save and exit.

Please let us now if this helps.
Regards
-
dorokeechReplied on September 18, 2015 at 2:47 PMDon't you think that all the answers to surveys should be automatically displayed? Sounds like an item for an upgrade.
... -
Welvin Support Team LeadReplied on September 18, 2015 at 6:21 PM
The visual report creator will only display the first two questions. You need to add another chart for the rest.
http://www.jotform.com/help/187-How-to-create-a-Visual-Report-with-your-Form-Submissions
It's the same to any type of account plan, free or paid.
Thanks
-
dorokeechReplied on October 2, 2015 at 12:47 PMThis was not helpful. I'm trying to add the responses to all the questions into bar chart format and it does not display appropriately nor can I include the question into the grid to display. I can not tell you if the report display included everything or not. I don't understand why a wizard to create a report doesn't include all the questions from the survey. Pathetic!
... -
Welvin Support Team LeadReplied on October 2, 2015 at 1:31 PM
Please note that our Visual Report Charts can only be based on the following field types:
- Drop Down
- Radio Button
- Check Box
- Star Rating
- Scale Rating
- Grading
- Slider
- Matrix
Other that these types, you can only add the Grid or Text Grid for the other fields.
As for adding all the fields in the visual report creator without doing it manually, it's not possible for now but I have forwarded this thread to our developers as a feature request. We can't promise any timeframe for this, but if there are updates, you should know it via this thread.
Thanks
-
dorokeechReplied on October 2, 2015 at 1:47 PMSince I'm only using those kind of fields--why won't it display on the report
... -
Welvin Support Team LeadReplied on October 2, 2015 at 2:28 PM
By default, the visual report builder will only add two fields. You need to add the other fields manually. To add, just simply drag the chart into the page:
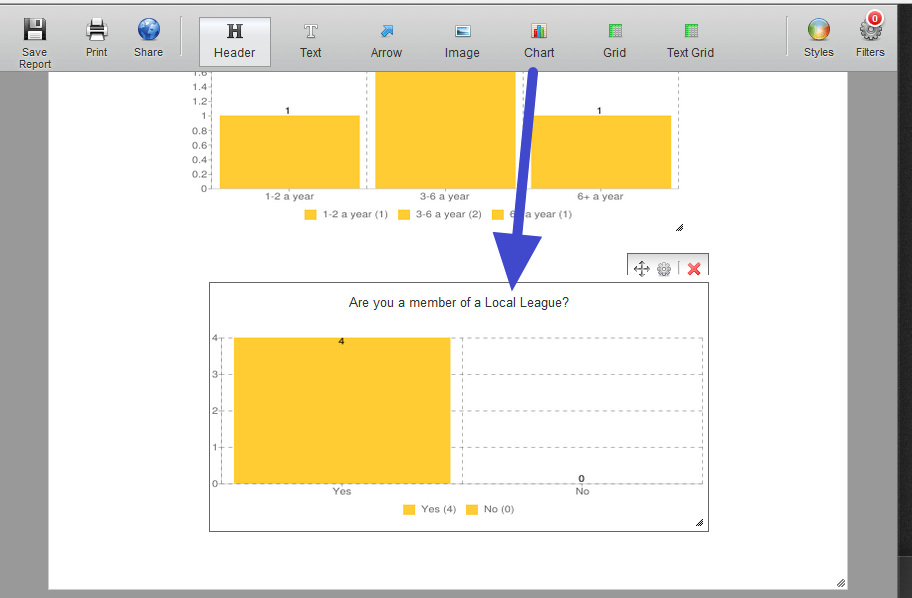
Then click the settings icon to change the chart type:
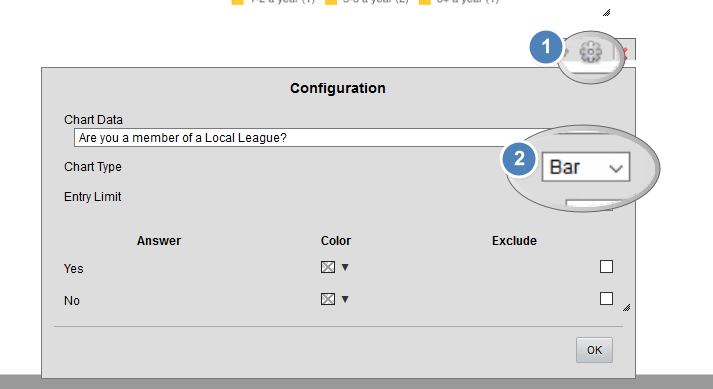
Thanks
- Templates
- Integrations
- INTEGRATIONS
- See 100+ integrations
- FEATURED INTEGRATIONS
 PayPal
- Slack
- Google Sheets
- Mailchimp
- Zoom
- Dropbox
- Google Calendar
- Hubspot
- Salesforce
- See more Integrations
- Products
- PRODUCTS
- Form Builder
- Jotform Enterprise
- Jotform Apps
- Store Builder
- Jotform Tables
- Jotform Inbox
- Jotform Mobile App
- Jotform Approvals
- Report Builder
- Smart PDF Forms
- PDF Editor
- Jotform Sign
- Jotform for Salesforce Discover Now
- Support


