


-
mongabayAsked on November 20, 2015 at 1:16 PM
-
BenReplied on November 20, 2015 at 1:43 PM
To do that, you should:
1. Create the form
2. create the Visual Report
Once you create it, you should:
1. Click on Share button in the Visual Report builder:
2. copy the code for the iframe embed method.
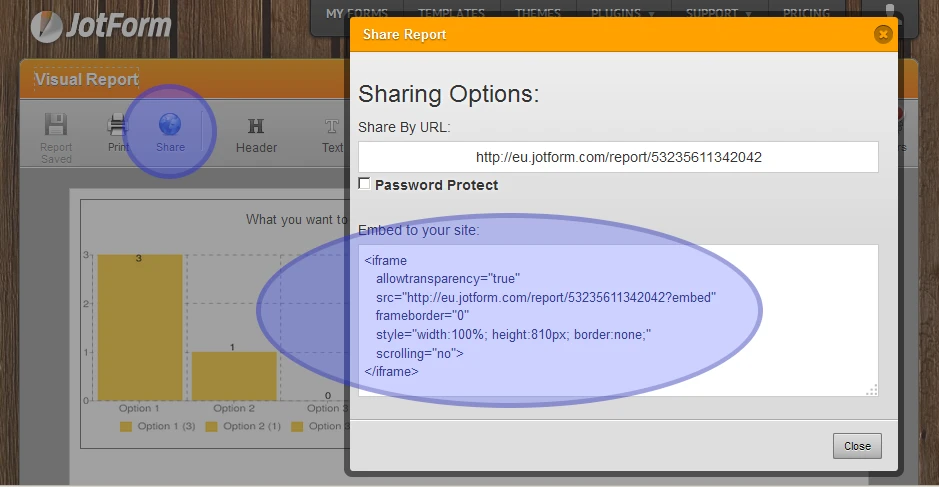
example:
<iframe style="width: 100%; height: 810px; border: none;" src="//eu.jotform.com/report/53235611342042?embed" frameborder="0" scrolling="no">
</iframe>3. Change the embed code to use secure link (important)
- now it looks like this (instead of the original above):
<iframe style="width: 100%; height: 400px; border: none;" src="https://eu.jotform.com/report/53235611342042?embed" frameborder="0" scrolling="no">
</iframe>- As you can see the only difference being https instead of original http
- I also made a change in height of the report since I preferred it to be with lower height for my current setup
* Both changes are in bold
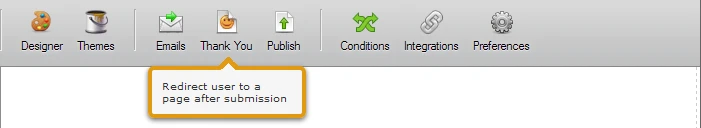
4. Go back to form and edit the thank you page:
5. Select to edit the body of the thank you page:
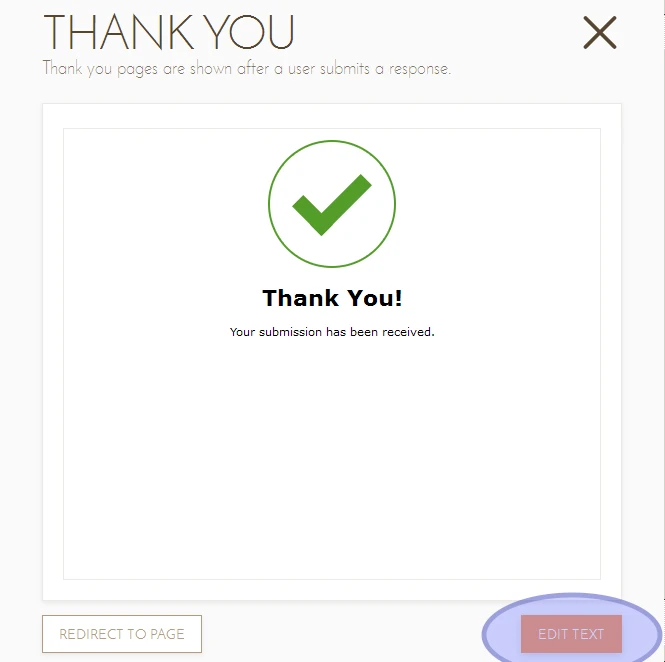
6. Add the iframe code through the source code button in the toolbar. Now for this I made a screen recording as it will be easier to follow:

That is it, you can test your form :)
You can see a quick demo I just made here: https://form.jotform.com/53235085801956
Do let us know how it goes.
-
mongabayReplied on November 20, 2015 at 3:58 PM
I'll be honest that I am having a hard time making it show up nicely in my survey itself. Kind of an awkward process. I put it on the thank you page, but I still can't seem to get it centered, etc.
I think a widget that allows you to easily enter a report into your survey without messing with html code would be a great addition!
But thanks for your help.
-
BenReplied on November 20, 2015 at 4:10 PM
I took a look at your form, this can actually be done by modifying the code just slightly.
Now, I do not want to link to your report, but the same principle applies.
You should follow the steps mentioned above to add the iframe, which will allow you to see the iframe code.
Now once you see it, just change the width style.
So, instead of it showing:
width: 100% it should be showing width:80%
Making this change on my example code from above:
Before:
<iframe style="width: 100%; height: 400px; border: none;" src="https://eu.jotform.com/report/53235611342042?embed" frameborder="0" scrolling="no">
</iframe>After:
<iframe style="width: 80%; height: 400px; border: none;" src="https://eu.jotform.com/report/53235611342042?embed" frameborder="0" scrolling="no">
</iframe>Do let us know if that is what you were after, and of course if you have any additional questions, do let us know and we would be happy to assist with them :)
-
mongabayReplied on November 20, 2015 at 4:58 PM
Yeah - it still isn't centered, but it is better. Thanks!
-
BenReplied on November 20, 2015 at 5:24 PM
You are welcome :)
You can play with the exact width, I was going for a round number, but the 100% is usually the best since it will take as much as you want.
If you had used other as text field that is part of the other elements, then your graph would resize to include the votes for the values of other (and since it is not likely that everyone will type in the same thing in the same manner, you would end up having a very wide report).
Since it is not, you can not only use percentage (80%), but also pixels (500px) to set the size that you like the most.
I should say that the iframe that holds the graph is now centered, but the data that it shows starts in its own manner and as such seems as not centered, so you will never be able to center it completely - without some changes in the Visual Report itself.
- Having that said, I would suggest trying to move the graph left to right in the Visual Report.
- Templates
- Integrations
- INTEGRATIONS
- See 100+ integrations
- FEATURED INTEGRATIONS
 PayPal
- Slack
- Google Sheets
- Mailchimp
- Zoom
- Dropbox
- Google Calendar
- Hubspot
- Salesforce
- See more Integrations
- Products
- PRODUCTS
- Form Builder
- Jotform Enterprise
- Jotform Apps
- Store Builder
- Jotform Tables
- Jotform Inbox
- Jotform Mobile App
- Jotform Approvals
- Report Builder
- Smart PDF Forms
- PDF Editor
- Jotform Sign
- Jotform for Salesforce Discover Now
- Support


