


-
arfazAsked on October 4, 2016 at 9:34 AM
When I apply filters, no values appear on the graph. Could you please help with this? The answers are both in qualitative and quantitative/rankings form. I suspect that this is the difficulty. Thank you.
-
Nik_CReplied on October 4, 2016 at 12:26 PM
Please allow me some time to investigate this further and I'll get back to you.
Thank you for your understanding.
-
Nik_CReplied on October 4, 2016 at 5:27 PM
Thank you for your patience.
I checked your form further, so to show all responses in your Visual report you will have to enable other questions to be shown in pie chart:
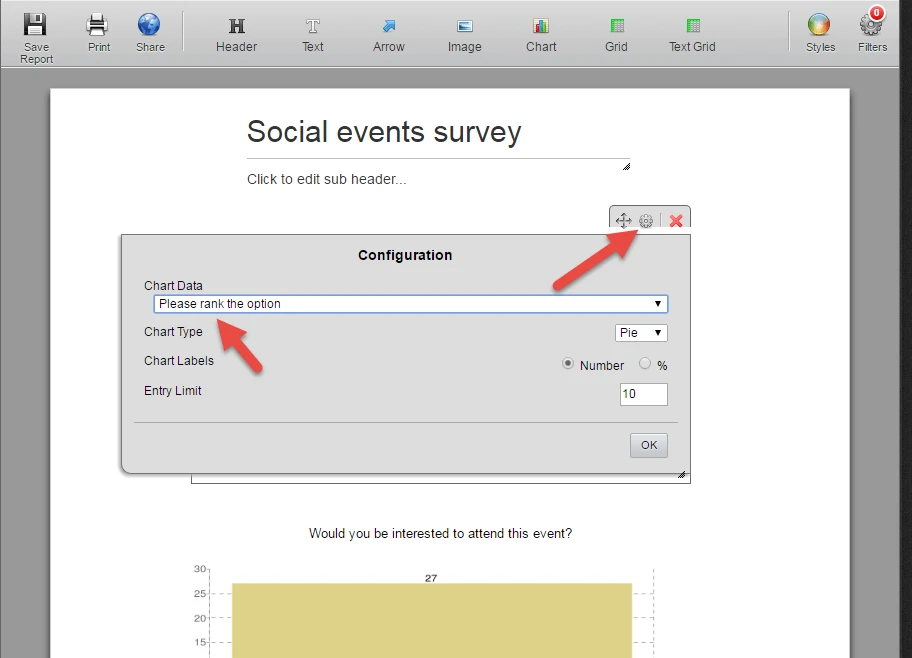
And this is how it looks like:
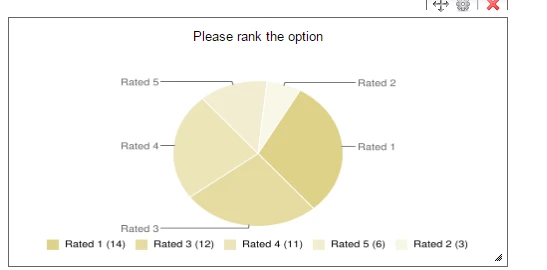
Hope it helps.
If you need any further assistance please let us know.
And thank you again for waiting.
- Templates
- Integrations
- INTEGRATIONS
- See 100+ integrations
- FEATURED INTEGRATIONS
 PayPal
- Slack
- Google Sheets
- Mailchimp
- Zoom
- Dropbox
- Google Calendar
- Hubspot
- Salesforce
- See more Integrations
- Products
- PRODUCTS
- Form Builder
- Jotform Enterprise
- Jotform Apps
- Store Builder
- Jotform Tables
- Jotform Inbox
- Jotform Mobile App
- Jotform Approvals
- Report Builder
- Smart PDF Forms
- PDF Editor
- Jotform Sign
- Jotform for Salesforce Discover Now
- Support
