


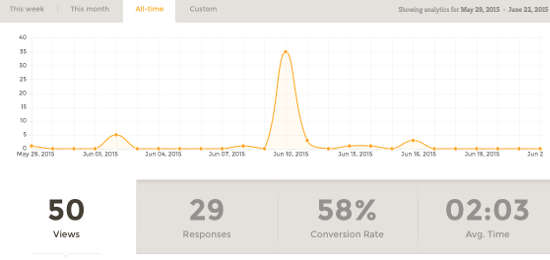
With Jotform’s recent release of Form Analytics many users have been taking advantage of the real time data readily available in our easy-to-use interface. In seconds people can find a wealth of information, displayed in attractive charts and graphs and sortable by custom date range. We sent out a survey to a handful of our more active users to gauge their response, learn what features they liked, and to see what features they might hope to be included in a later version.
The results are in- Jotform users love Form Analytics. How are they using it though? That varies from person to person. Here are some of the highlights.
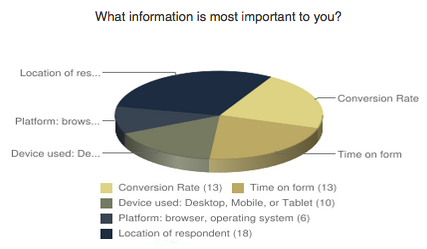
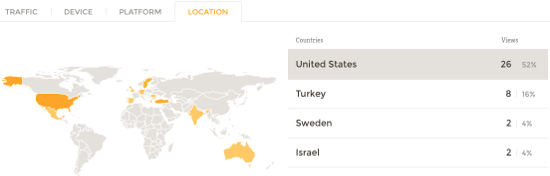
Location
The most valued information is the location of the responder. People would like to know where their respondents reside. This gives people assurance that they’re successfully reaching their target audiences. If for some reason a significant number of people are responding from countries outside your demographic, perhaps it’s time to reevaluate your distribution channels. Or it can be an indicator of a target market you hadn’t originally planned for.
Conversion Rate & Time on Form
Once it’s established that the form is reaching its intended audience, the next most important stats are if the form is actually being used. The best indicators of this are conversion rate, and the time spent on the form. These will give you a good indicator as to whether people are spending the time needed to fill out the form, and then in turn pressing submit. If you have a high conversion rate, but low time spent on the form, it means people may be filling it out too quickly. Or if they’re spending a lot of time on the form but the conversion rate is low, the form might be too long, it needs a save and continue option, or maybe some questions are off-putting to users. Not surprisingly, these stats were among the most useful to users.
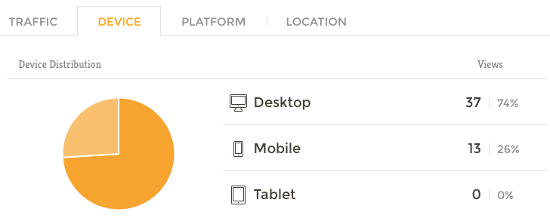
Devices Used
It’s quickly becoming common knowledge that it’s no longer OK to build websites just for desktops. People are likely to access your site from their tablets and mobile phones as well. Google recently updated their algorithm to reflect this, in what was known to web developers as “Mobilegeddon.” It wasn’t quite as impactful in search results as some feared, but the fact remains that sites that aren’t mobile accessible will ultimately be penalized in Google’s search results.
With Jotform’s Form Analytics, it’s easy to see what devices people are using to access your site. If people are using mobile and tablets primarily to access your site, it lets you know that you should not only ensure it’s mobile friendly, but designed and optimized for it.
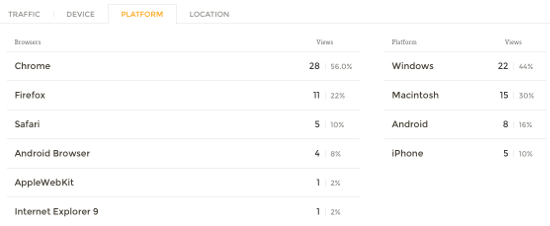
Platform
The last section is the platform people used. This is the Operating System and Browser used when filling out your forms. Although Jotform’s forms work well across all relevant systems, it’s always a good idea to check. For instance, many older systems might have layout issues with the website the form is embedded on. Or you may discover a large amount of people are using an uncommon browser. Or you might be so lucky to discover your users are early adopters in a yet to be released browser or operating system. These are all things website owners need to be aware of in making design decision, as well as targeting their marketing efforts.
Jotform’s Form Analytics is taking off. It gives you the information needed to ensure your forms take off with it. Be sure to check it out today!


Send Comment:
1 Comments:
More than a year ago
Nice article! I've been a big fan of using Form Analytics so far.