Visualize Submission Data
Ask Jotform AI Data Assistant to visualize your form submissions using natural language. Simply describe the data you want to analyze, and AI generates the right chart in seconds.
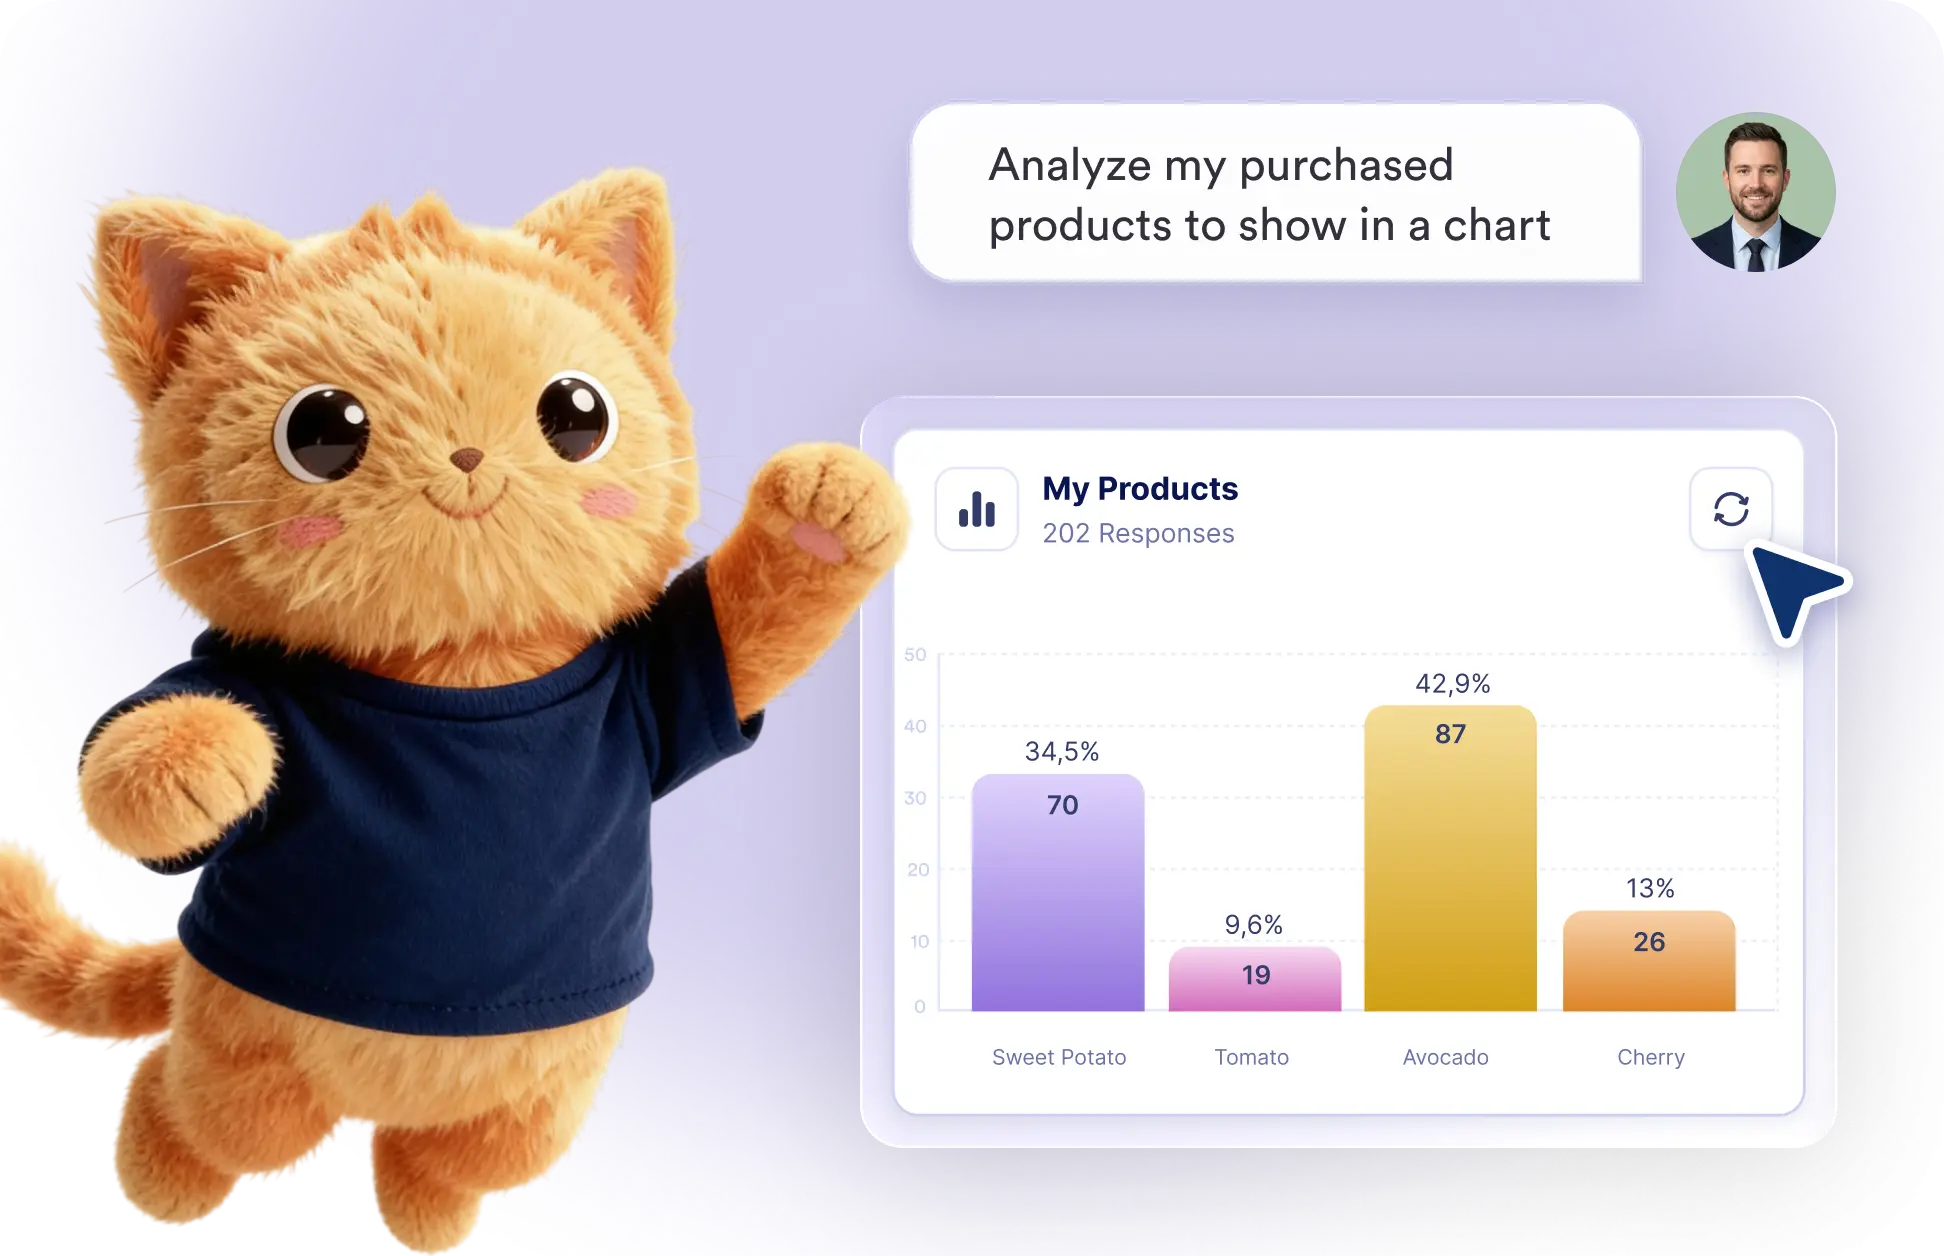
Skip manual reporting and chart creation. Type prompts like “Show my sold products this year in a chart,” and Jotform Data Assistant instantly transforms your submission data into visual insights.
Create Charts From Form Data With AI
Explore trends, compare results, and monitor performance without creating reports manually. Describe the data you want to visualize, and AI builds clear charts from your form submissions.
Generate Charts From Simple Prompts
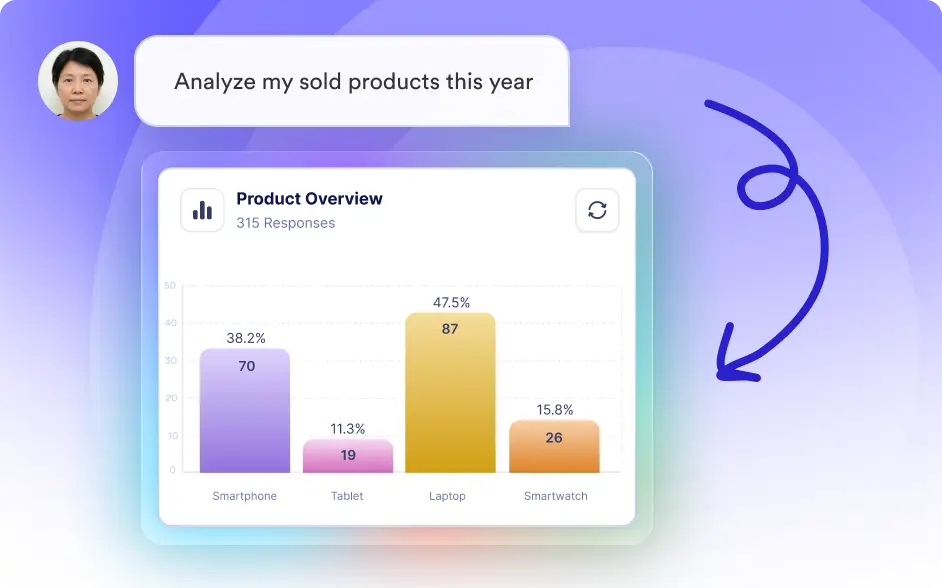
Ask questions like "Analyze my sold products this year" or "Show monthly registrations," and Jotform Data Assistant creates charts that make your submission data easy to understand.
Frequently Asked Questions
Simply describe the data you want to visualize, such as "Show my sold products this year in a chart." Jotform Data Assistant analyzes your submissions and generates an appropriate visualization automatically.
You can visualize any information stored in your form submissions, including sales, registrations, survey responses, order data, customer activity, and other submission fields.
No. Jotform Data Assistant AI understands natural language requests, analyzes your submission data, and creates charts automatically, making data analysis faster and more accessible.