


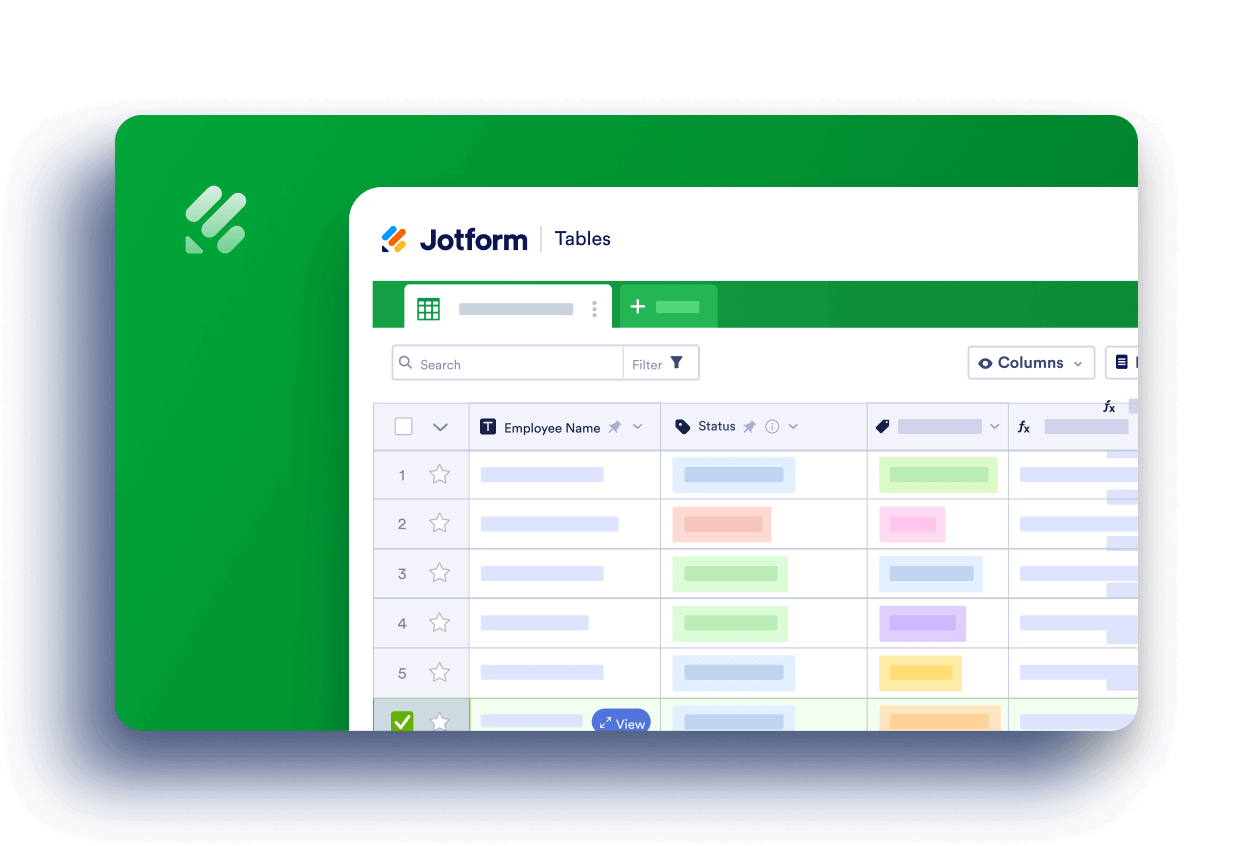
Jotform Tables was created to let you, as the form owner, manage your data in a workspace that’s easy to navigate. It is also focused on collaboration, so your team can easily take part and manage your data.
Table view is Jotform Table’s default view, but you can have a different view in the following layouts:
- Calendar
- Cards
- Uploads
- Report
Creating a different view is relatively straightforward. Here’s how you can do it:
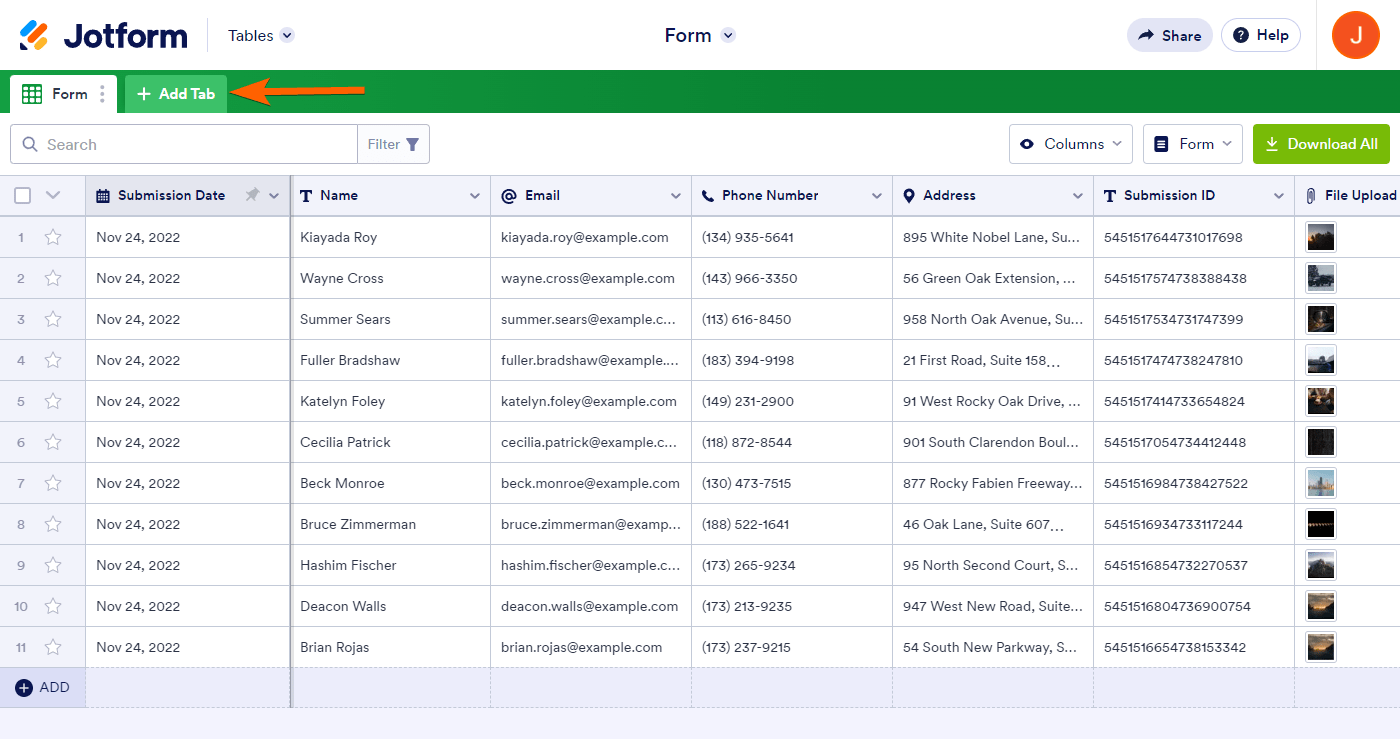
- In Jotform Tables, click the + Add Tab button at the top-left part of the page.
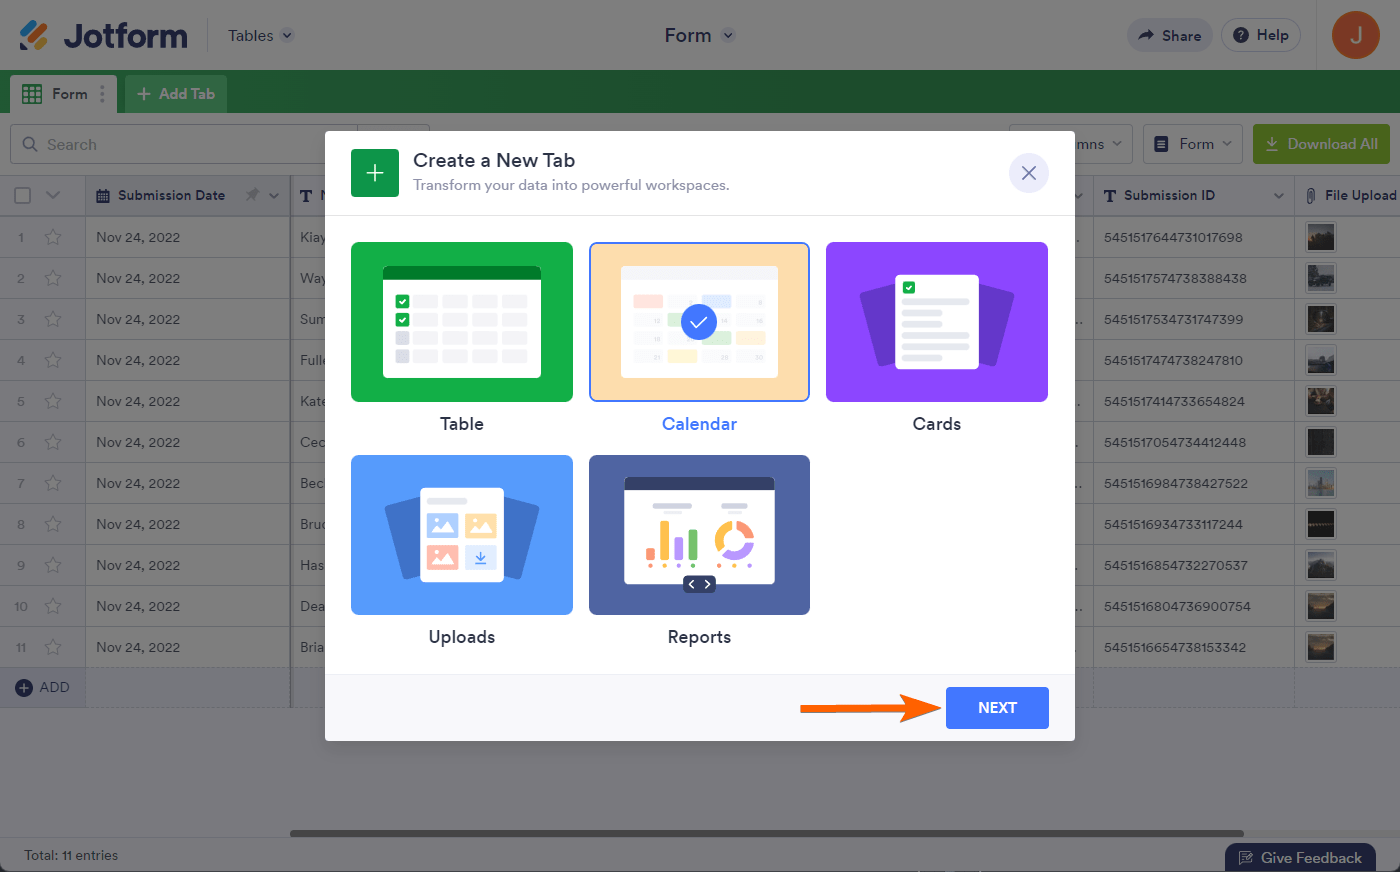
- Choose the view you want from the list — for example, Calendar.
- Click on Next to choose whether to create a blank view or import existing data.
For the full steps, please click the links from the below sections.
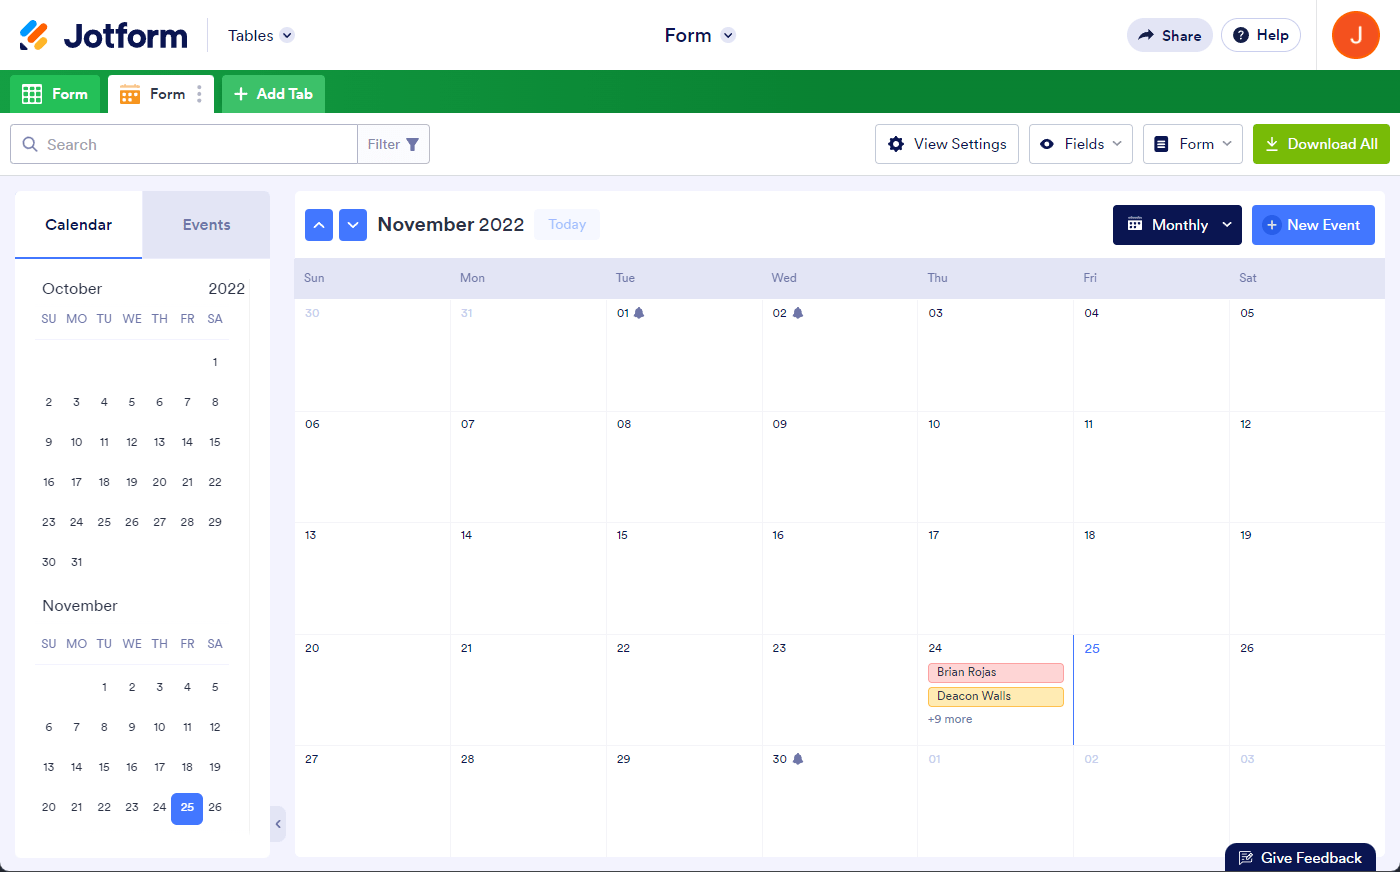
Calendar View
The Calendar View is useful for forms like RSVPs, event registrations, and forms that have a date or appointment field. For example, if you’re using Calendar view for submissions to an appointment form, you’ll see a calendar display that includes the names of the users who booked their appointments through your form.
Here’s what this looks like:
Visit the following guide for more details about Calendar view: How to Add a Calendar View in Jotform Tables.
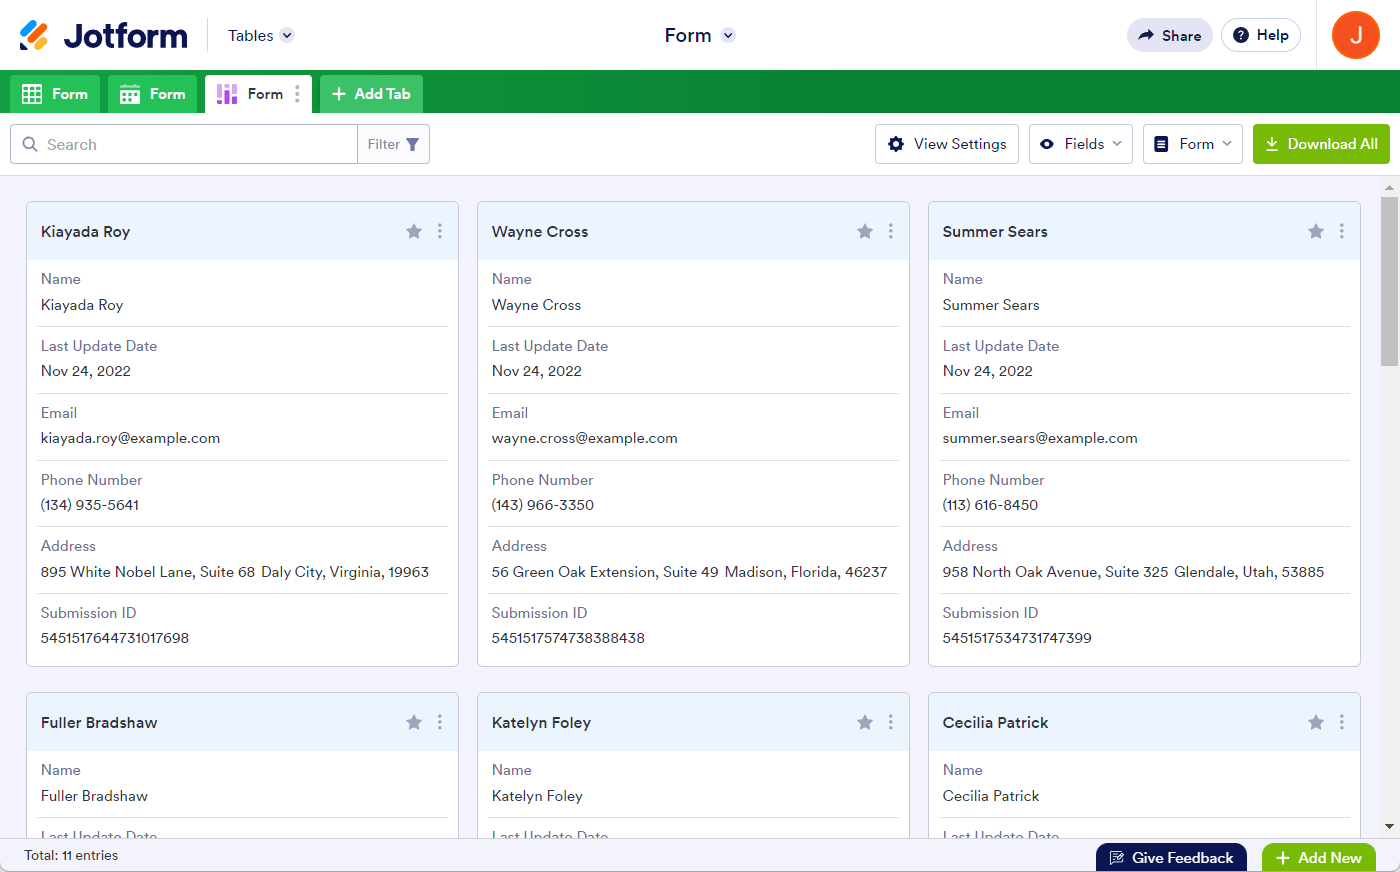
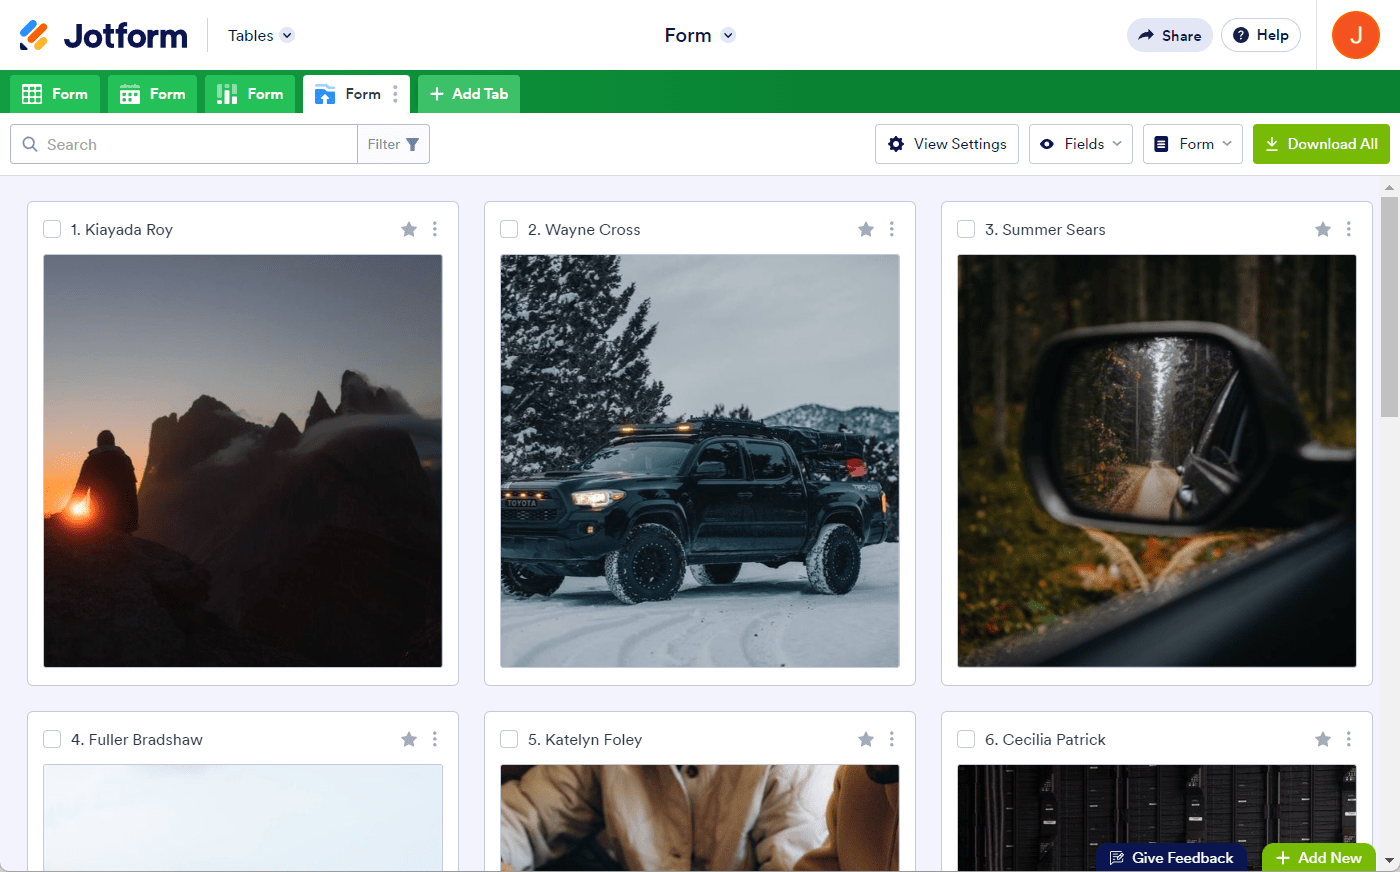
Cards View
Cards view displays your form submissions in card format. This allows you to view data on each submission quickly. You can also selectively display specific fields on each card. That way, you get a quick glimpse of the information you need.
Cards view looks like this:
Visit the following guide for more details about the Cards view: How to Add a Cards View in Jotform Tables.
Uploads View
Uploads view is useful for forms that include a file upload field. However, you can also create a blank upload view. This is helpful when storing files related to your form submissions.
Here’s an example of the Uploads view:
Please visit the following guide for more details about the Uploads view: How to Add an Uploads View in Jotform Tables.
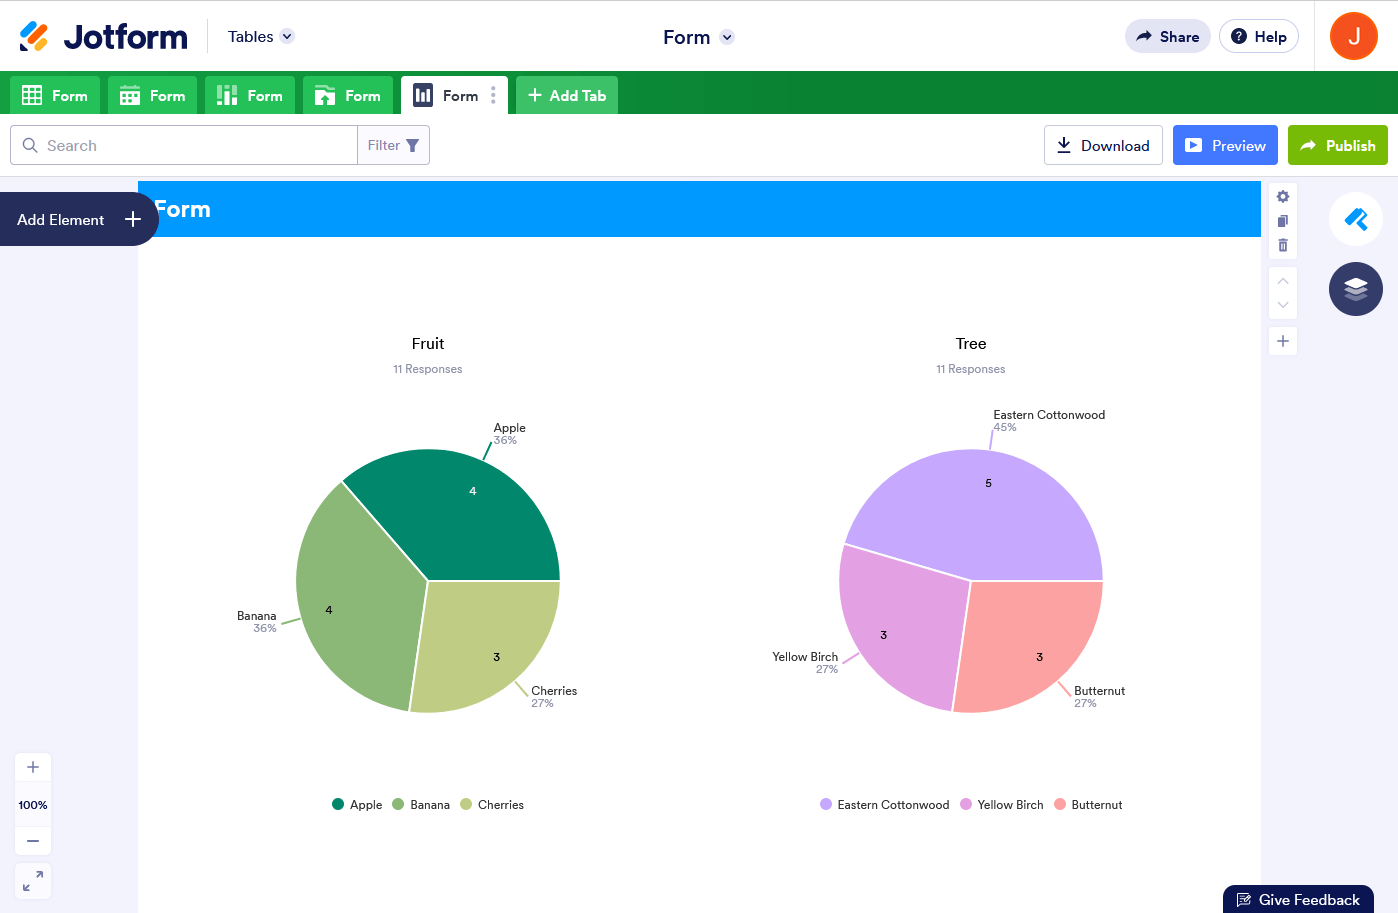
Report View
Last is the Report view. It’s the visual report of your form submissions. In Report view, you can generate bar graphs, pie charts, line graphs, form submission grids, and HTML text and images.
You can use bar graphs, pie charts, and line graphs to tabulate results from your form’s single-choice, multiple-choice, and dropdown fields.
In Report view, you can create three report types:
- Blank – This allows you to create a report from scratch.
- Extended – A single chart is shown on each page by default.
- Compact – Two charts are shown per page by default.
You can share reports by generating a link. Reports can also be embedded in an iFrame format.
Here’s an example of a Report view in a compact layout:
For more details about Report view, please visit the following link: How to Create Automated Reports in Jotform Tables.
Send Comment:
2 Comments:
More than a year ago
Hi,
How many tabs can one submission table have?
More than a year ago
I was testing the new tables stuff and created a new calendar tab. After some experimentation, I decided not to use the calendar, but when I go to delete the tab, I get a warning that it will delete all of my data permanently. Is this accurate? How do I delete the tab that I am not going to use?