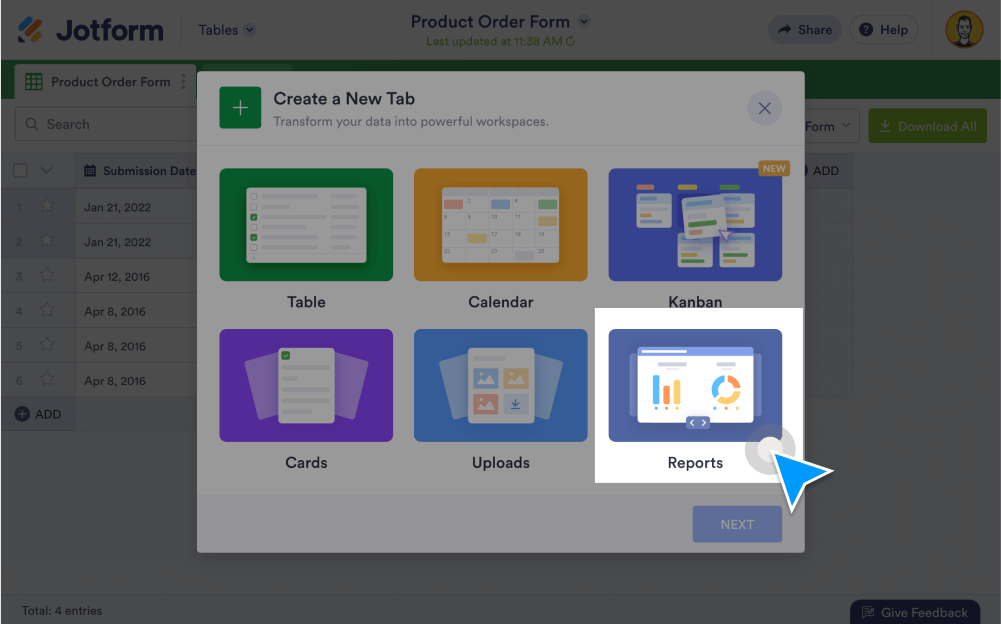
Generate visual reports from your data without coding. Using Jotform Report Builder, you can turn submissions into charts, , set up search filters, and share, embed, or print your reports.
Create Visual Reports
See your form data in a whole new way. Generate form reports using Jotform Report Builder.
Generate reports automatically
Convert form responses into visually stunning reports with customizable charts, graphs, grids, and more. Your automated report will immediately update after each new submission.
Summarize entries with charts
Get an instant summary of your submissions. View results in an automatically generated bar chart, which you can change to a donut, pie, or column chart.
Turn submissions into visuals
Visualize your data in just one click. Transform form submissions into bar graphs, pie charts, grid lists, and more.
Import Excel or CSV files
Add your existing data to Jotform Report Builder as a CSV or Excel file. Just upload your file, choose your import settings, and select which type of report you want to generate.
Set up search filters
Analyze submission trends or patterns by applying customizable filters to your search results without doing any coding.
Customize visual reports
Make your visual reports look exactly how you want them to. Customize your layout settings, choose a new color palette, change the chart style, and more.
Share Reports with Ease
Show your reports to coworkers, clients, stakeholders, and others. Send a link to your report, embed it in any web page, or simply download and print it out for meetings.
Embed visual reports
Add a visual report to your website. Embedded reports auto-update when you receive new submissions, so you’ll always see the most up-to-date data.
Share with a link
Copy and paste a report URL to send your form reports to colleagues, clients, or stakeholders. When sharing the link, you can customize the privacy settings to keep your reports secure.
Download and print reports
Download or print your report as a PDF document in a few easy clicks. When sharing your report online, you can set permissions to give others the ability to download or print it.