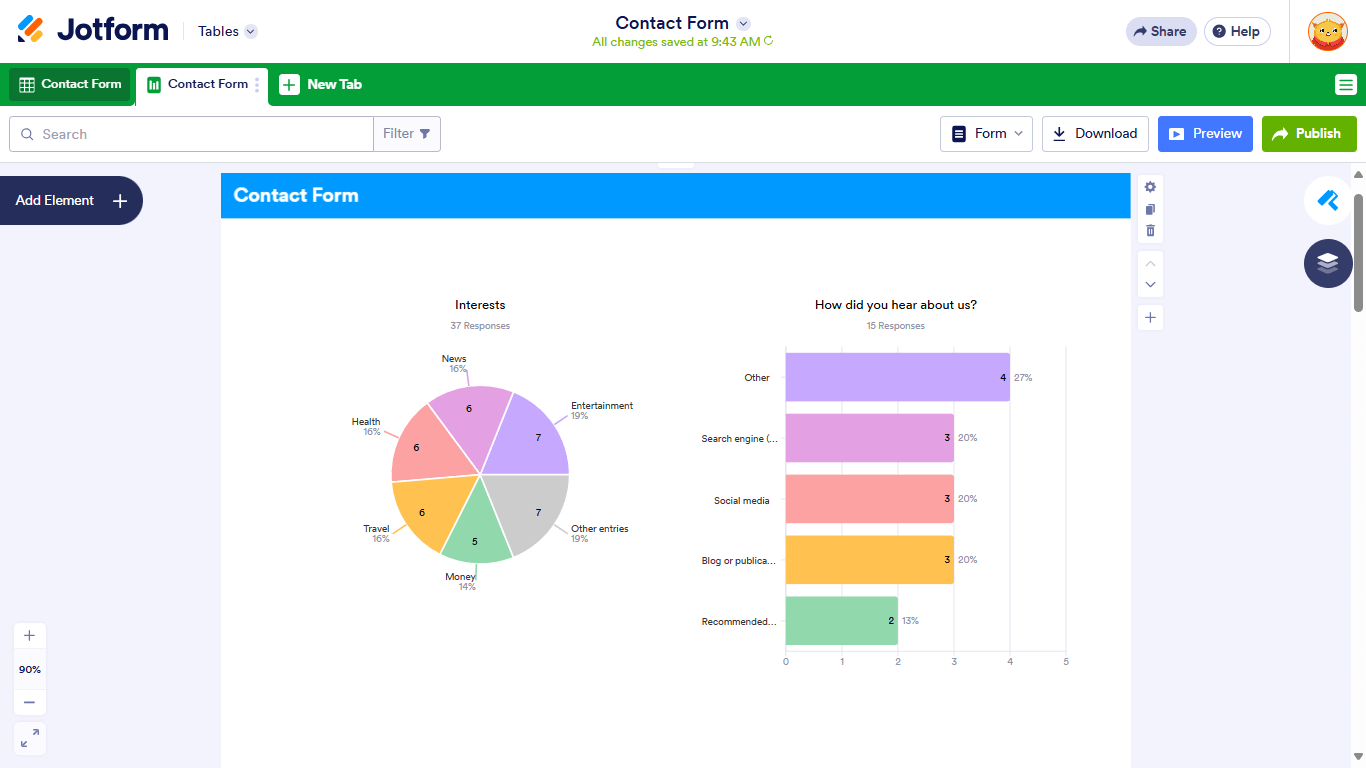
The Reports view in Jotform Tables is a visual display of your form data. It’s an automated report generation system that can generate bar graphs, pie charts, line graphs, form submission grids, and HTML text and images.
To set up automated report generation
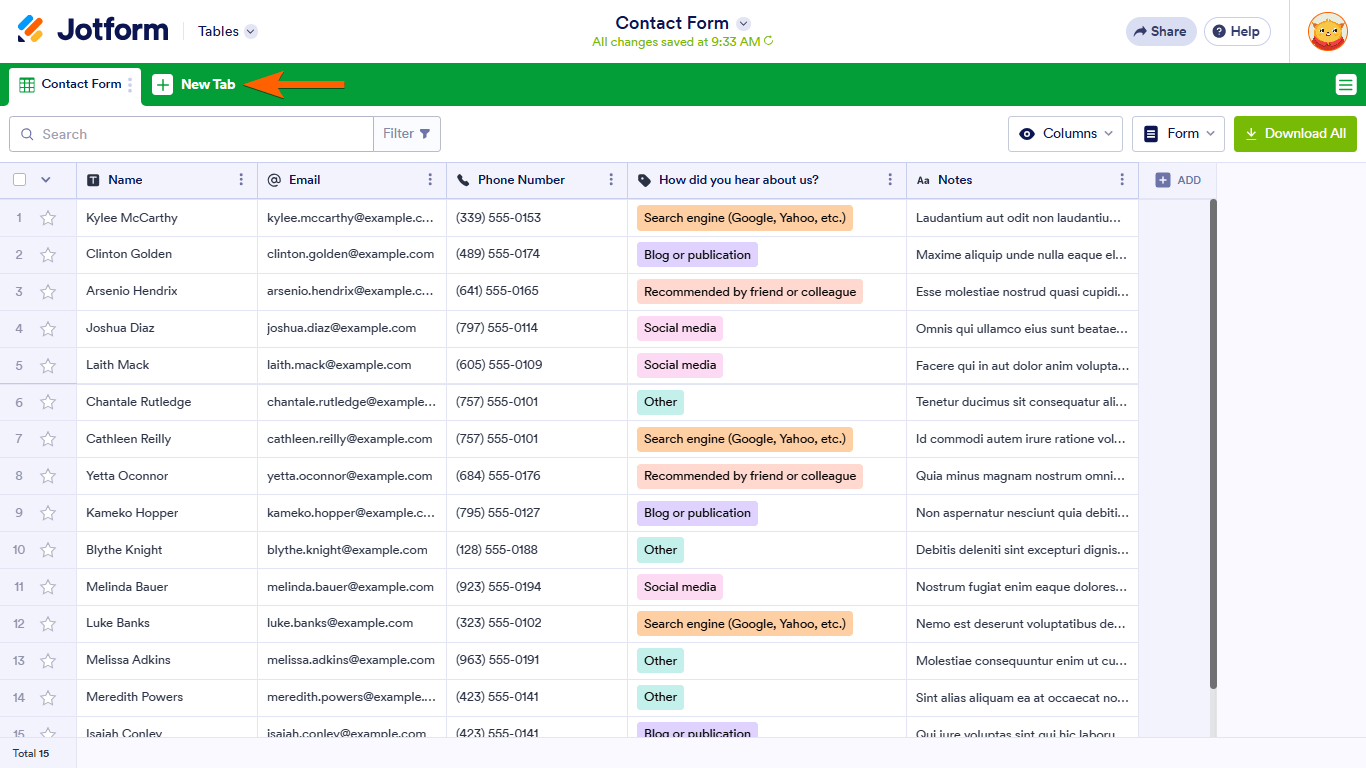
- In Jotform Tables, select New Tab at the top.
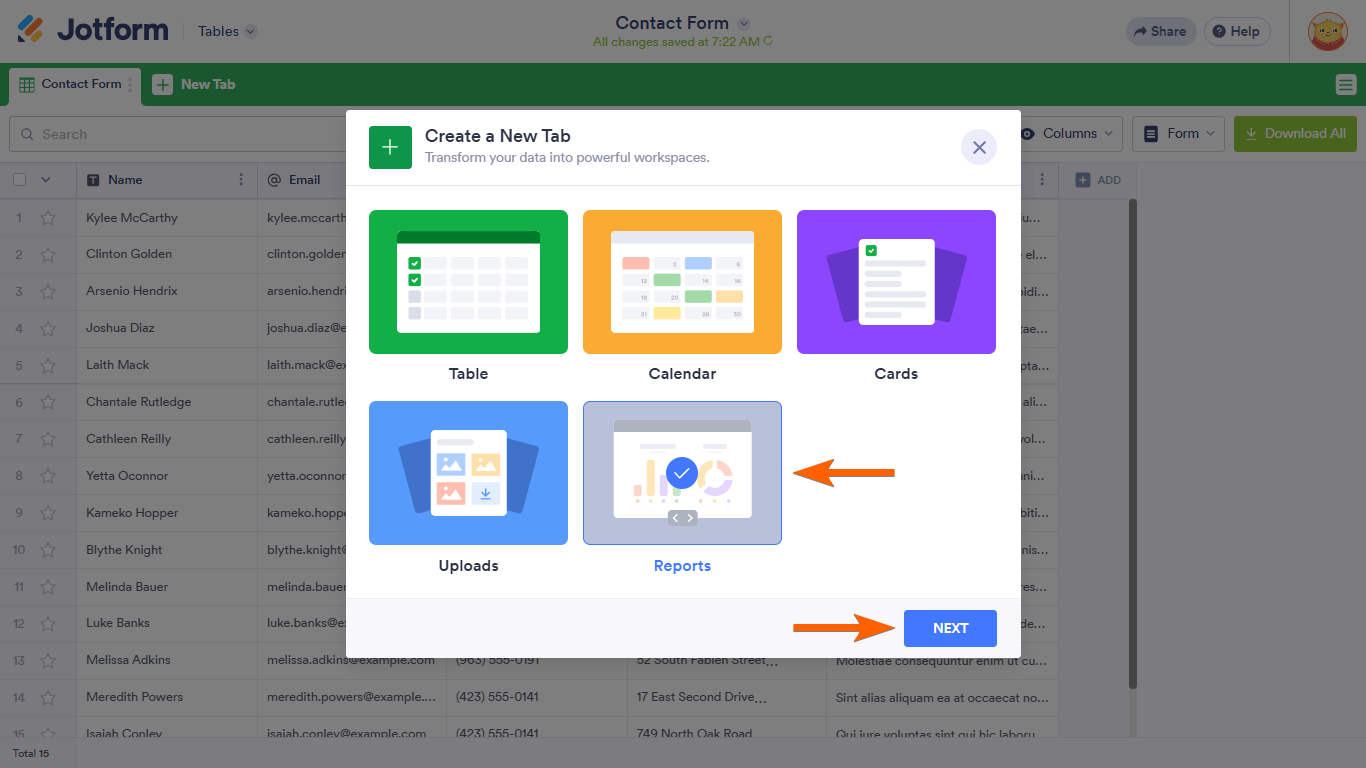
- In the dialog, select Reports.
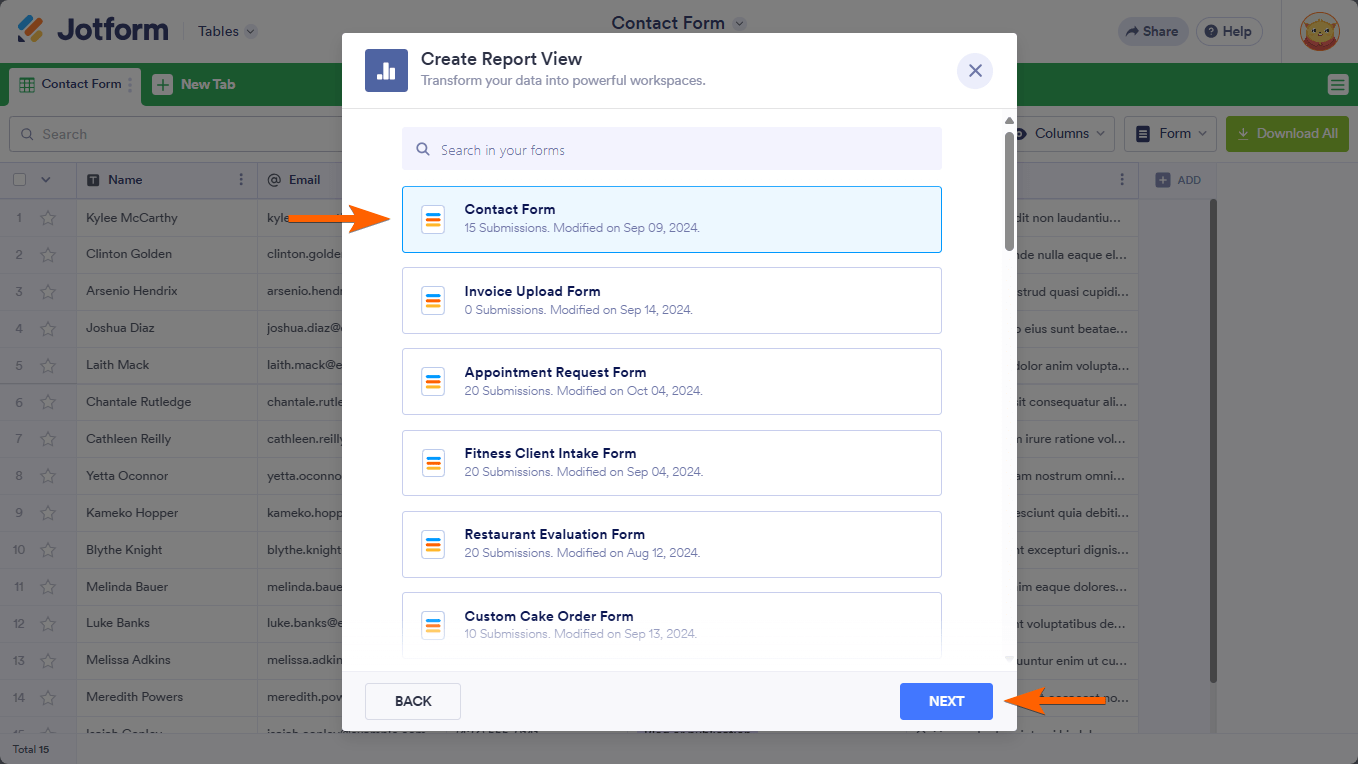
- Choose a form to use.
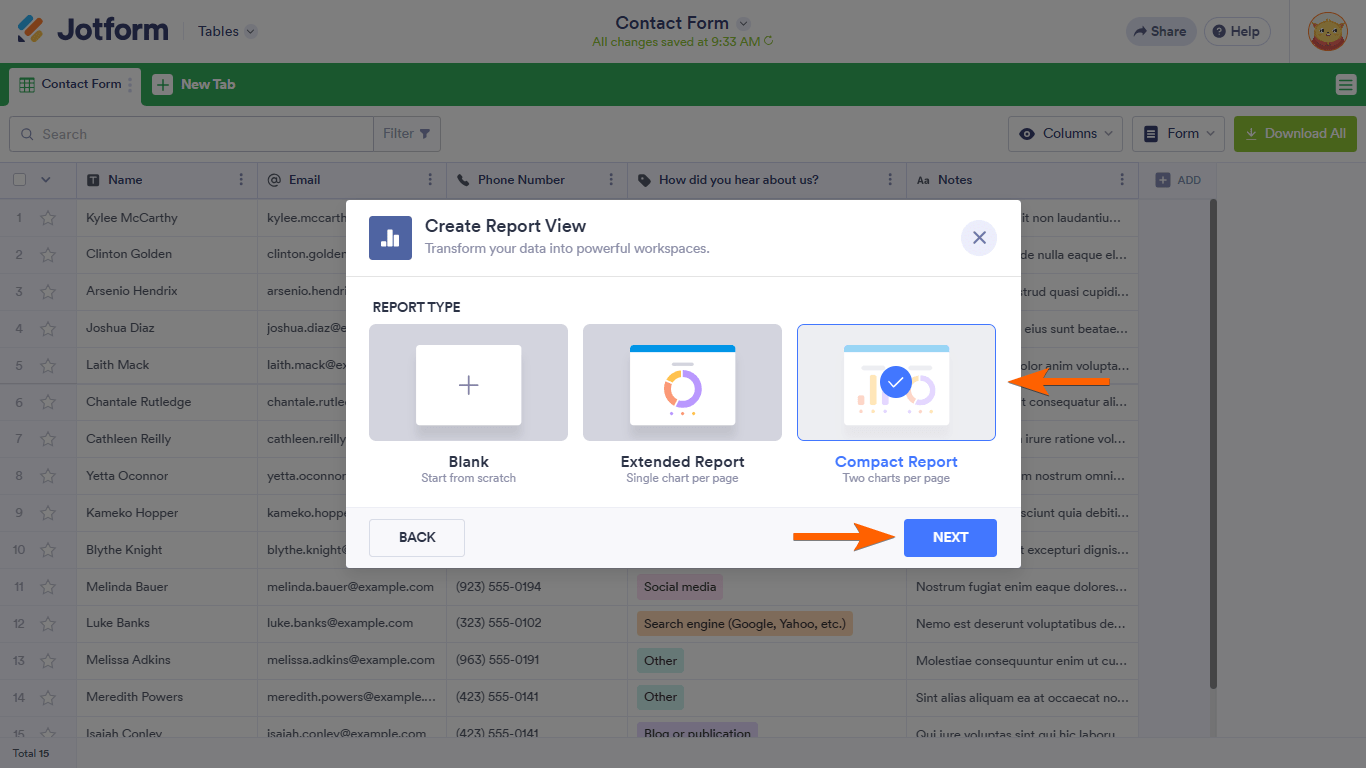
- Select Extended or Compact report type to quickly create a report. Or select Blank to customize a report from scratch.
Your table’s automated report generation is now ready. The report automatically updates when you receive new submissions on your form.
Customize your Report view to your liking. See How to Customize the Report View or Visual Report to learn more.

Send Comment:
5 Comments:
August 13, 2025
Can I add a filter to the report ?
June 20, 2025
is there a way to automate monthly reports that get sent to specific people
October 8, 2023
Hi there,
Is there a way to send the reports automatically on a weekly or monthly bases?
March 28, 2022
Is it possible to apply date range filters to these reports?
So say you only want the rpeort to be for the current month.
February 28, 2021
Unable to create reports from my submissions with over 77,000 records. Help