With Jotform Report Builder, you can effortlessly transform your submission data into visually appealing reports. You can customize your reports with text, images, bar graphs, pie charts, and data grids to present your data in a clear and engaging way.
Creating a Visual Report in Your Workspace
You can easily create visual reports in your Workspace, turning your submission data into charts and graphs for quick analysis. Here’s how to do it:
- On your My Workspace page, click on Type at the top and in the Dropdown menu that opens, uncheck the boxes next to all the assets except Forms, so only they’ll be shown on the page.

- Next, select the form that you want to generate a Visual Report for.
- Then, in the menu at the top, click on Reports.

- Now, click on Add New Report.

As an alternative, you can also click on More on the right side of the screen and in the Dropdown menu, click on Create Report.

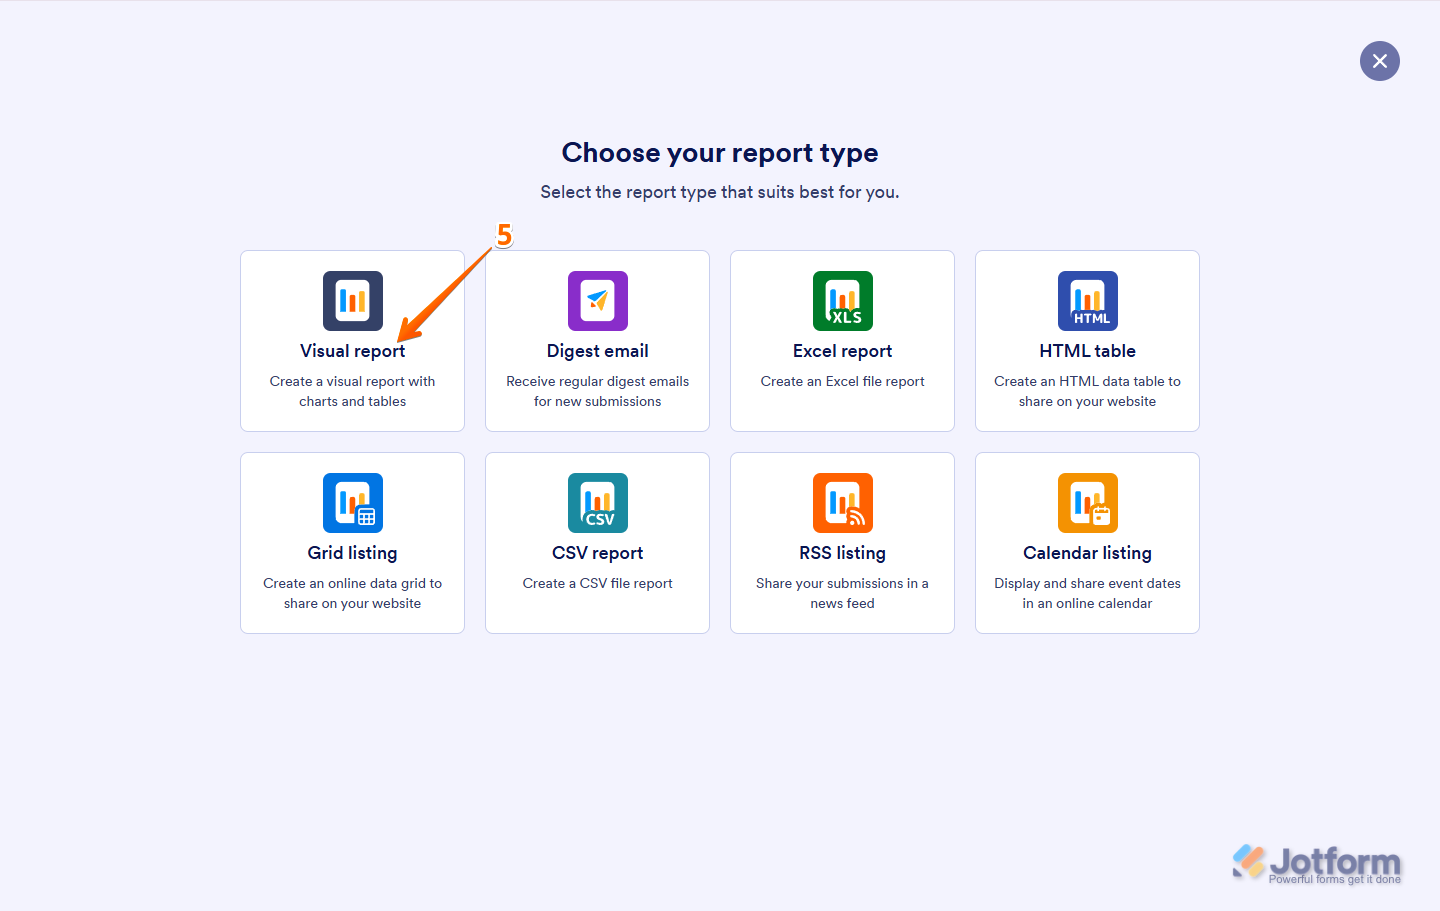
- On the Create Report page that opens up, click on Visual Report.
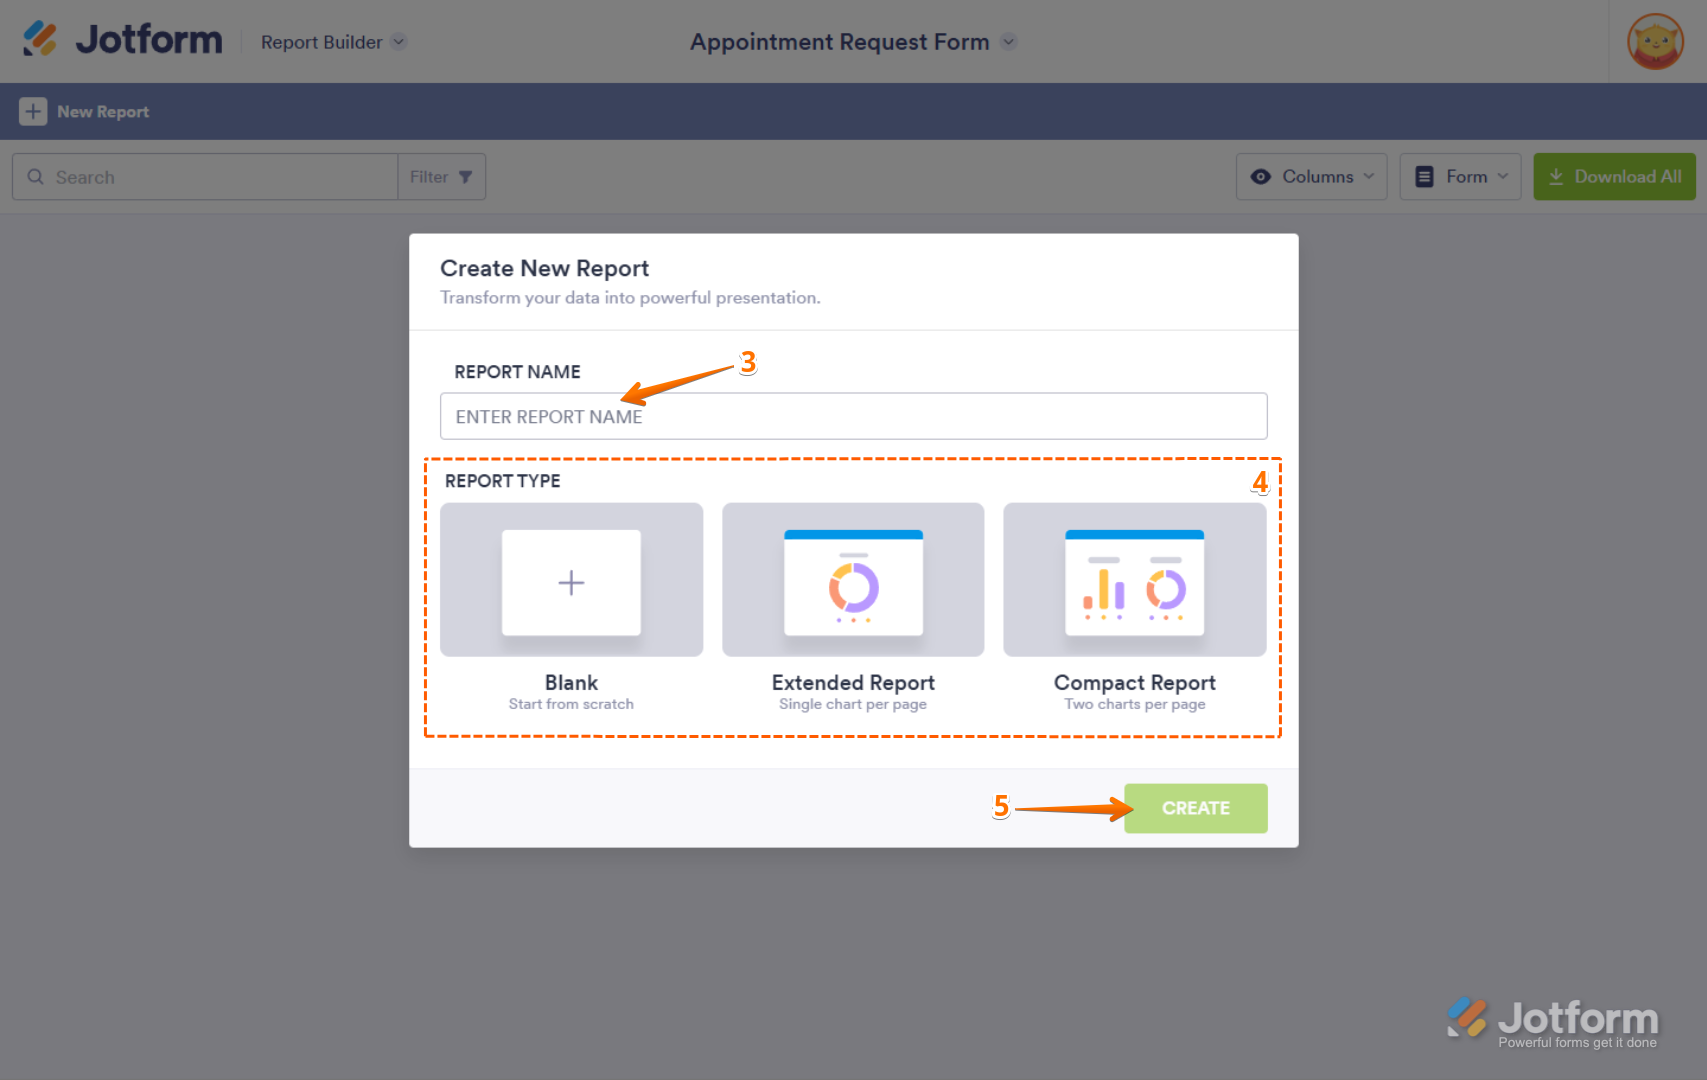
- In the window that opens, enter a Report Name.
- Then, select from the following report types:
- Blank — Start from scratch and add your charts manually.
- Extended Report — A single chart is shown per page.
- Compact Report — Two charts are shown per page.
- Now, click on Create at the bottom of the page, and you’re all set.

Note
For the Extended and Compact report types, Report Builder will automatically generate charts for supported form fields and widgets.
Creating a Visual Report from Any Open Form Page
Form Builder allows you to create visual reports directly from your form submissions, making data presentation seamless and efficient. Here’s how to do it:
- On any page where your form is open, click on the Downward Arrow icon on the top-left side of the screen.
- Then, in the menu that opens up, select Report Builder.
- In the window that opens up, enter a Report Name.
- Then, select from the following report types:
- Blank — Start from scratch and add your charts manually.
- Extended Report — A single chart is shown per page.
- Compact Report — Two charts are shown per page.
- Now, click on Create at the bottom of the page, and you’re all set.
Adding Elements into Your Visual Report
The Add Element button in Report Builder opens the Add Elements menu, allowing you to customize your visual report. You can select elements directly or drag them from the panel to your report page. The Add Elements menu includes two categories: Basic Elements and Form Fields. Let’s explore each in more detail below.
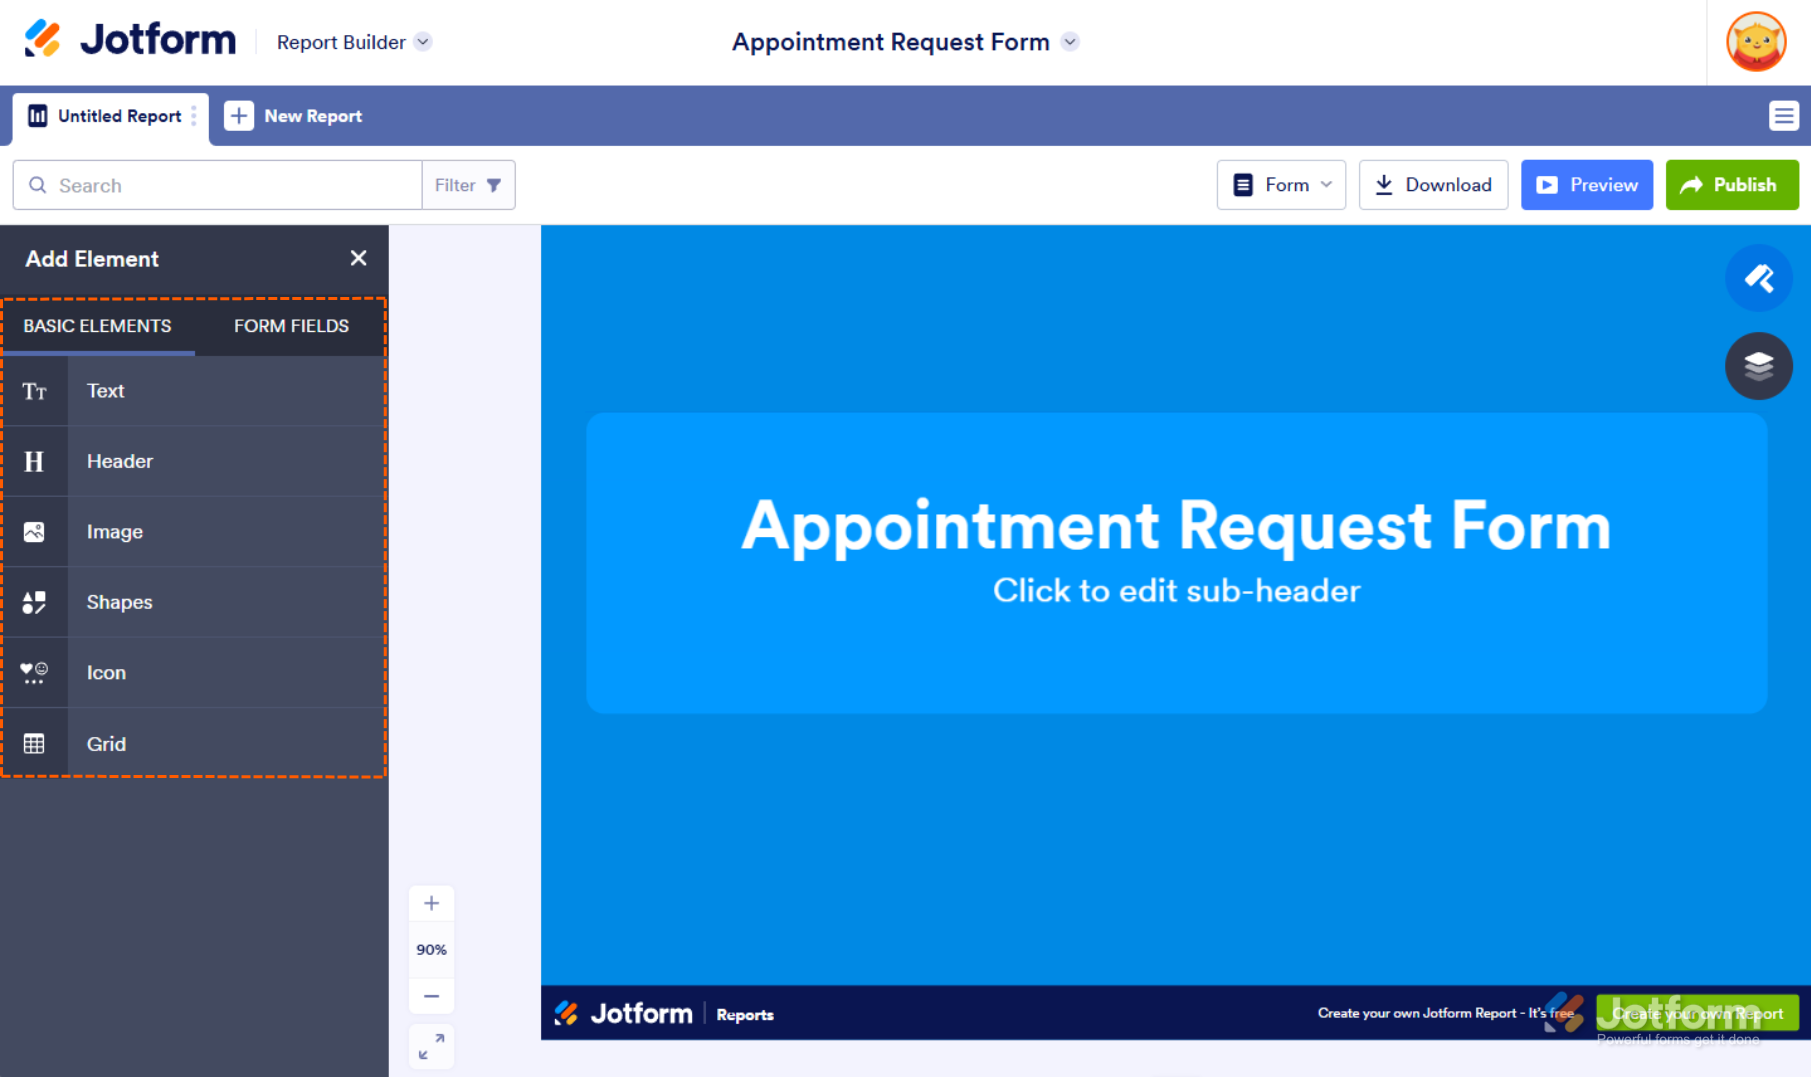
Basic Elements
The Basic Elements tab provides essential tools to enhance and customize your visual report, making it more informative and visually engaging:
- Text — Display long paragraphs or hyperlinks.
- Header — Display heading text for titles.
- Image — Add your company logo or custom images.
- Shapes — Include shapes in your report.
- Icon — Include icons in your report.
- Grid — Display submission data in your report.
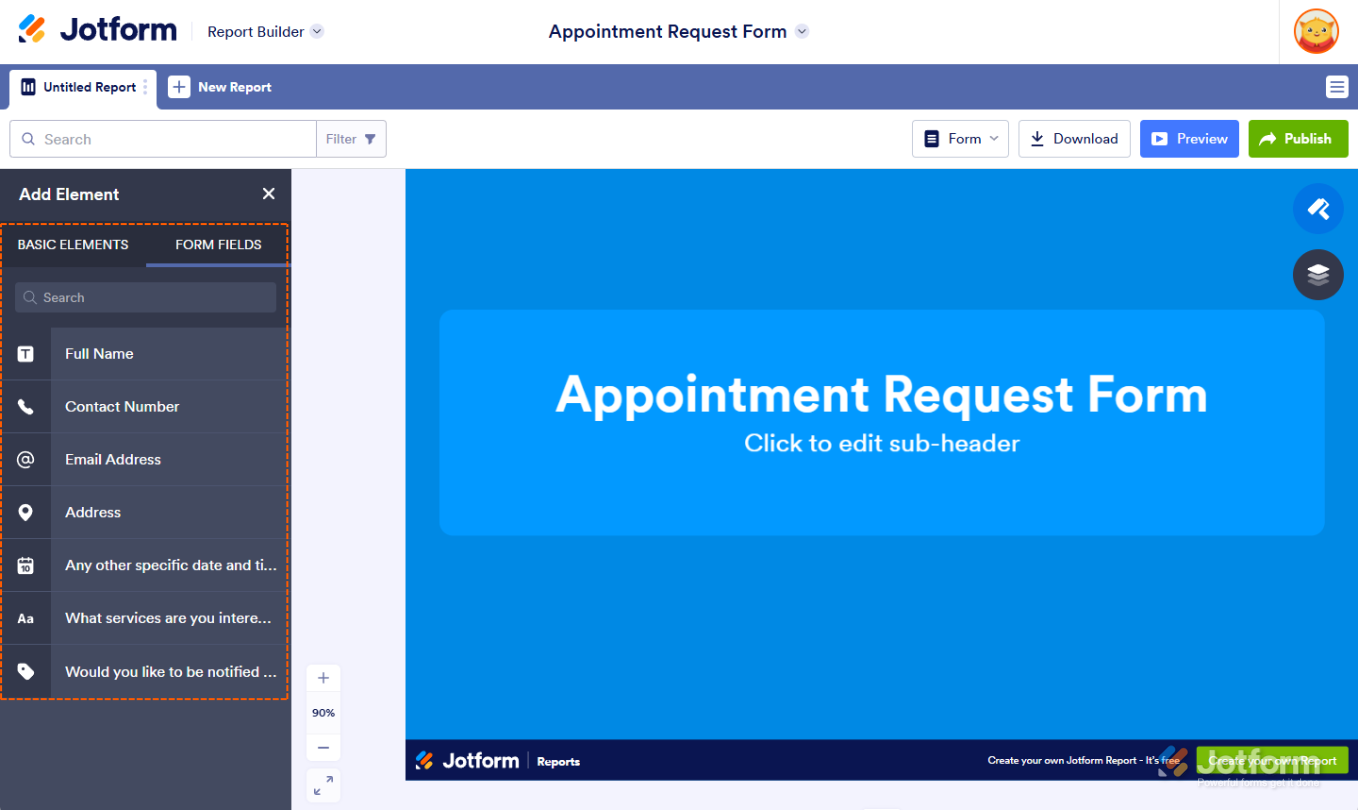
Form Fields
The Form Fields tab lists all the supported form fields, which automatically convert into charts when added to your report. Use the search bar to quickly find and filter specific form fields for a more customized report.

Send Comment:
45 Comments:
July 26, 2026
I want you help me to create a visual report
June 23, 2026
thanks for this and the great app! Is it possible to generate a report based on each form submission that is then automatically sent to the submitting individual ?
June 14, 2026
Waiting for rep0rt to see if u have my phone number s
May 13, 2026
جميل
May 9, 2026
J'ai envoyé ma candidature pourtant on m'a pas fait de réponse
May 8, 2026
help me
April 25, 2026
How do you insert the date/time of this report on at least the first page?
February 12, 2026
Grafice designer great job
October 31, 2025
Is it possible to download the report as a PPT
October 7, 2025
Sennd me the report on jotfom
September 25, 2025
I used mobile phone in doing froms form jotform that's why I can't do that manually so I want to transfer the form to the Google form and the jotform has 10 submission limit and you should upgrade to pro if you don't want limit and I don't have money to upgrade the jotform
June 27, 2025
No me dejó hacer en diagramas de barras
March 26, 2025
The people who enter the contest. How can they share their entry and get people to vote for their pet?
February 7, 2025
Haven’t heard anything from the Venue we like to be part of this year for Schusters Farm Fall Fest!
I fill up the form with all the options and info need it and submitted and now I been waiting for response but nothing!
October 28, 2024
Sorry. I just don't get it.
July 22, 2024
Thank you very much !
March 12, 2024
I submitted my application 3 weeks ago until now i have no response
November 18, 2023
Maintenant il faut faire un compte avec vous plaît monsieur
October 31, 2023
I had sent my document 3weeks ago,but still have no any response
October 22, 2023
C'est meilleur
October 3, 2023
We were submited our application form but we don't get any message. Please send email please.
September 11, 2023
I cannot see a signed report I sent for signature. This is an urgent situation, please help ASAP
September 4, 2023
Unafanyaje huu kilipu
July 19, 2023
Cancel canpaingn I had
On your website please
Thank you!!
July 19, 2023
Make a video on it. Rgds Ra