-
 abna1919
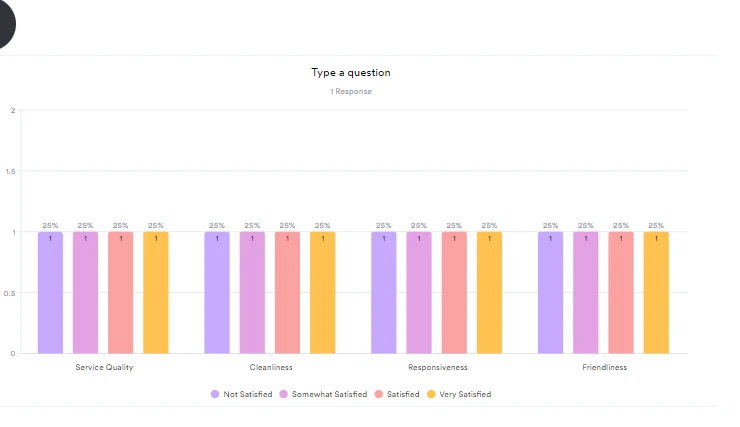
There is a problem with the graphs in the following table, it does not read the data inside the table well and only reads the amount of input

-
 Jotform Support Former Jotform Support
Greetings,
Thank you for contacting Jotform Support.
Please allow me some time to look further into your form and will get back to you with the update.
Thank you for your patience.
-
Jotform Support Former Jotform Support
Greetings,
Unfortunately the visual report can only count the responses made to the Input Table in the term of filled or empty inputs only across all the submitted entries and doesn't render calculations or insights for the values inside the Input Table, accordingly I've raised a request to our developers team to consider this point if possible, although we can't provide any estimates for when this option would be implemented but you will be notified through this ticket once we have an update.
-
abna1919
Thank you..what distinguishes you is the speed of response and the continuous pursuit of development
-
abna1919
We are still waiting
-
Jotform Support Former Jotform Support
Hello ,
Thanks for following up with us. We have not heard from our backend team as of yet. While there's no ETA, rest assured that they are aware of the request. If there's any update you'll be notified.