


-
3ddrueenGefragt am 20. Juli 2021 um 11:46
Ich habe seit heute ein Problem wenn ich mein erstelltes Formular aufrufe.
Link Formular: https://form.jotform.com/210975320315045
Ich hoffe Sie können mir weiter helfen, Gruß Mirco Drüen.
Leider wird mir nicht mein Formular angezeigt sondern dies hier:
<--- Last few GCs ---> [20923:0x3782740] 565 ms: Scavenge 3.6 (7.3) -> 3.5 (8.3) MB, 1.4 / 0.0 ms allocation failure [20923:0x3782740] 4265 ms: Scavenge 6.0 (9.9) -> 6.2 (12.4) MB, 406.4 / 0.8 ms allocation failure <--- JS stacktrace ---> Cannot get stack trace in GC. FATAL ERROR: NewSpace::Rebalance Allocation failed - process out of memory 1: node::Abort() [/bin/node8] 2: 0x11e7fec [/bin/node8] 3: v8::Utils::ReportOOMFailure(char const*, bool) [/bin/node8] 4: v8::internal::V8::FatalProcessOutOfMemory(char const*, bool) [/bin/node8] 5: 0xad2f0b [/bin/node8] 6: v8::internal::MarkCompactCollector::Evacuate() [/bin/node8] 7: v8::internal::MarkCompactCollector::CollectGarbage() [/bin/node8] 8: v8::internal::Heap::MarkCompact() [/bin/node8] 9: v8::internal::Heap::PerformGarbageCollection(v8::internal::GarbageCollector, v8::GCCallbackFlags) [/bin/node8] 10: v8::internal::Heap::CollectGarbage(v8::internal::AllocationSpace, v8::internal::GarbageCollectionReason, v8::GCCallbackFlags) [/bin/node8] 11: v8::internal::Factory::NewFeedbackVector(v8::internal::Handle, v8::internal::PretenureFlag) [/bin/node8] 12: v8::internal::FeedbackVector::New(v8::internal::Isolate*, v8::internal::Handle) [/bin/node8] 13: v8::internal::JSFunction::EnsureLiterals(v8::internal::Handle) [/bin/node8] 14: v8::internal::Compiler::PostInstantiation(v8::internal::Handle, v8::internal::PretenureFlag) [/bin/node8] 15: v8::internal::Factory::NewFunctionFromSharedFunctionInfo(v8::internal::Handle, v8::internal::Handle, v8::internal::PretenureFlag) [/bin/node8] 16: v8::internal::Compiler::GetFunctionFromEval(v8::internal::Handle, v8::internal::Handle, v8::internal::Handle, v8::internal::LanguageMode, v8::internal::ParseRestriction, int, int, int, int, int, v8::internal::Handle, v8::ScriptOriginOptions) [/bin/node8] 17: 0x107f205 [/bin/node8] 18: v8::internal::Runtime_ResolvePossiblyDirectEval(int, v8::internal::Object**, v8::internal::Isolate*) [/bin/node8] 19: 0x215b34623918 timeout: the monitored command dumped core Aborted
-
Jessica Jotform SupportGeantwortet am 20. Juli 2021 um 21:39
Hi 3ddrueen, thank you for reaching us.
This normally happened due to form cache. I have clear your form cache from our end. Should a similar issue happened, you can take the following action to solve it next time:
1. Hover your mouse to the User Profile / Account menu at the top right side of the navigation.
2. Click the Settings option.
3. Scroll down, and click the Clear Cache button under the Form Caches row.
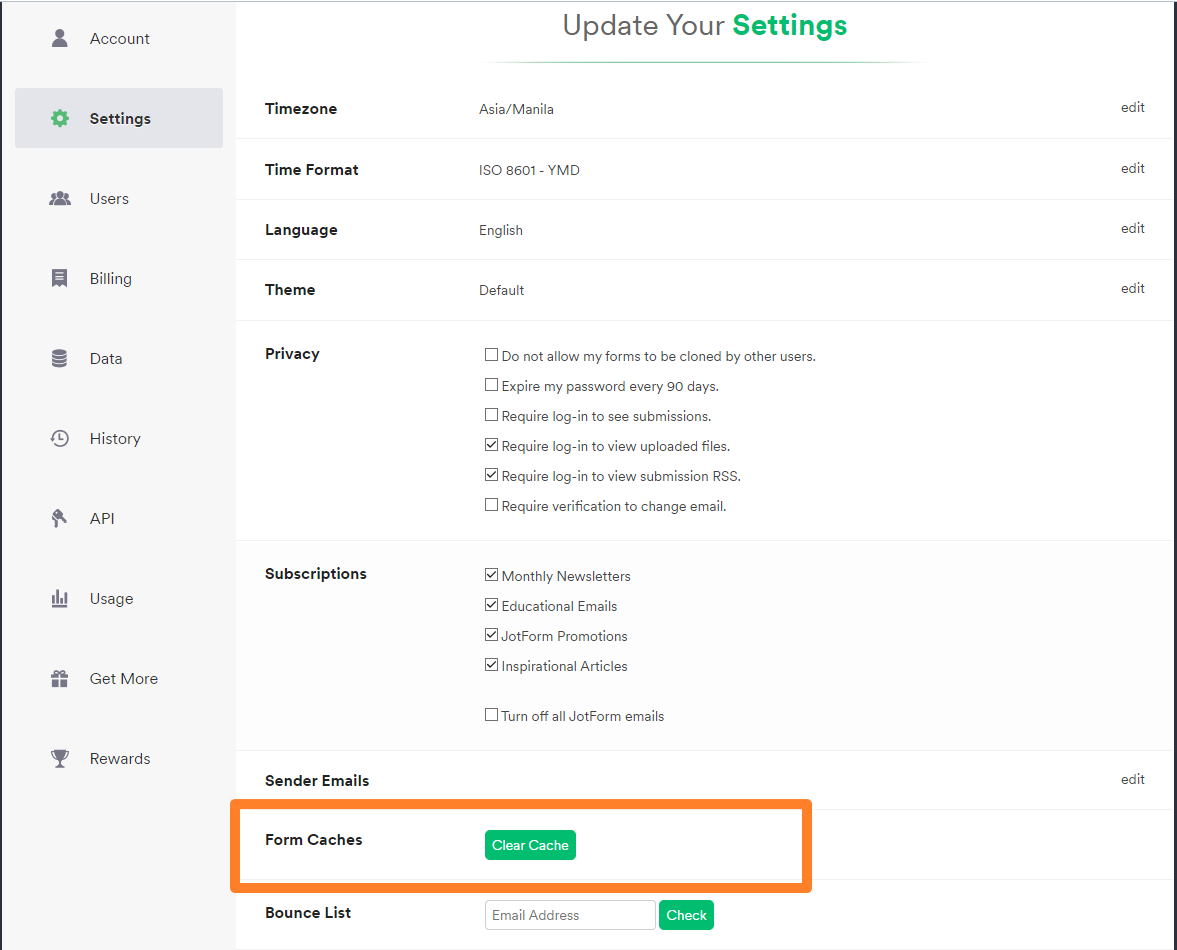
And a pop-up will appear saying All Caches are Cleared.
- Vorlagen
- Integrationen
- INTEGRATIONEN
- 100+ Integrationen ansehen
- BELIEBTE INTEGRATIONEN
 PayPal
- Slack
- Google Tabellen
- Mailchimp
- Zoom
- Dropbox
- Google Kalender
- HubSpot
- Salesforce
- Mehr anzeigen Integrations
- Produkte
- PRODUKTE
- Formulargenerator
- Jotform Enterprise
- Jotform Apps
- Shop-Generator
- Jotform Tabellen
- Jotform Posteingang
- Jotform Mobile App
- Jotform Approvals
- Berichtgenerator
- Smart PDF Formulare
- PDF Editor
- Jotform Signatur
- Jotform für Salesforce Jetzt entdecken
- Support

