DEDICATED SUPPORT
Get a dedicated support team with Jotform Enterprise.
Analytics
多彩な分析ツールで、フォームデータから貴重な洞察を得ましょう。トラフィックの分析、フォーム回答の改善、ユーザー行動の測定、ビジュアルレポートの作成、Google Analyticsや、その他のサードパーティ製ウィジェットへの接続など、さまざまなことが可能です。
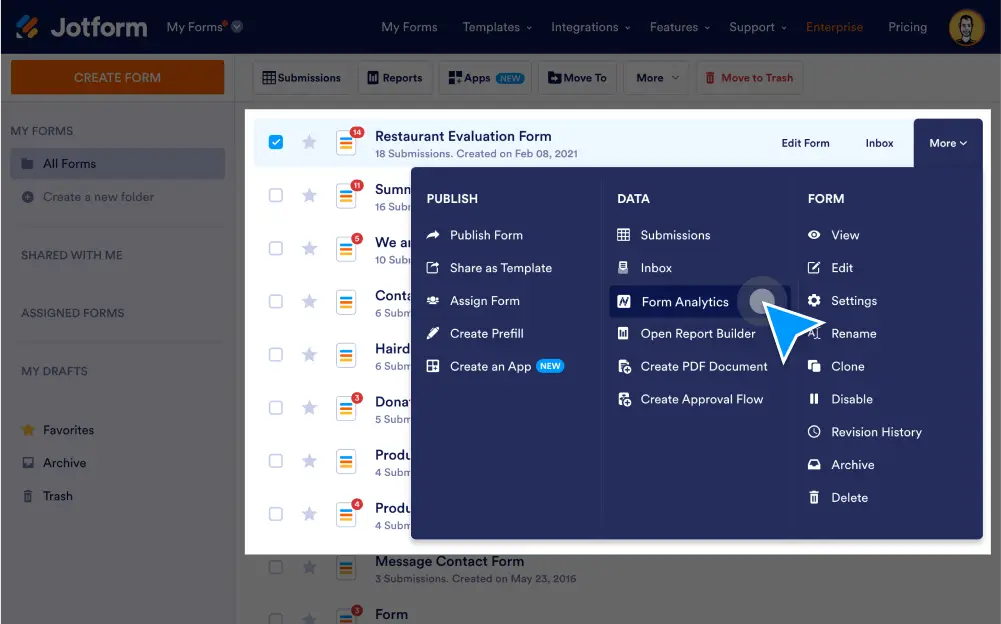
フォーム分析でフォームデータを最大限に活用しましょう。Jotformの内蔵ツールを使用するか、Googleアナリティクスなどのサードパーティアプリと接続しましょう。アンケート、アンケート、フォームの回答をより深く理解することができます。
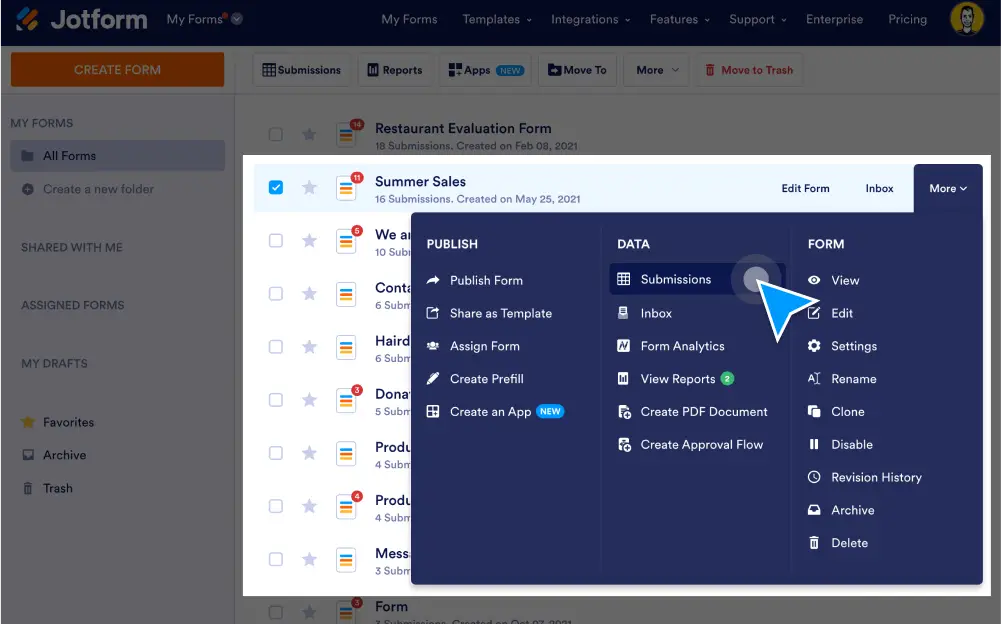
Jotformを使ってフォームデータを収集、管理、共有しましょう。Jotformの無料データ管理ツールを使えば、レポートやPDFを作成したり、フォーム送信をオンラインで安全に共有したりすることができます。
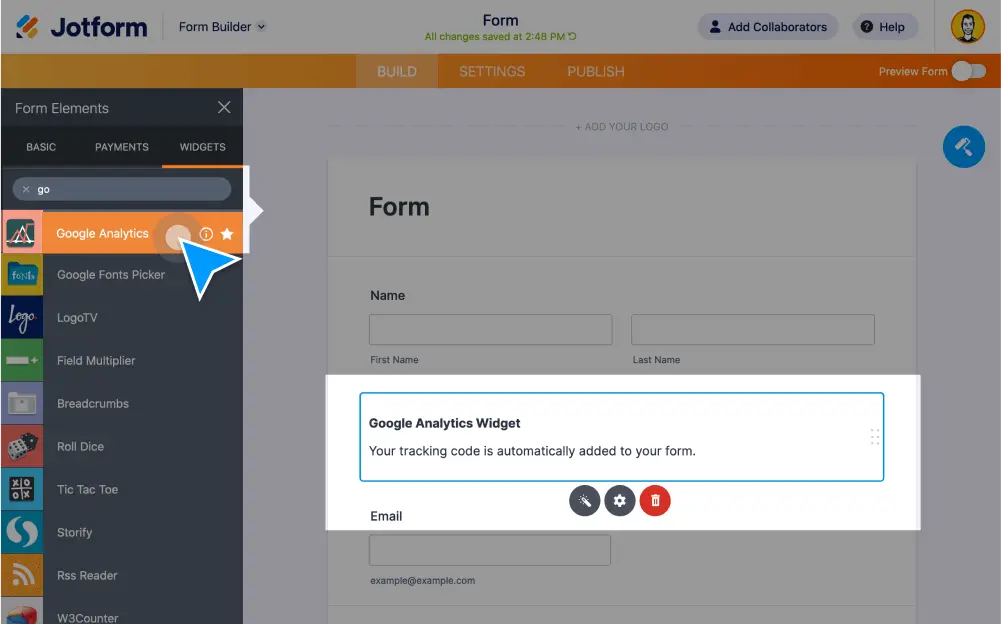
Jotformのフォームを、Google Tag ManagerやGoogle Analyticsと連携させることで、より効果的なデータ分析が可能になります。送信、フォームフィールド、サンキューページなどの分析を見ることができます。コンバージョン率を向上させ、より良いビジネス決定を下しましょう。
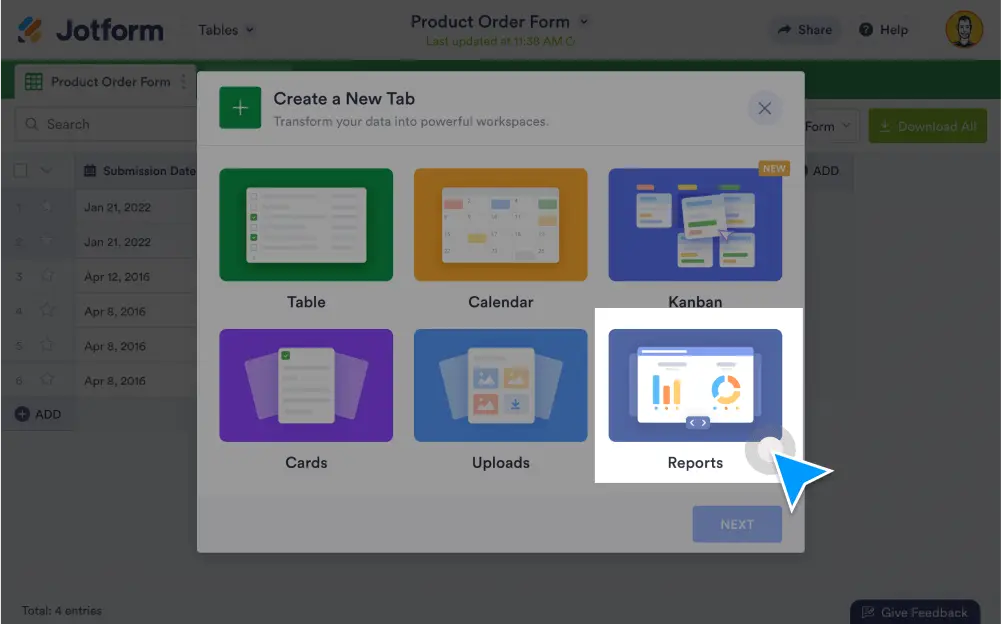
Jotformレポートビルダーを使えば、フォーム送信をビジュアルレポートに変換できます。棒グラフ、円グラフ、送信グリッドを自動的に生成します。フォームデータを分析して、より良い意思決定を行いましょう。
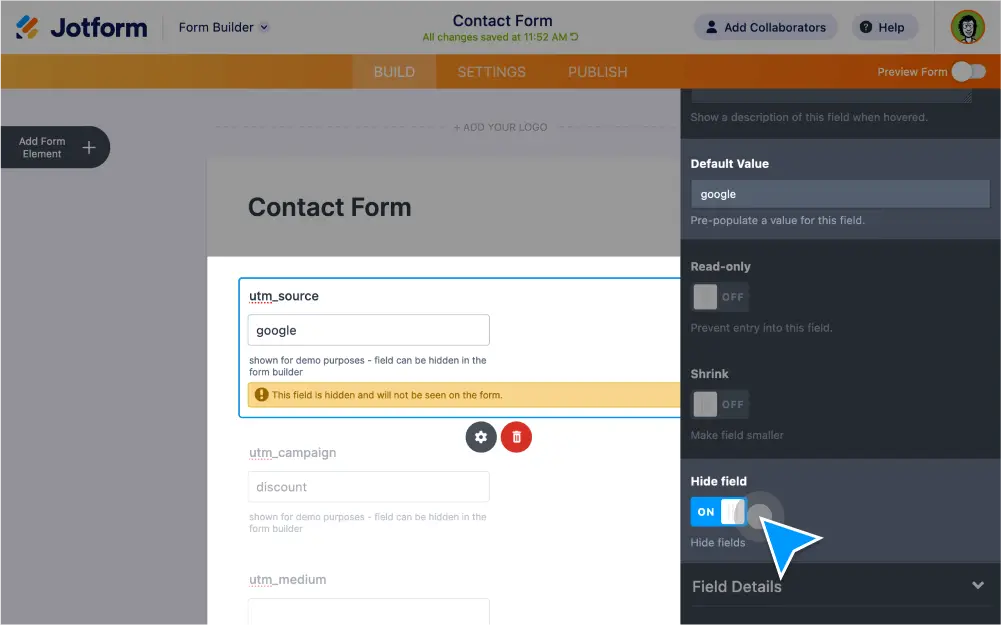
オンラインフォームのUTMトラッキングパラメータを設定します。フォームのトラフィックデータを追跡・分析し、キャンペーンをより最適化します。今すぐ無料で始めましょう!
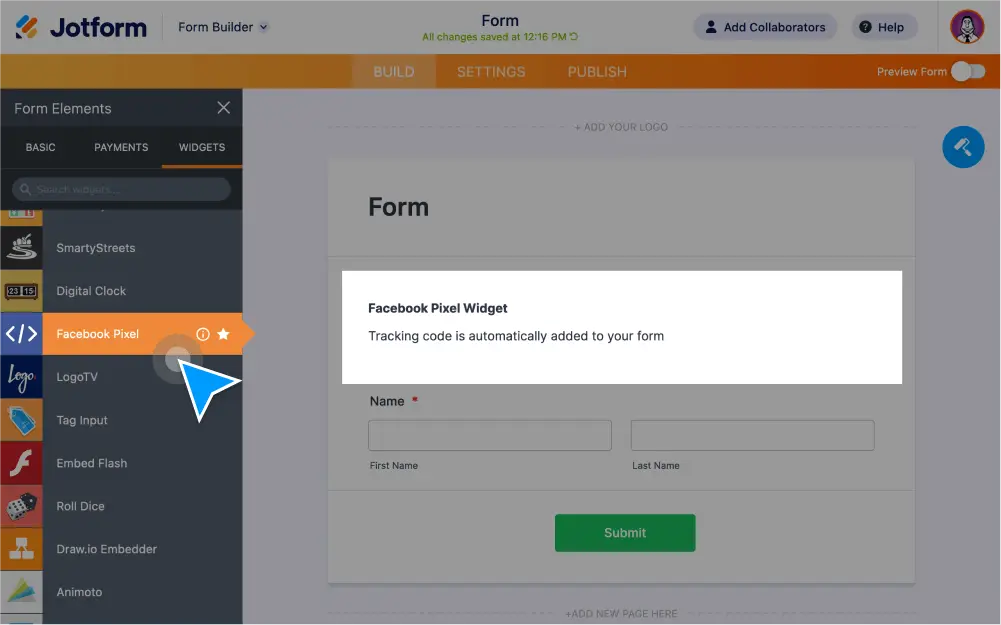
Facebookピクセルでフォーム送信を追跡し、Facebookキャンペーンを最適化します。