Form Insights Audience tab shows the users visiting and interacting with your form, including view and submission counts, device types, browsers, operating systems, and their country of residence, and how they found your form.
Accessing Form Audience Metrics:
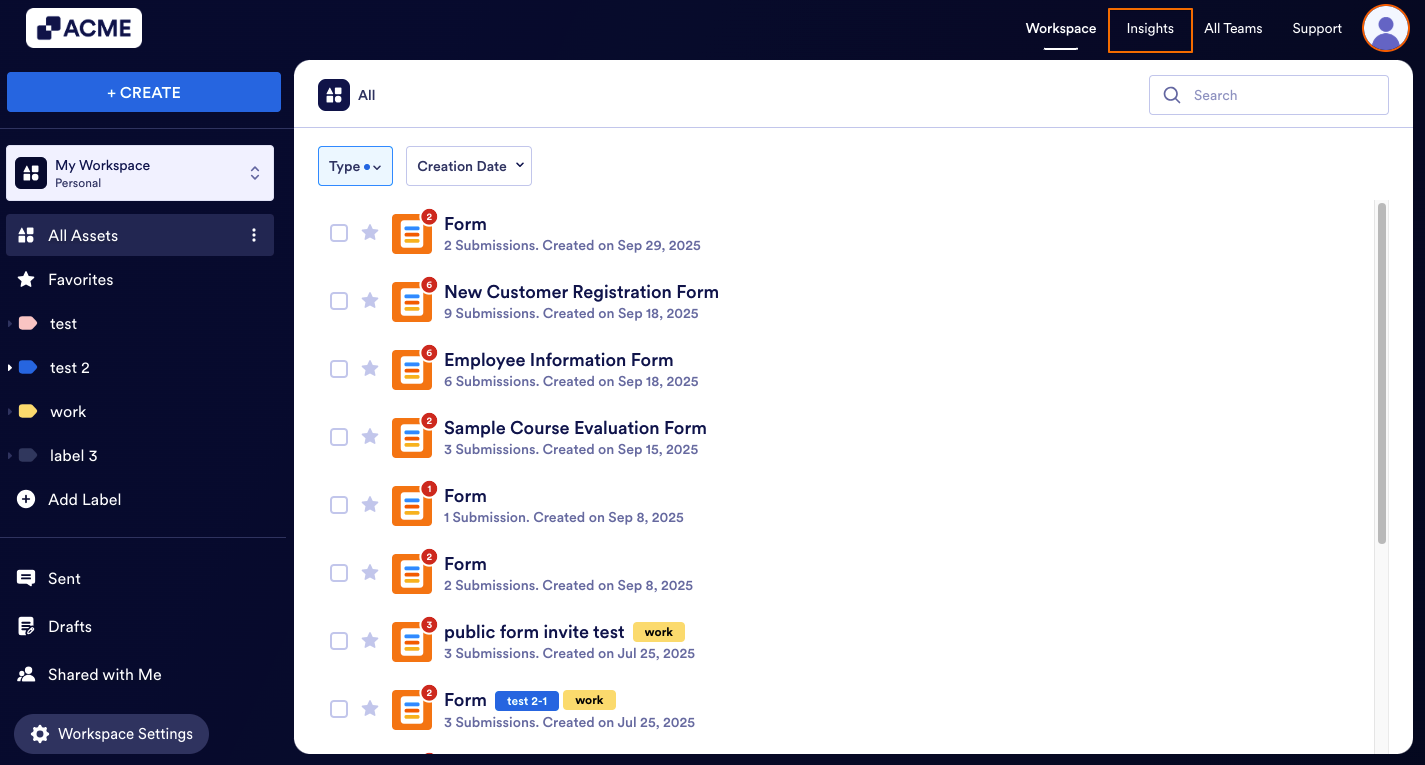
- In My Workspace, click on Insights in the upper right-hand corner of the page.
- Next, click on Forms from the menu on the left.
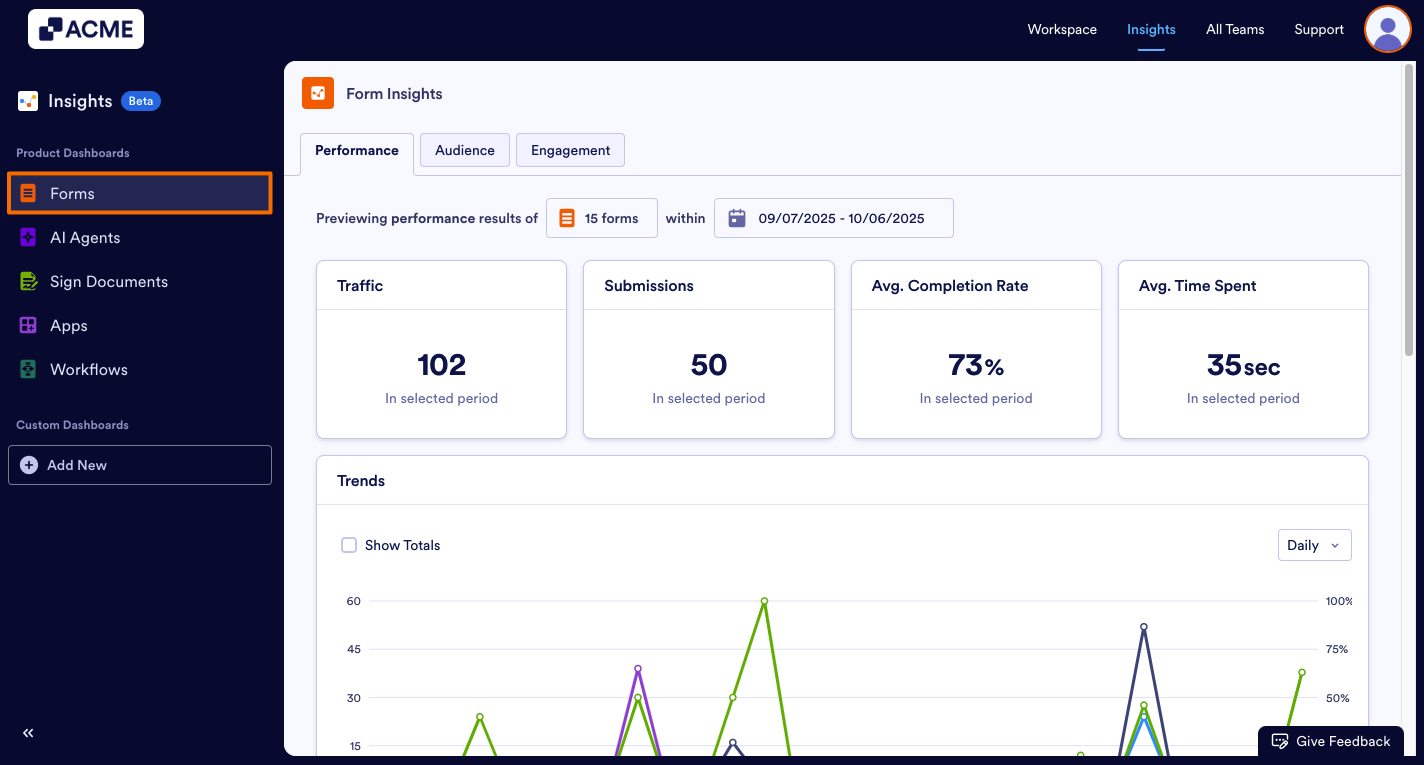
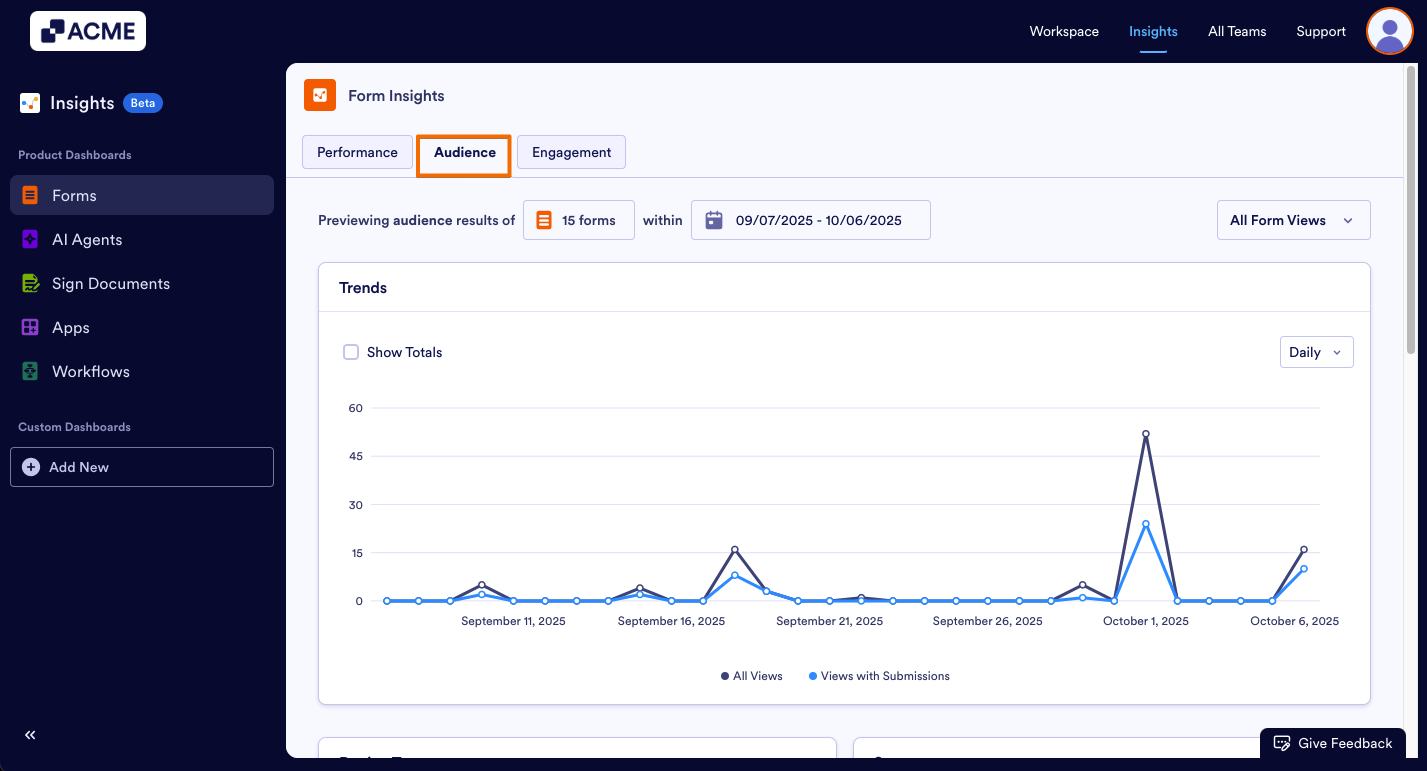
- Under Form Insights, click on the Audience tab.
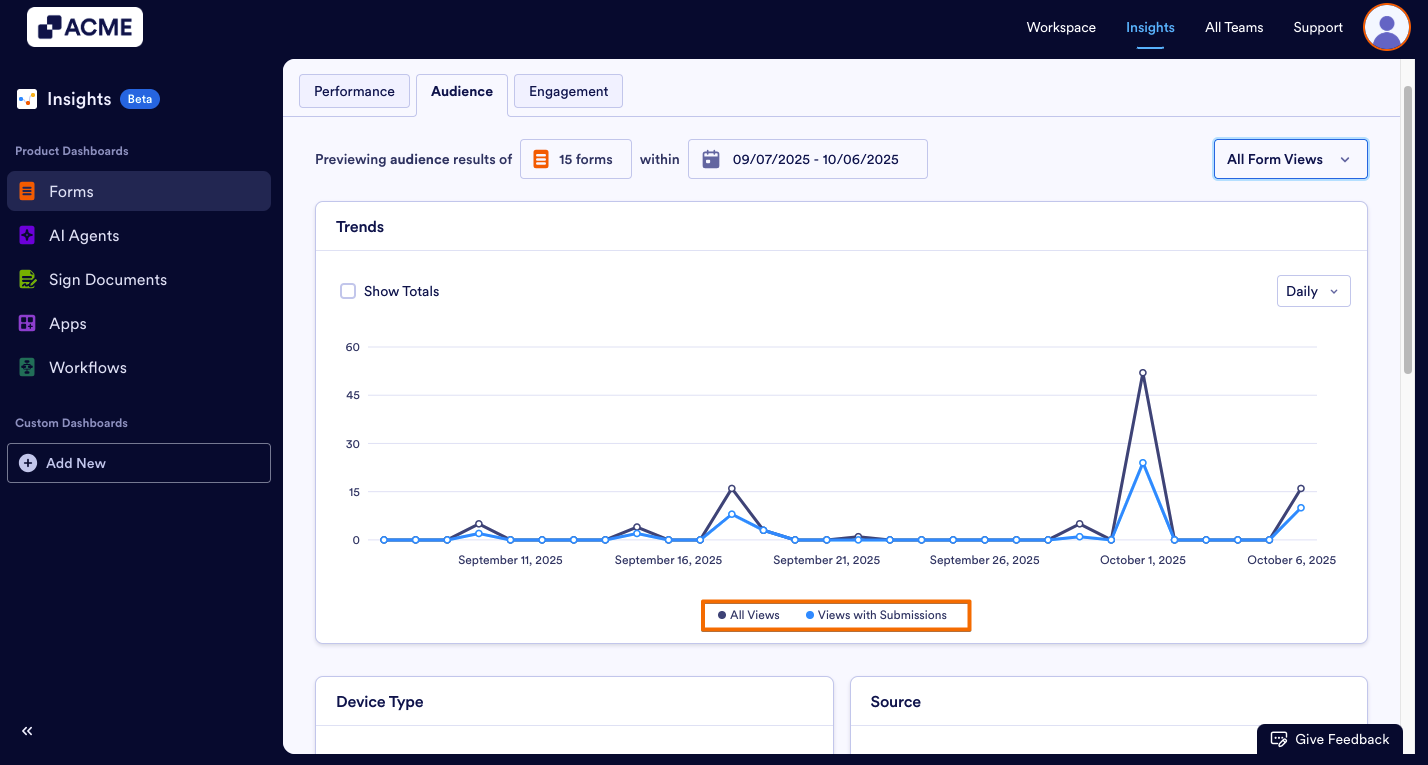
- Then, click on the drop-down menu in the upper right-hand side of the page and select either All Views or Views with Submissions.
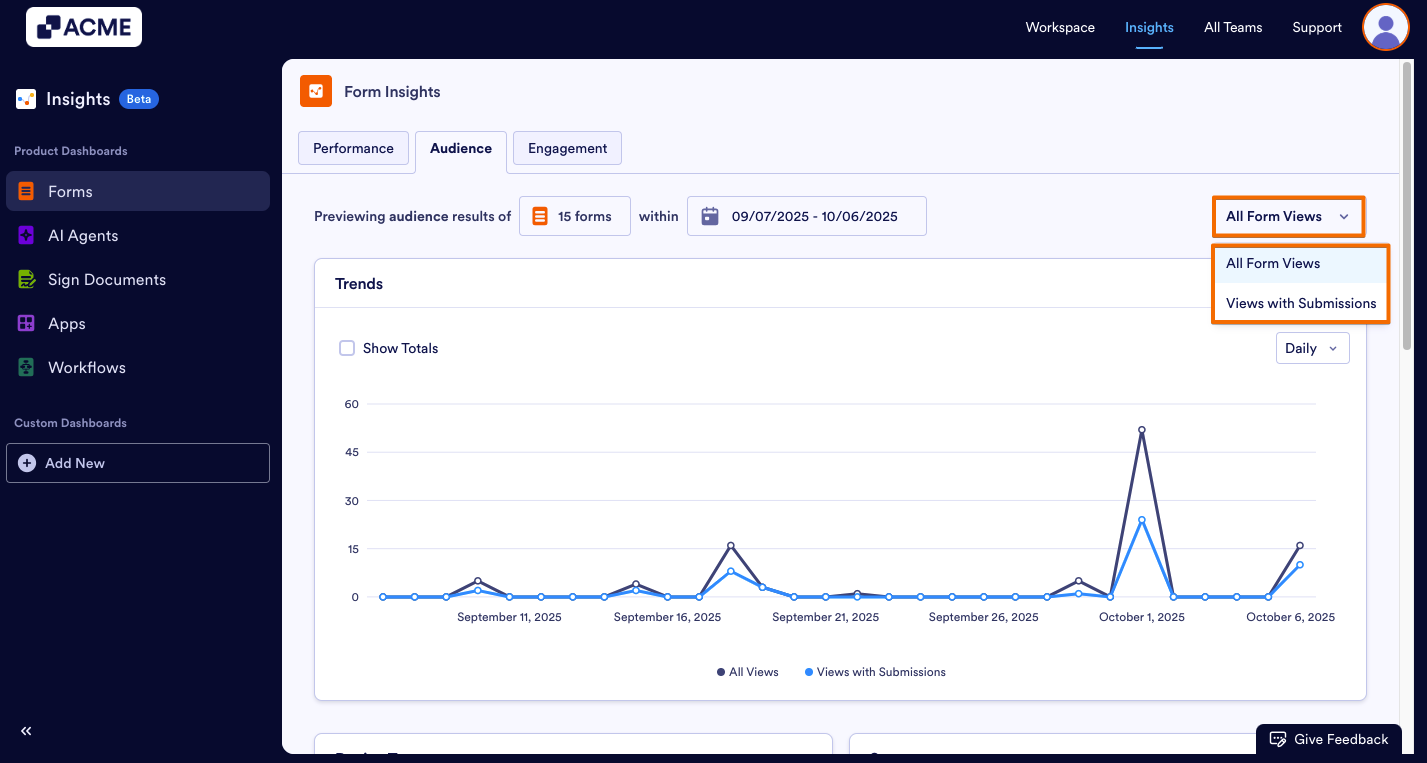
After you select an option from the dropdown menu, all metric cards and the breakdown list will display the numbers related to that selection (all views or views with submission numbers) expect the Trends chart. In the Trends chart, you can display both all views and views with submission with different lines.
Note: You can filter the forms you want to analyze and also select a date range to view specific data. When you set a filter for any tab in Form Insights, it applies to all tabs, including Performance and Engagement. This makes it easy to see different metrics for the same data set.
What metrics Do We Provide?
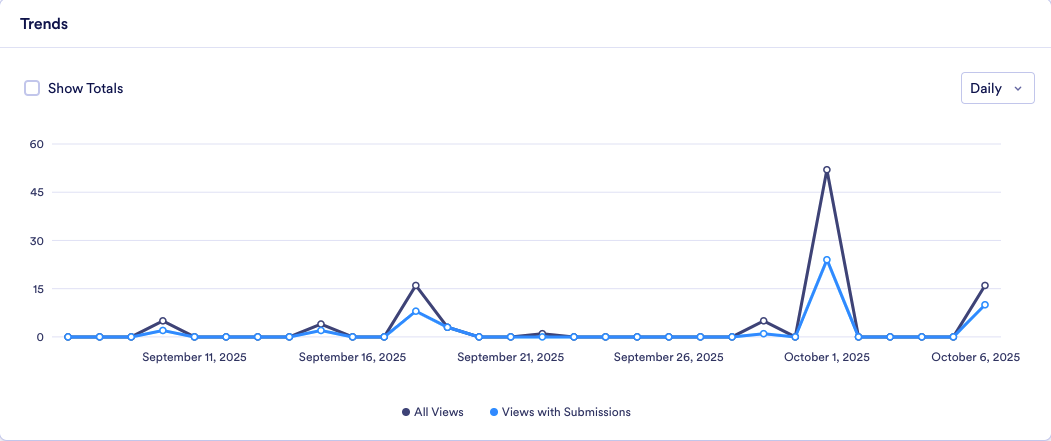
Trends
We provide Trends that displays Audience related numbers such as All Views and Views with Submissions throughout the selected time period.
- All Views include form views with or without submission.
- Views with Submissions shows the number of the form views that have ended up with a viewer submitting the form.
You can change the visibility of the data in the line chart. Let’s move on to the steps together:
- Add/Remove Metrics: Click on the metric name at the bottom of the chart to add or remove it from the chart.
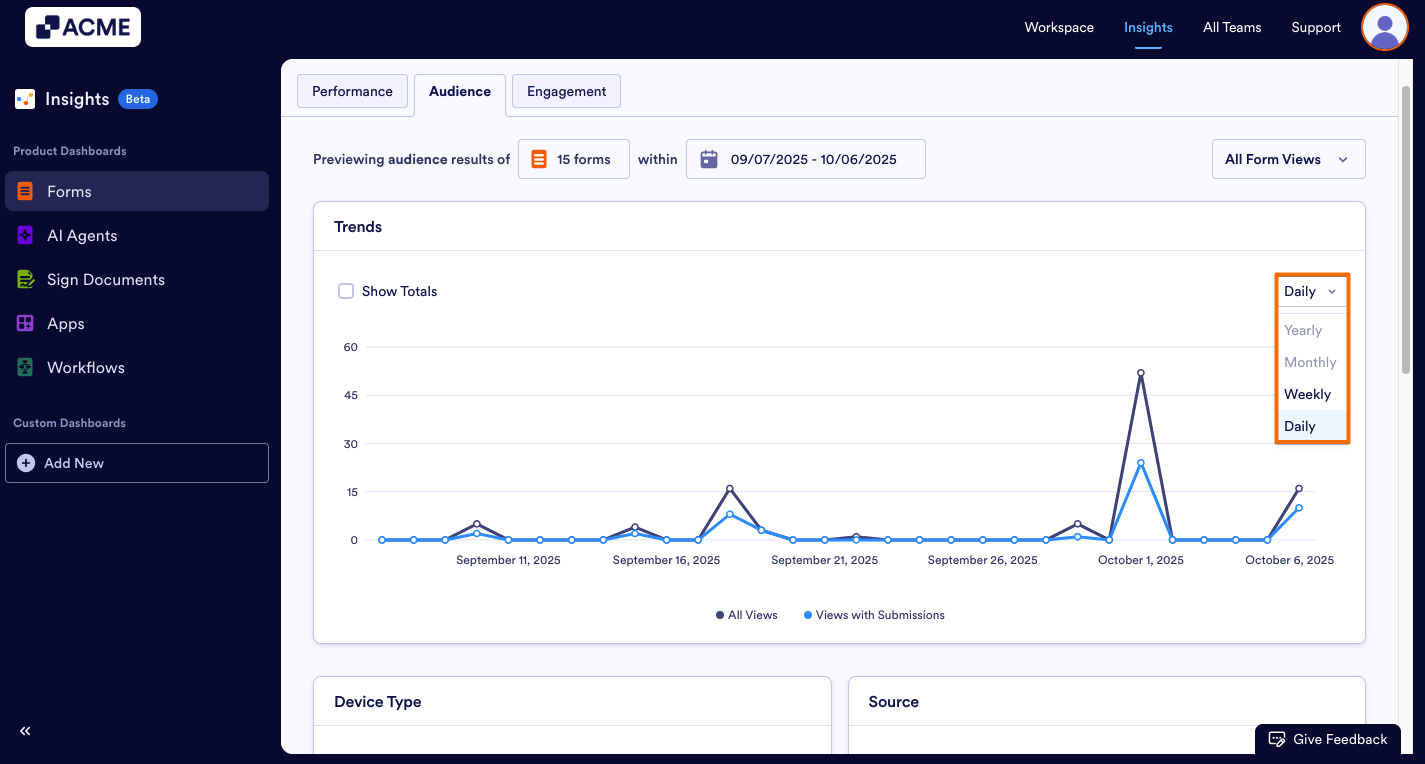
- Changing the Time Interval: Click on the drop-down menu at the top of the chart and select daily, weekly, monthly, or yearly.
- Depending on the date range you’ve selected, some options might not be available. For example, if your date range for the tab is set to last seven days, you won’t be able to select monthly or yearly.
Other Cards:
Under the trends chart, other valuable insights are displayed in card format, and the information will change based on the dropdown selection between All Views and Views with Submissions.
When All Views Selected:

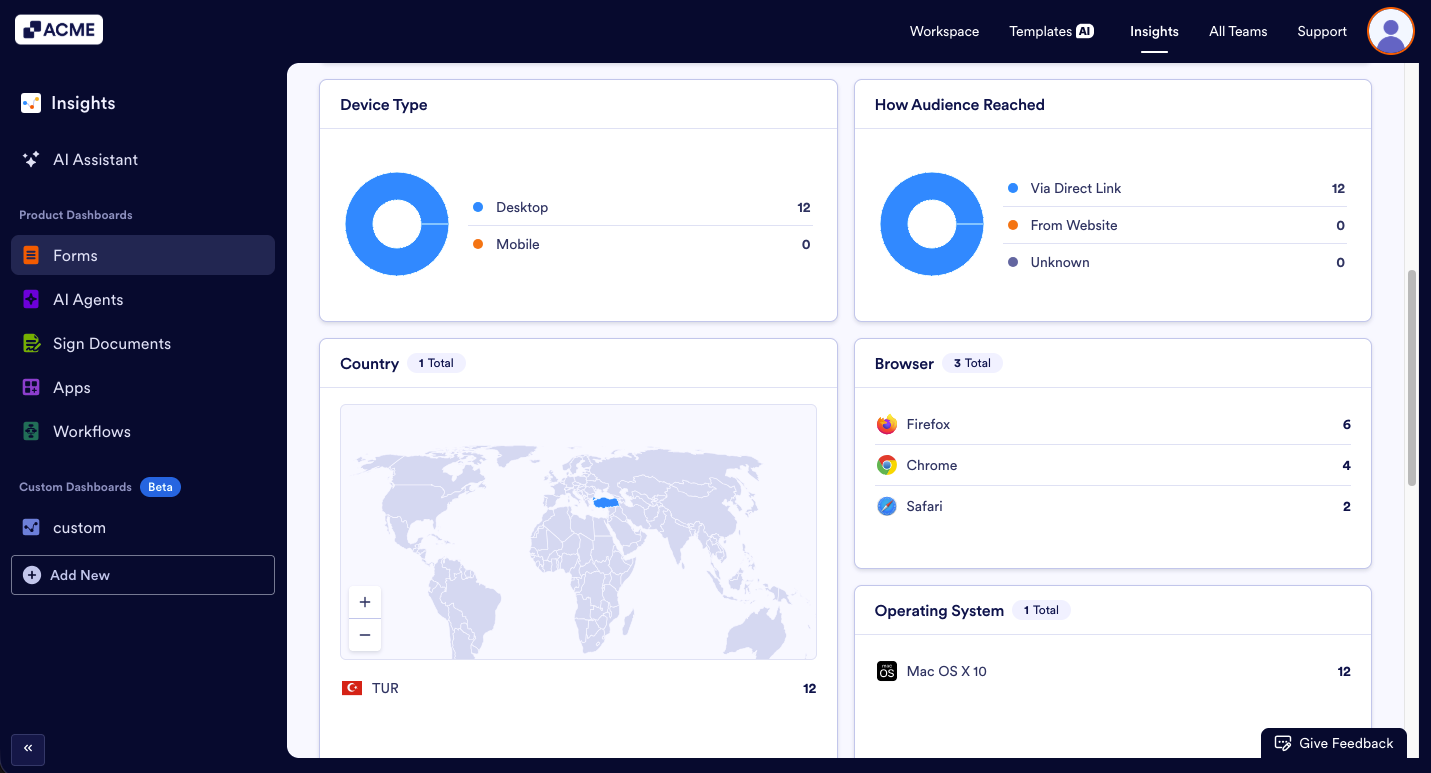
- Device Type: This donut chart shows the distribution of All Views numbers, divided between desktop and mobile users.
- How Audience Reached: This donut chart shows the distribution of All Views numbersdivided between sources (Direct vs. External). Direct is via the form link, External is via the form embedded elsewhere.
- Country: This card shows the distribution of All Views numbers divided between countries in a map and country list format.
- Browser: This card shows the distribution of All Views numbers by browsers, such as Chrome, Chrome Mobile, Safari, Edge, and DuckDuckGo.
- Operating System: This card shows distribution of All Views numbers by operating system (e.g., Windows, macOS, iOS, Android) used by the form fillers.
When Views with Submissions Selected:
- Device Type: This donut chart shows the distribution of Views with Submissions numbers, divided between desktop and mobile users.
- How Audience Reached: This donut chart shows the distribution of Views with Submissions numbers divided between sources (Direct vs. External). Direct is via the form link, External is via the form embedded elsewhere.
- Country: This card shows the distribution of Views with Submissions numbers divided between countries in a map and country list format.
- Browser: This card shows the distribution of Views with Submissions numbers by browsers, such as Chrome, Chrome Mobile, Safari, Edge, and DuckDuckGo.
- Operating System: This card shows the distribution of Views with Submissions numbers by by operating system (e.g., Windows, macOS, iOS, Android) used by the form fillers.
Breakdown List:
Need an even more detailed breakdown for each view or submission? Under the Breakdown List, you can see each form submission or view, along with the specific metrics for their date range. These metrics include: View Type, Time Spent, Country, Device, Browser, Operating System, Source, along with IP Address and Submission ID.
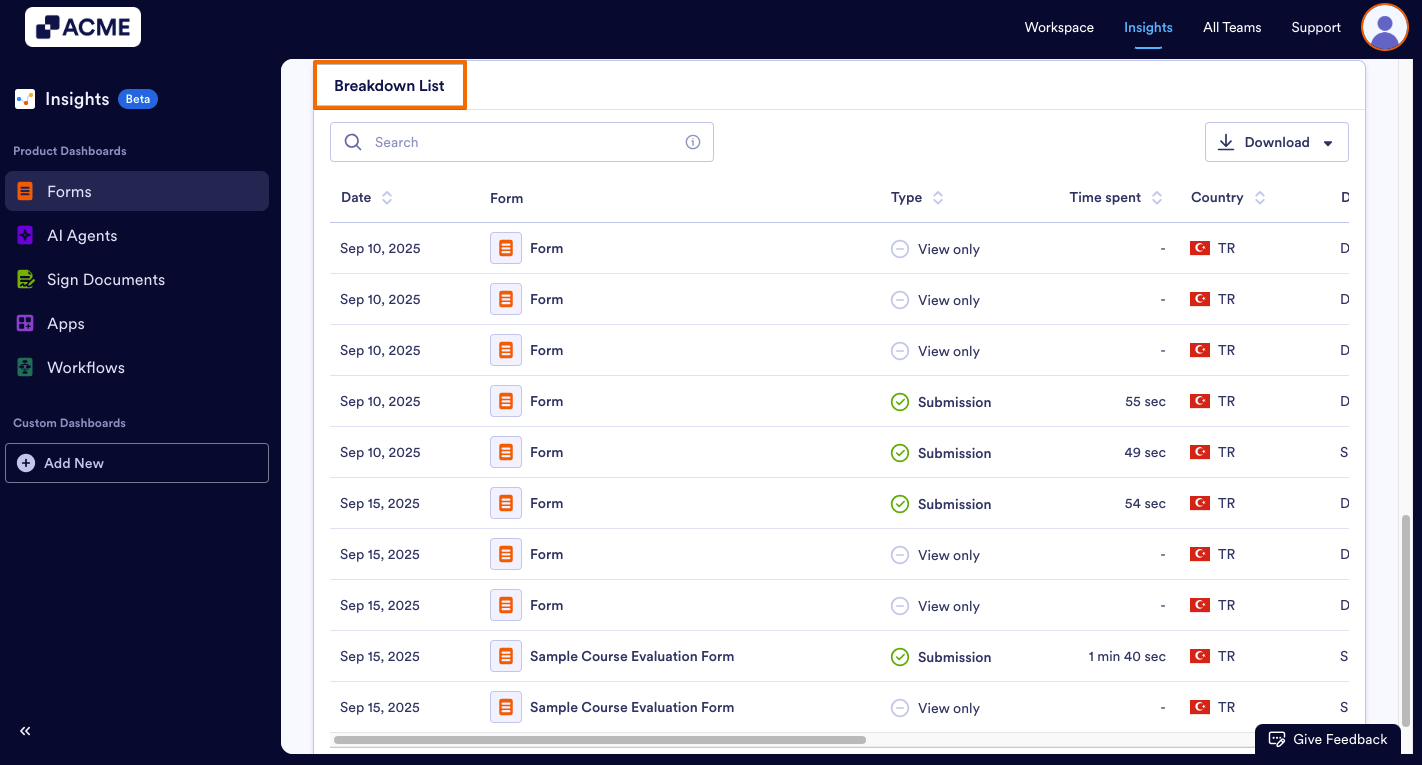
- These metrics are per submission, and are specific to the date range selected at the top of the page.
- You can download the entire list by clicking the Download button on the right and saving it as a CSV or Excel file.
- If the Views with Submissions option is selected from the dropdown at the top of the page, the Breakdown List will only display the audience interactions that have Views with Submissions.


Send Comment: