Form Insights provides various metrics within cards to analyze Form Engagement results. Engagement results are how your forms are interacting with form fillers.
There are 2 types of data that can be filtered in the engagement section: Time Spent on Forms or Completion Rate of Forms. By selecting one of them you can view results based on the metrics such as Device Type, Source, Country, Browser and Operating System.
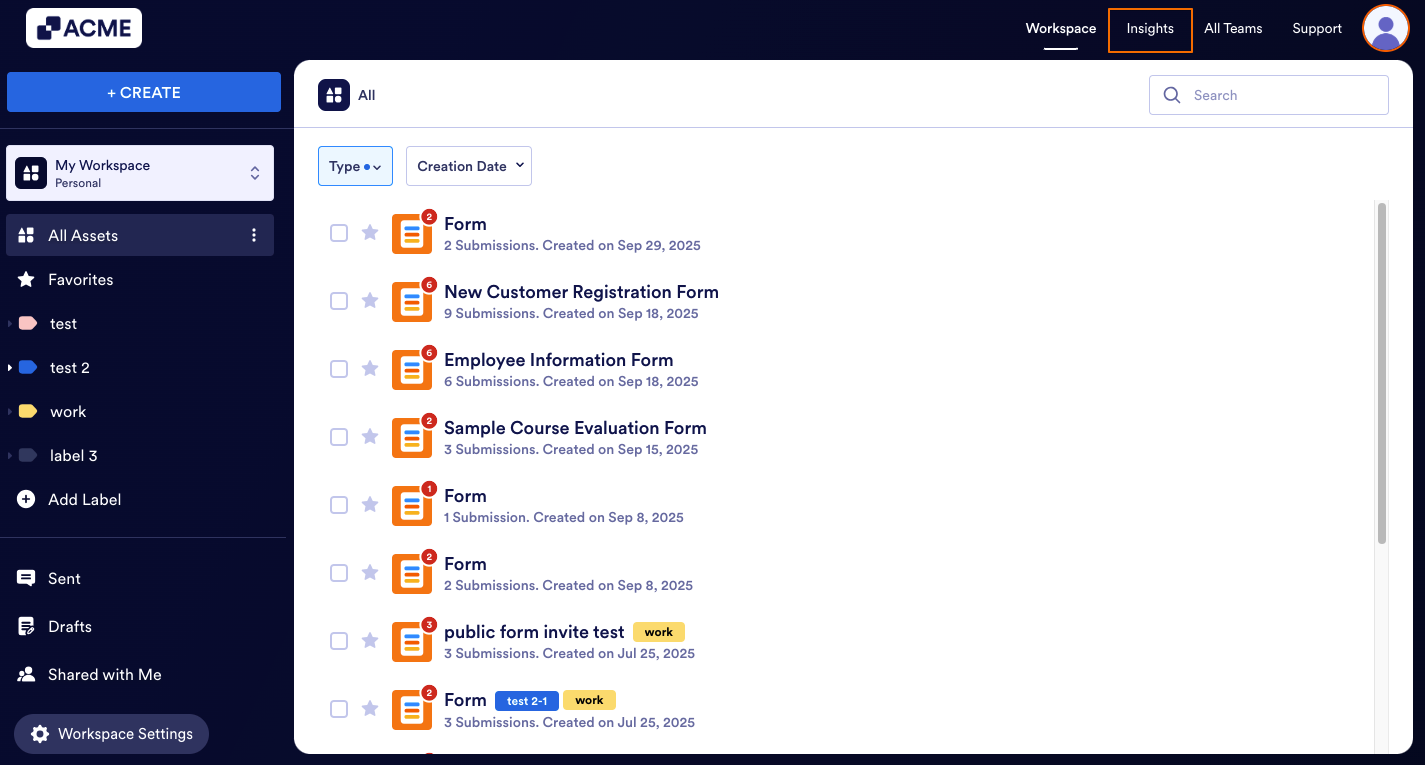
Accessing Form Engagement Metrics
- In My Workspace, click on Insights in the upper right-hand corner of the page.
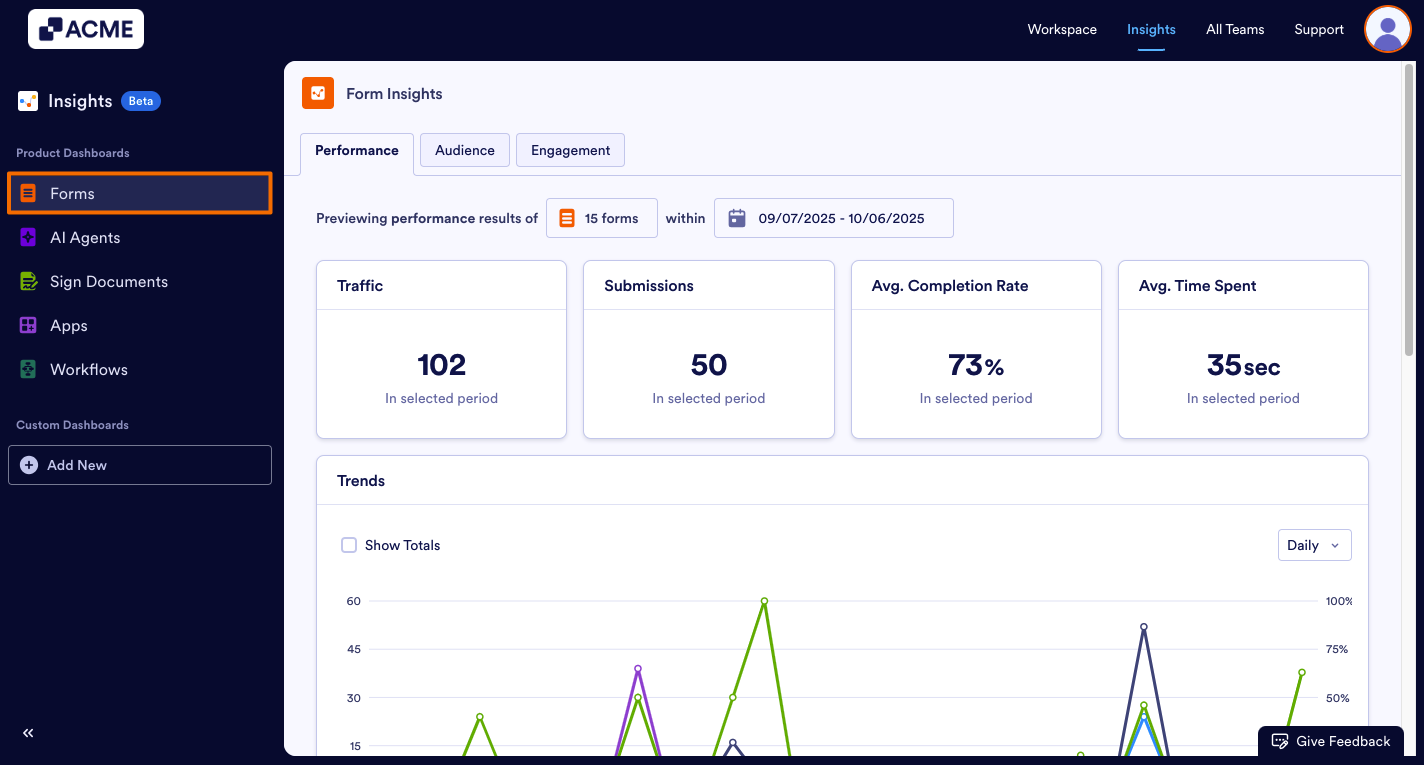
- Next, click on Forms from the menu on the left.
- Under Form Insights, click on the Engagement tab.
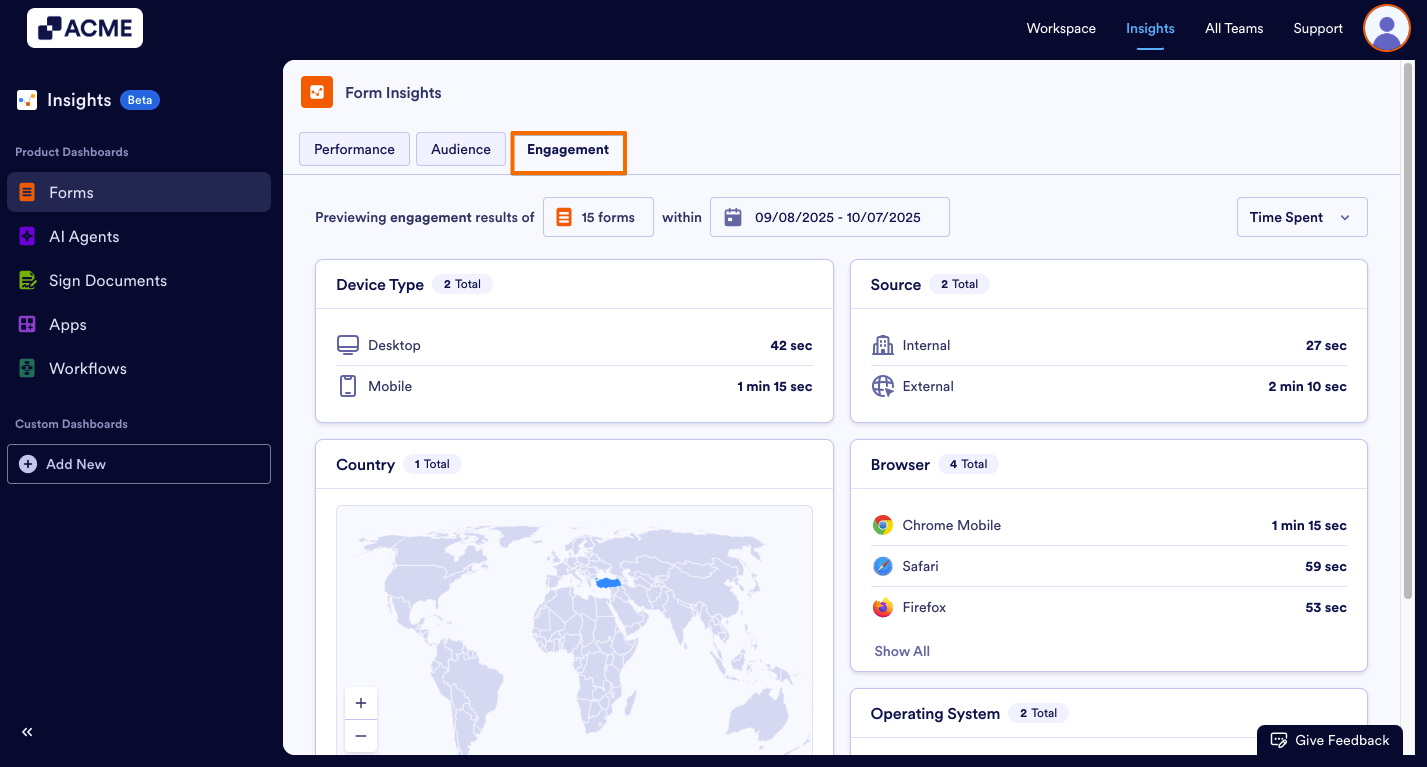
- Then, click on the drop-down menu in the upper right-hand side of the page and select either Time Spent or Completion Rate.
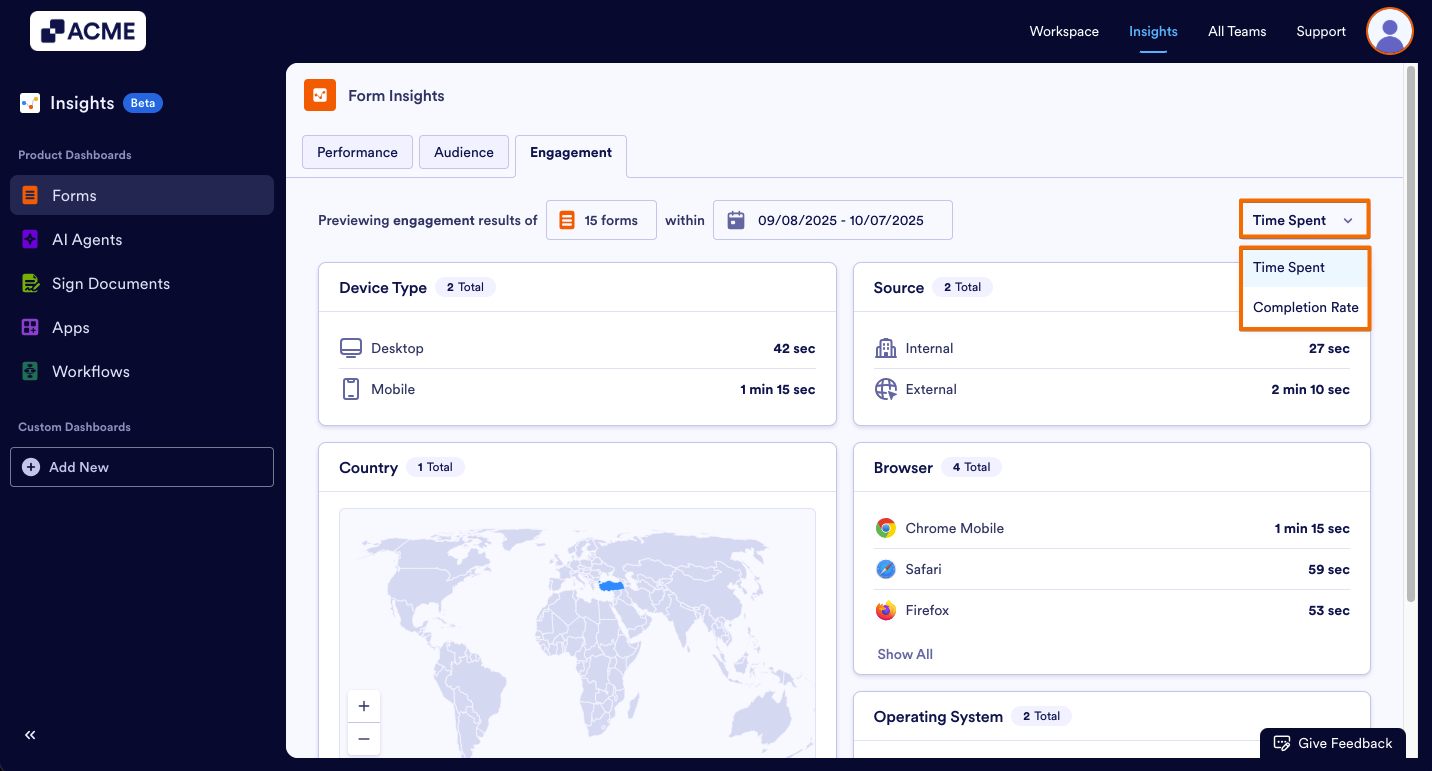
Tip: You can filter the forms you want to analyze and also select a date range to view specific data. When you set a filter with selected forms and date range, you will be able to view data with the same filter when you visit the Performance and Engagement tabs. You do not need to set a filter every time you visit other tabs inside the Form Insights.
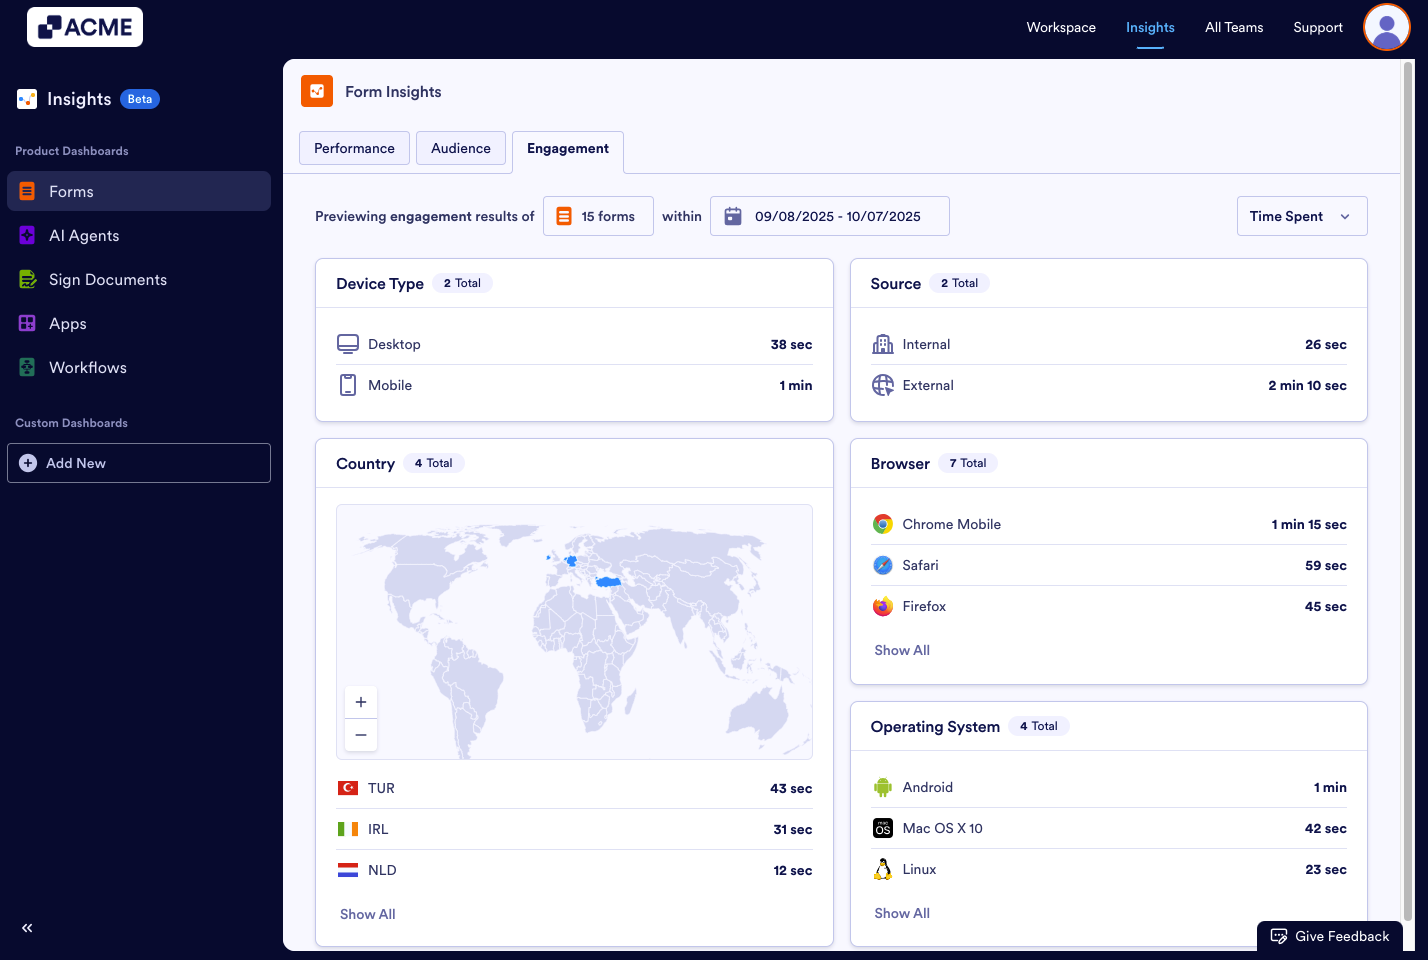
Engagement Metrics
This section provides insights on the distribution of time the form visitors spent while interacting with the forms (Time Spent), or the distribution of the percentage of the form visitors that completed the forms (Completion Rate) by metrics such as Device Type, Source, Country, Browser, Operating System.
When Time Spent is selected
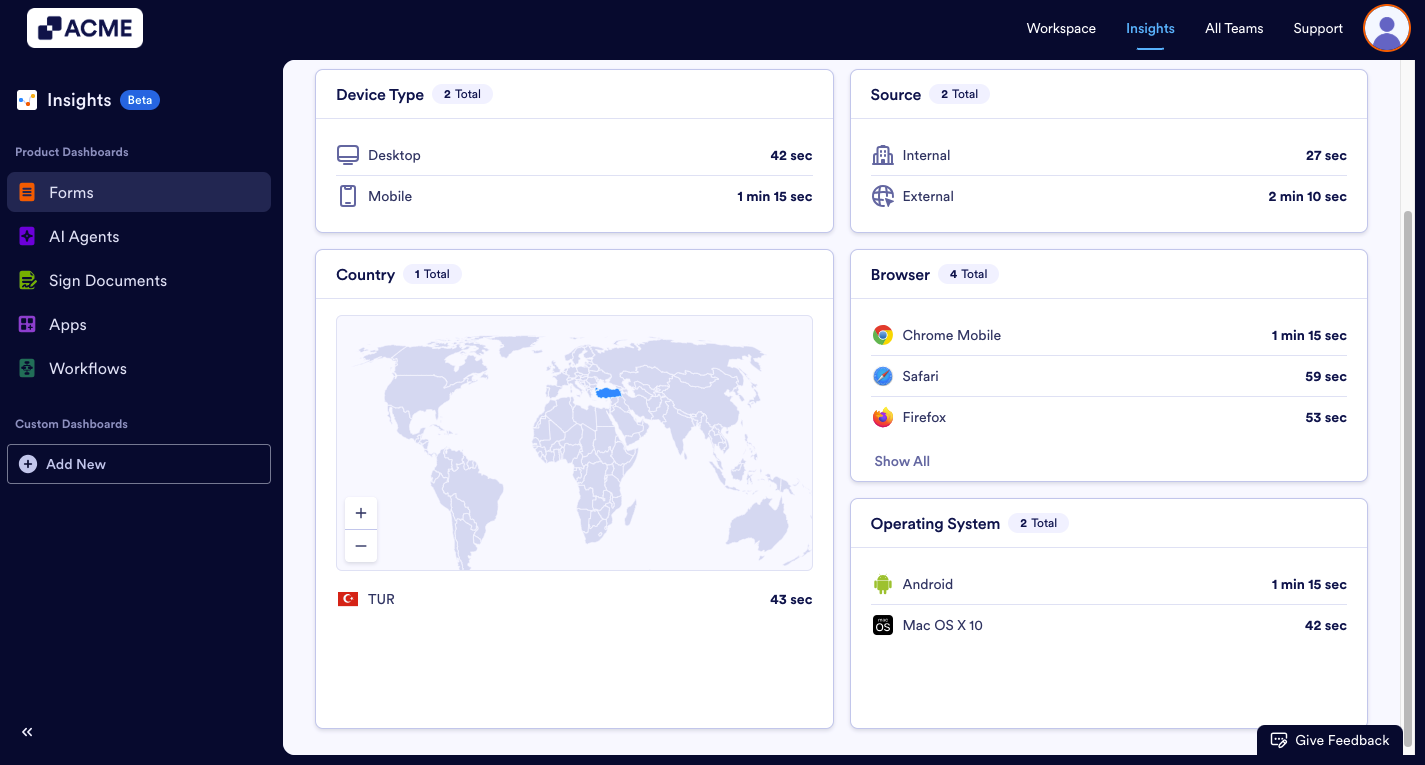
- Device Type: This donut chart shows the average time spent per submission, broken down by desktop and mobile users.
- Source: This donut chart shows the average time spent per submission by form fillers who accessed the form via direct link or embedded form.
- Country: This card shows the average time spent per submission by country, displayed in both an interactive map and a list.
- Browser: This card shows the average time spent per submission by browser, such as Chrome, Chrome Mobile, Safari, Edge, and DuckDuckGo.
- Operating System: This card shows the average time spent per submission by operating system, such as Android, macOS, iOS, etc.
When Completion Rate is Selected
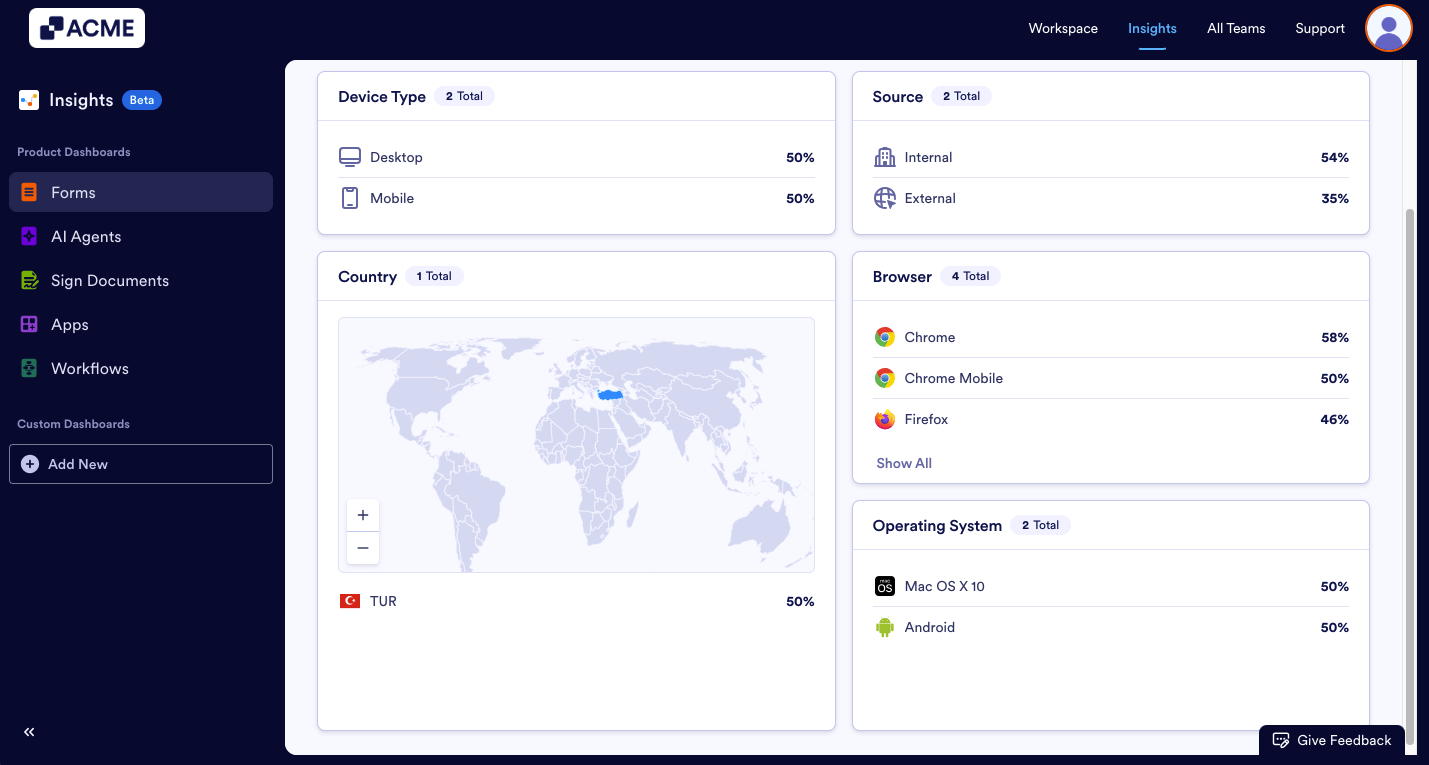
- Device Type: This donut chart shows the completion rate of form views, broken down by desktop and mobile users.
- Source: This donut chart shows the completion rate of form views by how users accessed the form (direct link or embedded).
- Country: This card shows the completion rate of form views by country, displayed in both an interactive map and a list.
- Browser: This card shows the completion rate of form views by browser, such as Chrome, Chrome Mobile, Safari, Edge, and DuckDuckGo.
- Operating System: This card shows the completion rate of form views by operating system, such as Android, macOS, iOS, etc.

Send Comment: