The Sign Insights page provides a clear view of how signees interact with your sign documents. It helps you measure engagement through the signing process and spot trends across your documents.
Accessing Sign Documents Audience Metrics
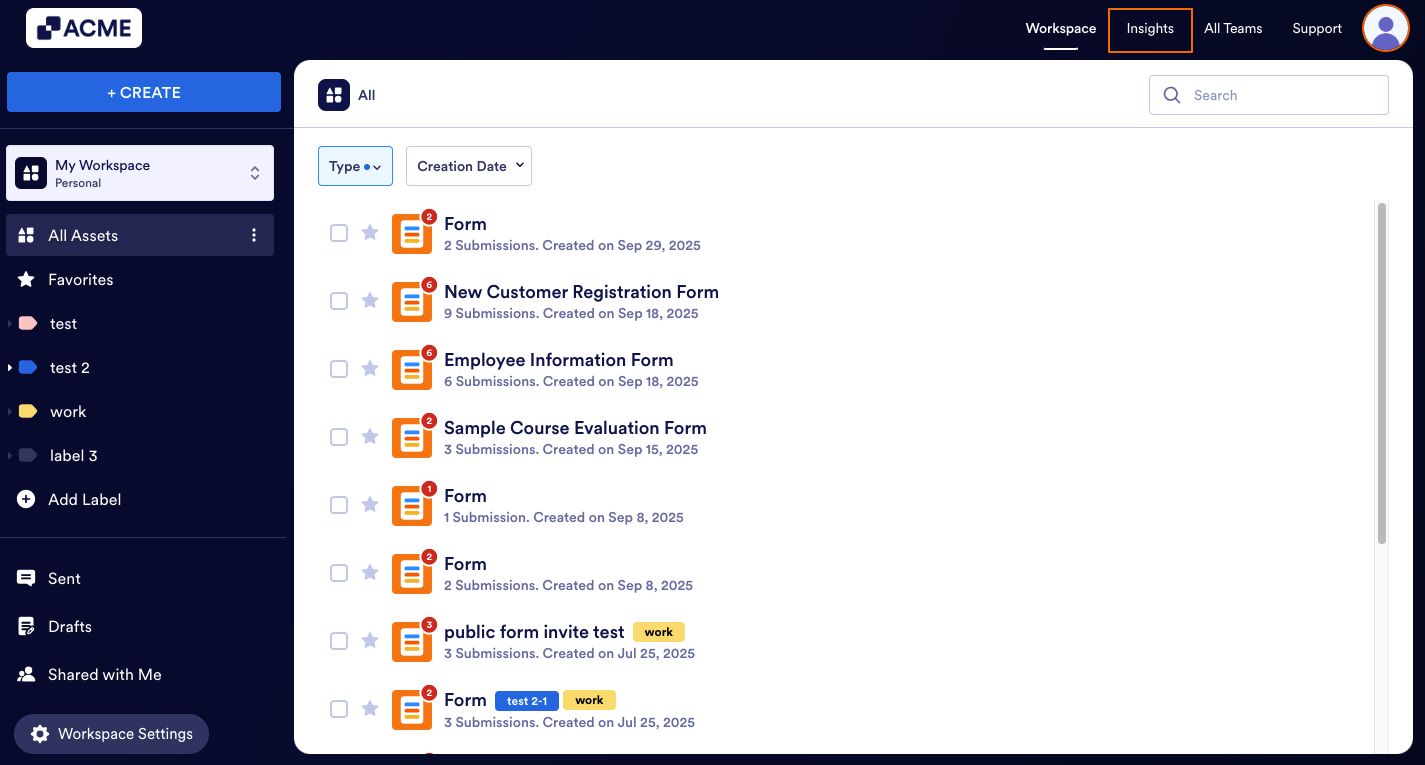
- In My Workspace page, click on Insights on the top right-hand corner of the page.
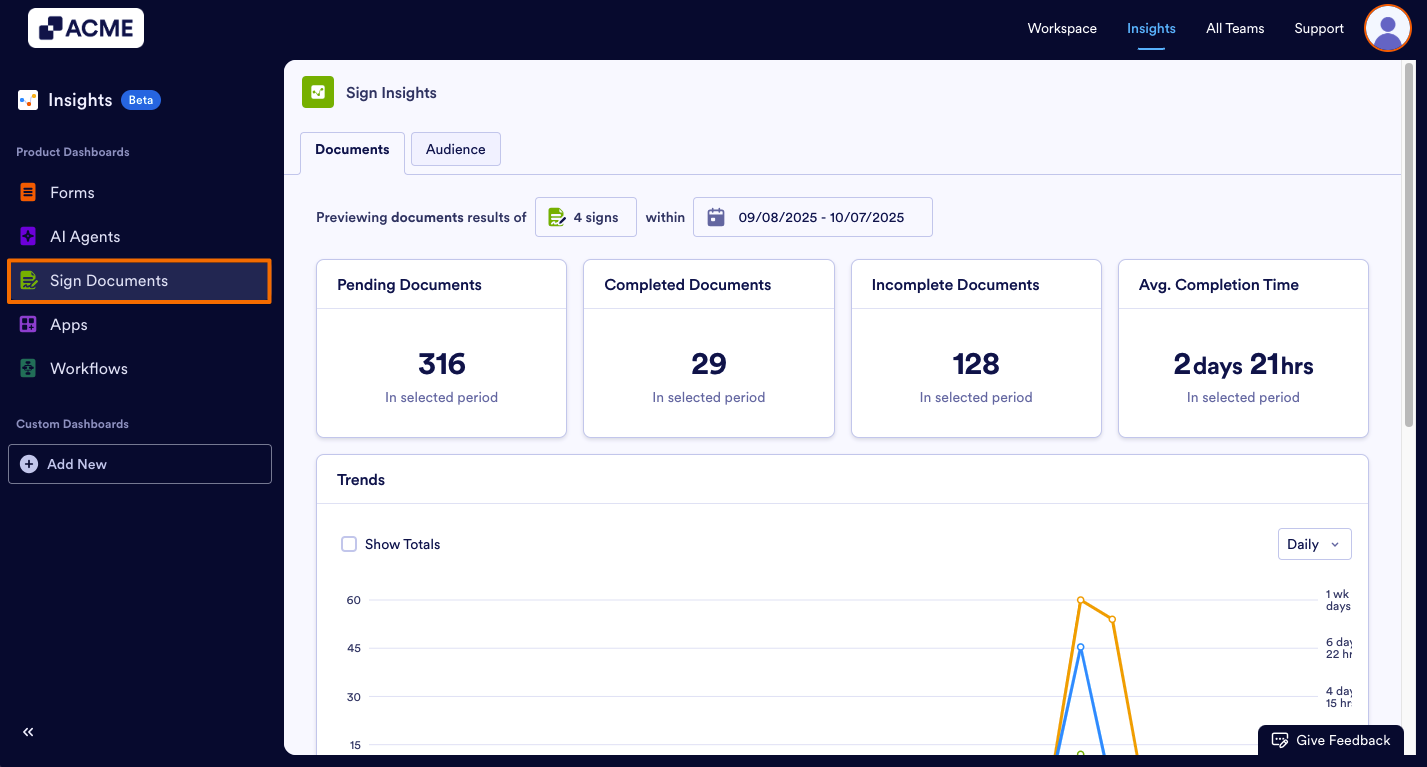
- In the Insights page, click on Sign Documents from the menu on the left.
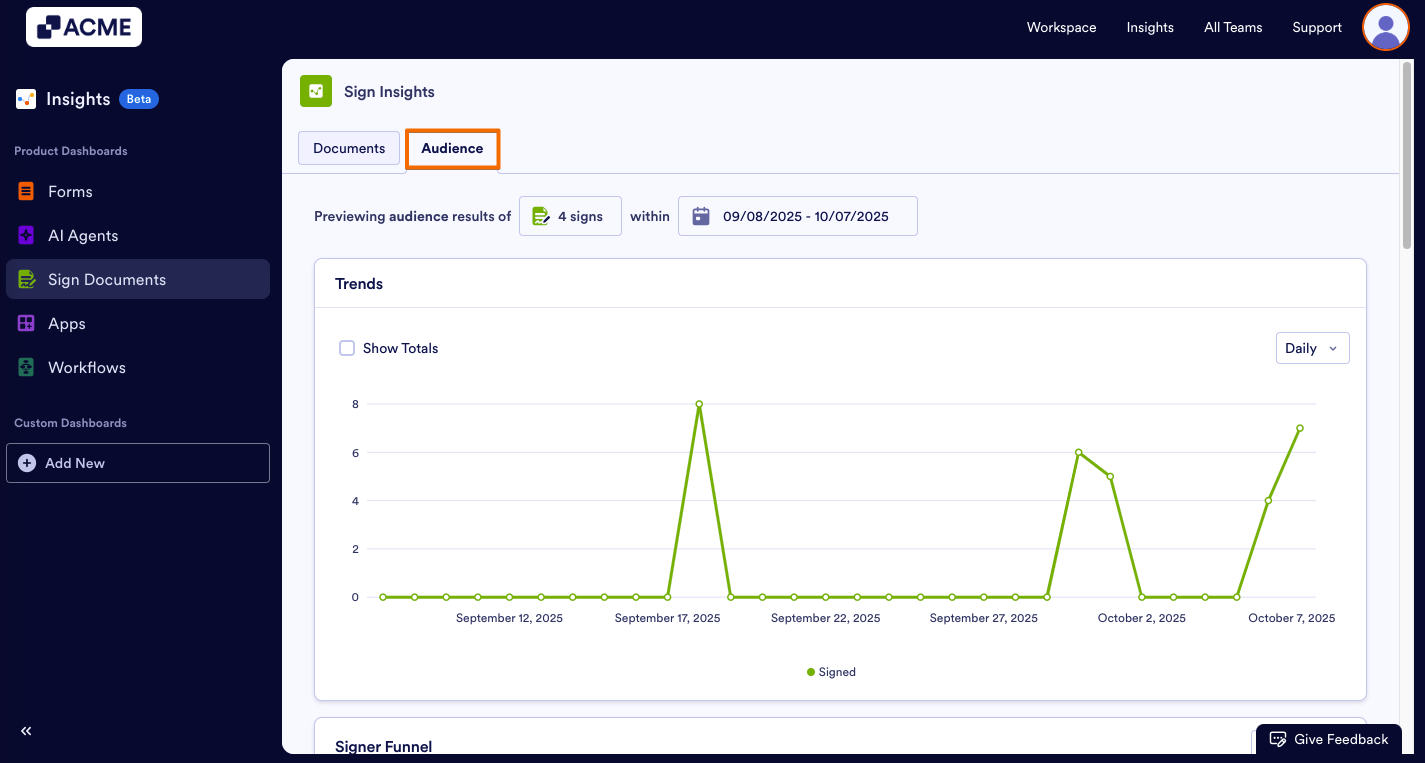
- In Sign Insights, click on Audience at the top of the page.
Note: You can also filter the Sign Documents you want to analyze and select a date range to view more specific data. When you set a filter for any tab in Sign Insights, it applies to all tabs (Documents, Audience). This makes it easy to see different metrics for the same data set.
What Metrics Do We Provide?
The Audience tab displays signer related metrics in various chart and card types. Also, a list of signer details can be found under the other metrics.
Trends
The Trends chart displays the number of signed documents through the selected date range.
- Changing the Time Interval: Click on the drop-down menu at the top of the chart and select daily, weekly, monthly, or yearly.
- Depending on the date range you’ve selected, some options might not be available. For example, if your date range for the tab is set to last seven days, you won’t be able to select monthly or yearly.
Signer Funnel
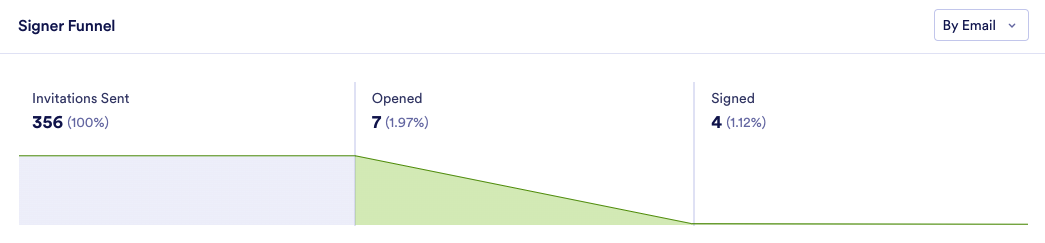
Signer Funnel card shows the actions taken by signees for documents in a funnel. You can see the details about the breakdowns given in the funnel below:
- Invitation Sent: The number of invitations sent to signees in the selected date range.
- Opened: The number of the documents opened by the signees.
- Signed: The number of the documents signed.
Use the dropdown on the top-right of the card to filter by share type:
- By Email: Shows the number and percentage of signees who received invitations, opened, and signed documents in a funnel.
- By Embed: Shows the number of signees who opened and completed the embedded document in a funnel.
- By Link: Shows the number of signees who opened and completed the document via a link in a funnel.
Other Card Metrics
Under the Line chart and the Signer Funnel, other valuable insights can be found in card format. You can check the details about each card below:
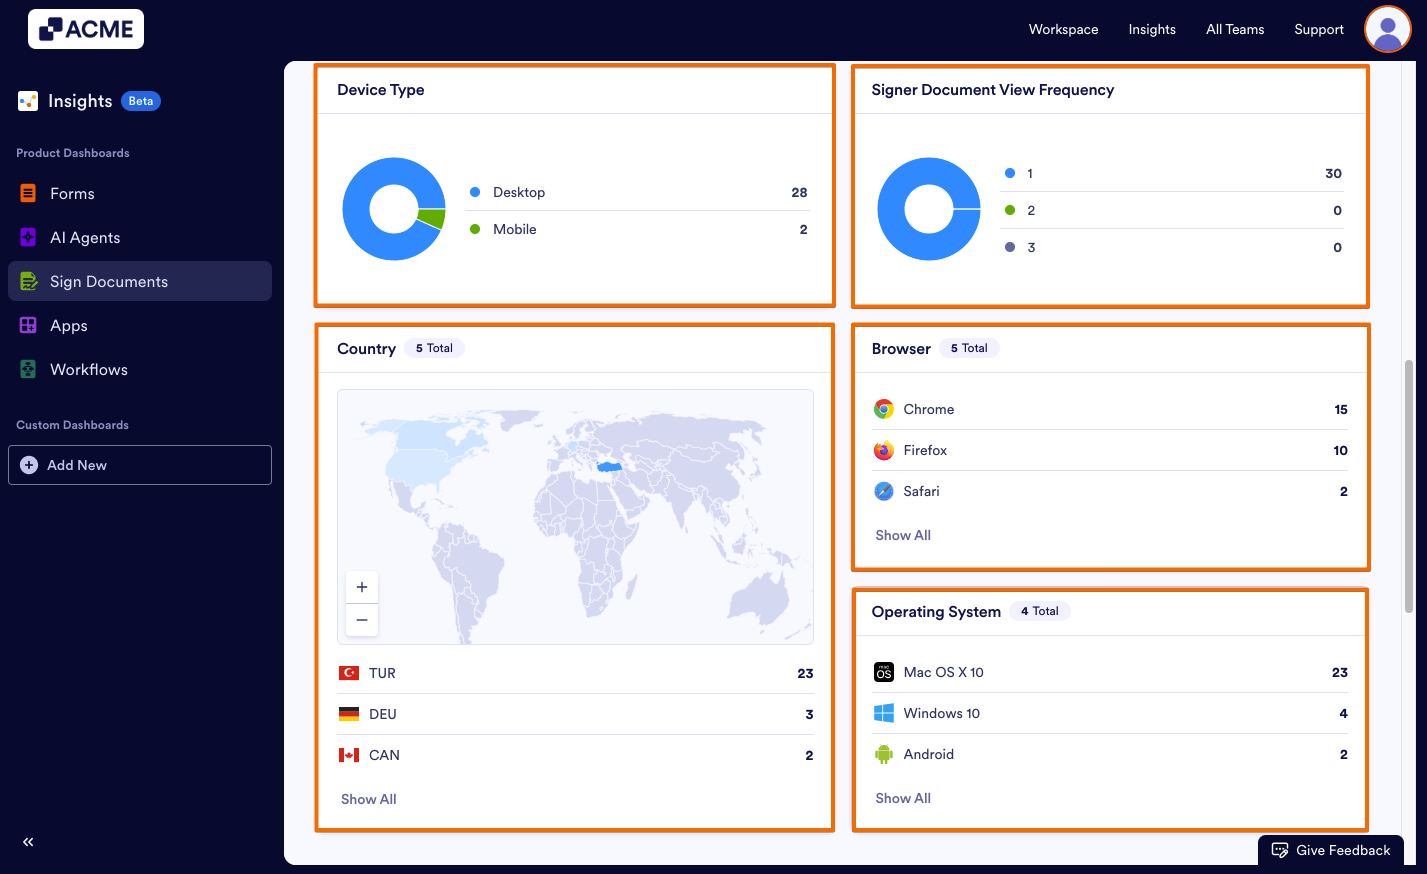
- Device Type: This donut chart shows the distribution of signed document numbers, divided between desktop and mobile users.
- Signer Document View Frequency: This donut chart shows distribution of signed document numbers by how many times it is visited before completing the signing process. The frequency options are 1 time, 2 times or more than 3 times.
- Country: This card shows the distribution of signed document numbers divided between countries in a map and country list format.
- Browser: This card shows the distribution of signed document numbers by browsers, such as Chrome, Chrome Mobile, Safari, Edge, and DuckDuckGo.
- Operating System: This card shows distribution of signed document numbers by operating system (e.g., Windows, macOS, iOS, Android).
Signer Details List
Want a detailed view of each signer’s activity? At the bottom of the Audience tab, you’ll find the Signer Details list. This section provides an in-depth breakdown of every signer’s interaction with your documents. For each signer, you can see the Date of Interaction, the Document Name, the Time Spent on the Document, the Country of the Signer, the Device Used (such as Desktop or Mobile), the Browser, the Operating System, the IP Address, and the Sign ID.
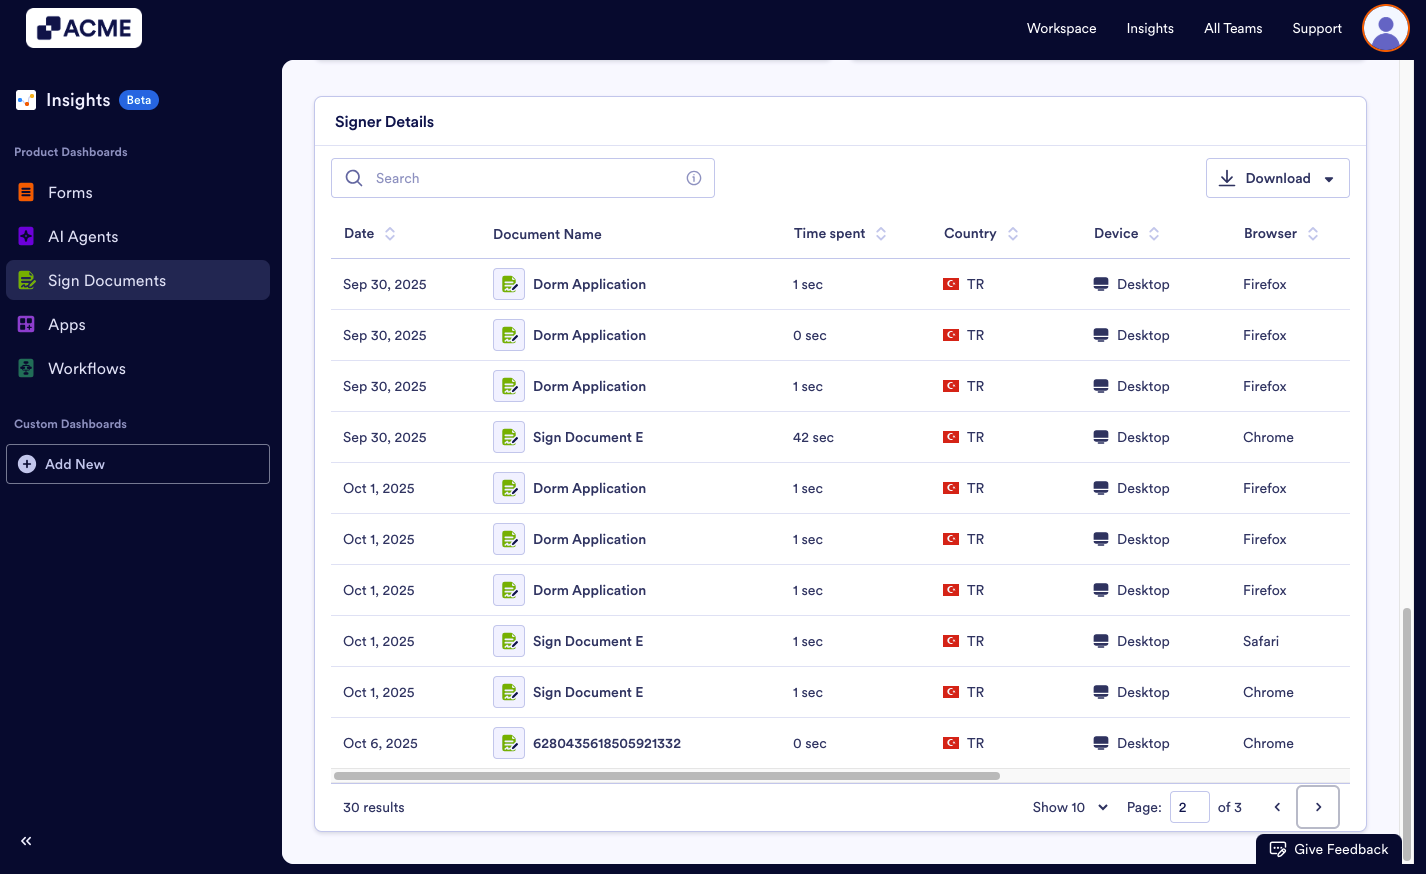
- These metrics are per signs, and are specific to the date range selected at the top of the page.
- You can download the entire list by clicking the Download button on the right and saving it as a CSV or Excel file.

Send Comment: