Insights
Learn how to access analytics for all assets: Forms, Sign Documents, Agent App, and Workflows.
Guides
What is Insights?
Managing and analyzing performance data across multiple assets – such as Forms, Apps, Workflows, and Documents – can quickly become a full time job. Insights – a centralized analytics hub for tracking, visualizing, and comparing...

How to View Form Performance Metrics in Insights?
The Form Insights page provides detailed analytics with various metrics and breakdowns, allowing users to track the performance of their forms. Users can filter forms and analyze the performances, using specific metrics and select date ranges...
How to View Forms Audience Metrics in Insights?
Form Insights Audience tab shows the users visiting and interacting with your form, including view and submission counts, device types, browsers, operating systems, and their country of residence, and how they found your form. Accessing Form...
How to View Form Engagement Metrics in Insights?
Form Insights provides various metrics within cards to analyze Form Engagement results. Engagement results are how your forms are interacting with form fillers. There are 2 types of data that can be filtered in the engagement section: Time...
How to View Individual Form Usage Metrics in Insights?
In Form Insights, you can track the performance of forms, monitor submissions, understand how users interact with your forms, and gain insights to improve engagement and results. You can also select the form/forms that you want to gain insights...
How to Filter and View Form Metrics in a Specific Date Range in Insights?
Using Insights, you can compare forms from all metrics across different periods of time. Want to see how the form did on Christmas? What about for the last year? This process is the same for every section of Form Insights, and filters stay the...
How to Download Form Metrics as Excel or CSV from Insights?
Within the Form Insights page, you can download your forms’ performance and audience results as a list including breakdowns with helpful metrics in Excel or CSV format for further analysis or reporting. This guide will show you how to export...
How to View AI Agent Performance Metrics in Insights?
AI Agents do a lot of work. If you’re curious about how they’re performing, including the number of sessions they’ve been in, the duration, and the average user interaction, you can check out AI Agents’ Performance Metrics. Here, you’ll...
How to View AI Agent Conversation Metrics in Insights?
The Conversations tab in AI Agent Insights provides detailed information about user interactions with your AI Agents. It highlights how conversations are initiated, how they are handled, and offers access to individual conversation details. With...

How to View an Individual AI Agent Usage Metrics in Insights?
In AI Agent Insights, you can track the performance of your agents, monitor conversations, understand how users interact with them, and gain insights to improve engagement and outcomes. You can also select the agent or agents you want to analyze...
How to Filter and View AI Agent Metrics in a Specific Date Range in Insights?
With AI Agent Insights, you can filter statistics within a specific date range to analyze trends, track performance, or compare activity across different periods. The selected timeframe applies to all metrics, including those in the Performance...

How to Download AI Agent Metrics as Excel or CSV from Insights?
Within the AI Agent Insights page, you can download the performance and conversation results of your agents as a list with detailed breakdowns and helpful metrics in Excel or CSV format for further analysis and reporting. This guide will show you...
How to View Sign Documents Metrics in Insights?
The Sign Insights page provides detailed analytics with various metrics and breakdowns, allowing users to track the performance of their sign documents. Users can analyze the performance of selected documents using specific metrics and date ranges...
How to View Sign Documents Audience Metrics in Insights?
The Sign Insights page provides a clear view of how signees interact with your sign documents. It helps you measure engagement through the signing process and spot trends across your documents. Accessing Sign Documents Audience Metrics...
How to View Individual Sign Document Metrics in Insights?
In Sign Insights, you can track the status of documents, and understand how users interact with your documents, and gain insights to improve engagement and results. You can also filter the document/documents that you want to gain insights about...
How to Filter Sign Document Metrics in a Specific Date Range in Insights?
Sign Insights allows you to filter document-related insights by a date range to analyze performance, track completion rates, and compare activity over time. The date you selected once is applied to the Documents and Audience tabs so you do not...
How to Download Sign Document Metrics as Excel or CSV from Insights?
Within the Sign Insights page, you can download your documents’ performance and audience results as a list including breakdowns, with helpful metrics in Excel or CSV format for analysis or reporting. This guide will show you how to export your...
How to View Apps Performance Metrics on Insights?
The App Insights page provides detailed analytics with various metrics and breakdowns, allowing users to track how well their apps are performing. You can analyze the app activity across specific date ranges, compare metrics, and drill down into...
How to View Apps Audience Metrics in Insights?
The App Insights Audience tab shows detailed information about how users access and interact with your apps. This view focuses on metrics such as device type, source, country, browser, and operating system, helping you better understand your...
How to View an Individual App Metrics in Insights?
In App Insights, you can track the performance of your apps, monitor traffic and downloads, understand how users engage with them, and gain insights to improve results. You can also select the app or apps you want to analyze using the App filter....
How to Filter and View App Metrics in a Specific Date Range in Insights?
With App Insights, you can filter statistics by a date range to analyze trends, monitor performance, and compare activity over time. The selected date range applies to all metrics on the page, including the Performance and Audience sections. This...
How to Download Apps Metrics as Excel or CSV from Insights?
Within the App Insights page, you can download your apps’ performance and usage results as a list with detailed breakdowns and helpful metrics in Excel or CSV format for further analysis and reporting. This guide will show you how to export your...
How to View Workflow Metrics in Insights?
The Workflow Insights page provides detailed analytics with various metrics and breakdowns, allowing users to track the performance of their workflows. Users can analyze workflow activity across specific date ranges, compare key metrics, and...
How to View an Individual Workflow Usage Metrics in Insights?
In Workflow Insights, you can track the status and performance of your Workflows, understand how participants interact with them, and gain insights to improve efficiency and outcomes. You can also filter the Workflow or Workflows you want to...
How to Filter and View Workflow Metrics in a Specific Date Range in Insights?
Workflow Insights allows you to filter Workflow-related insights by a date range to analyze performance, track completion rates, and compare activity over time. The date range you select is applied to all metrics on the page, so you don’t need...
How to Download Workflow Metrics as Excel or CSV from Insights?
Within the Workflow Insights page, you can download your Workflows’ performance results as a list with detailed breakdowns and helpful metrics in Excel or CSV format for analysis and reporting. This guide will show you how to export your...
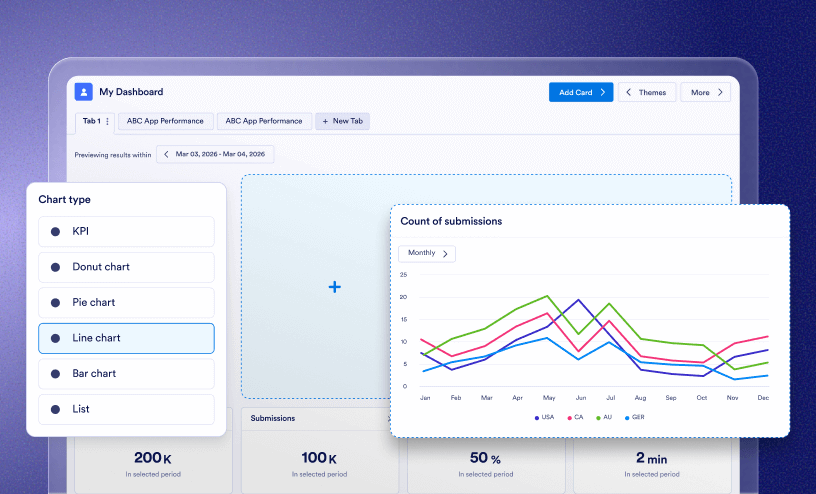
How to Create and Customize Custom Dashboards in Insights?
In Insights, key data can be grouped and organized in one place – Dashboards! This flexible workspace is a place where you can structure your information, group it into tabs, and adjust the appearance to match your brand. In this guide,...
How to Manage Cards in Your Custom Dashboard in Insights?
Cards are the main components of custom Dashboards. Each one can display a specific data visual, such as a chart tracking views over a month, or a list of viewers by country, and help you track and analyze various metrics at once. In this...
How to Create and Manage Themes for Your Custom Dashboard in Insights?
Themes let you take the customization of your custom Dashboards. Using either System Palettes or Custom Palettes, you can create a consistent and professional look to your Dashboards and control the colors used across cards, chart features, and...
How to Add Your Custom Dashboard to Favorites in Insights?
Adding a Dashboard to Favorites Adding a dashboard to your favorites lets you quickly access it without searching through the full list. There are two ways to mark a dashboard as a favorite. From the Custom Dashboards List In...
How to Lock Your Custom Dashboard in Insights?
You’ve spent a lot of time setting up your Custom Dashboard to be just right—and unintentional changes to the layout or the size of the cards could throw it off. Locking your Dashboard ensures that everything stays in its place, even if you...