Managing and analyzing performance data across multiple assets – such as Forms, Apps, Workflows, and Documents – can quickly become a full time job.
Insights – a centralized analytics hub for tracking, visualizing, and comparing performance data – is here to help cut down on the busy work of data analysis. Insights provides both automatically generated Product Dashboards and the ability to build Custom Dashboards to give you high-level overviews and detailed, tailored reports.
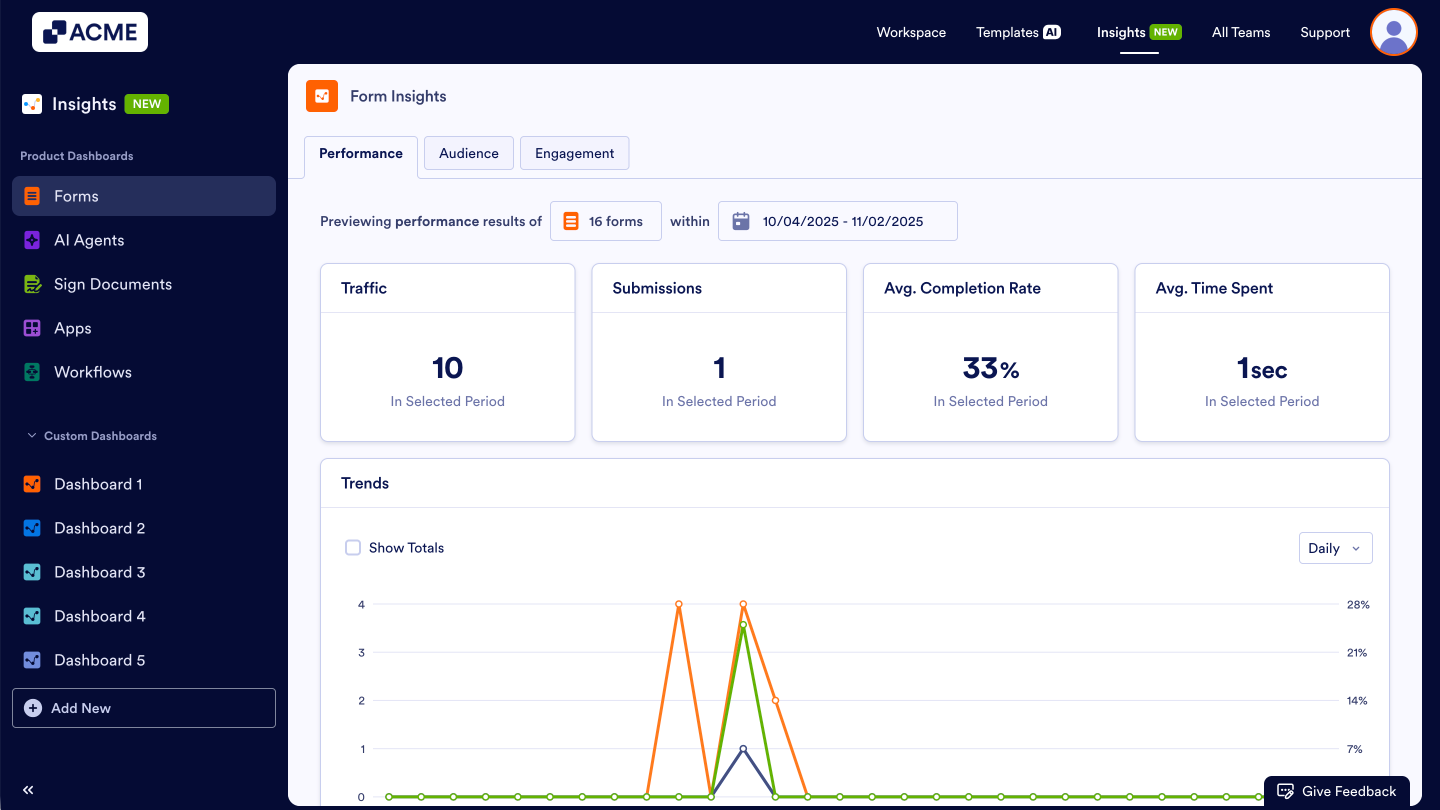
With Insights, you can:
- View key metrics across all product dashboards.
- Monitor activity trends, completion rates, and user behavior to understand how each asset performs.
- Create Custom Dashboards to visualize specific metrics across multiple assets in one view.
- Add and edit cards such as charts, KPIs, and lists to display the data that matters most.
- Organize dashboards into tabs for different reports or focus areas.
Insights transforms raw data into visual stories, helping you measure impact, discover trends, and make informed, data-driven decisions.

Send Comment: