Cards are the main components of custom Dashboards. Each one can display a specific data visual, such as a chart tracking views over a month, or a list of viewers by country, and help you track and analyze various metrics at once.
In this guide, we’ll go over adding, editing, rearranging, and deleting Cards to organize your Dashboard exactly how you want it.
Adding a Card
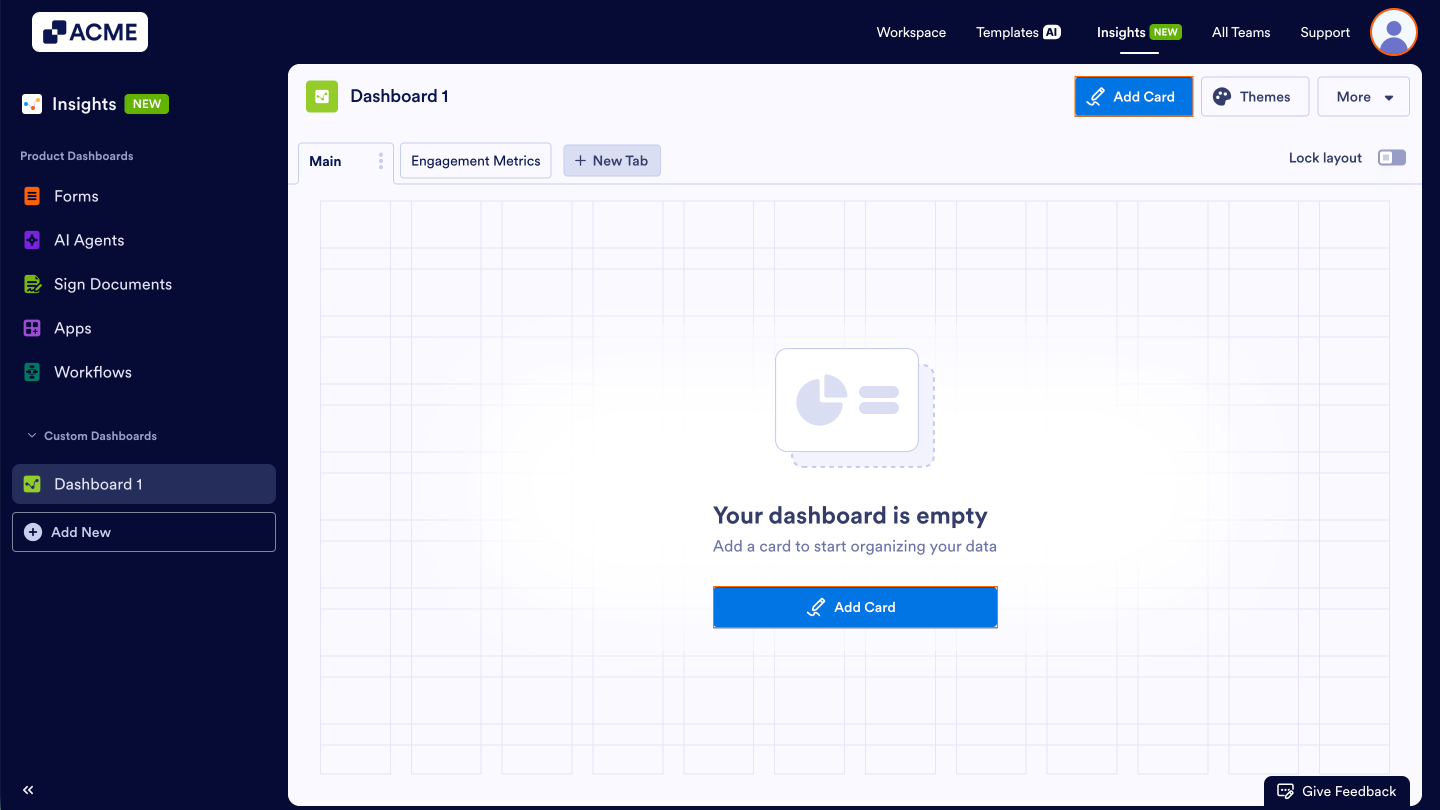
Dashboards and Tabs created from scratch are blank slates, ready for you to add custom cards and data visualizations to. You can also add cards to existing or cloned Dashboards, allowing you to update them to your evolving needs. Let’s walk through the process of adding a card to a tab together, whether it’s your first or your tenth one:
- In your custom Dashboard, click on the tab that you want to add a card to.
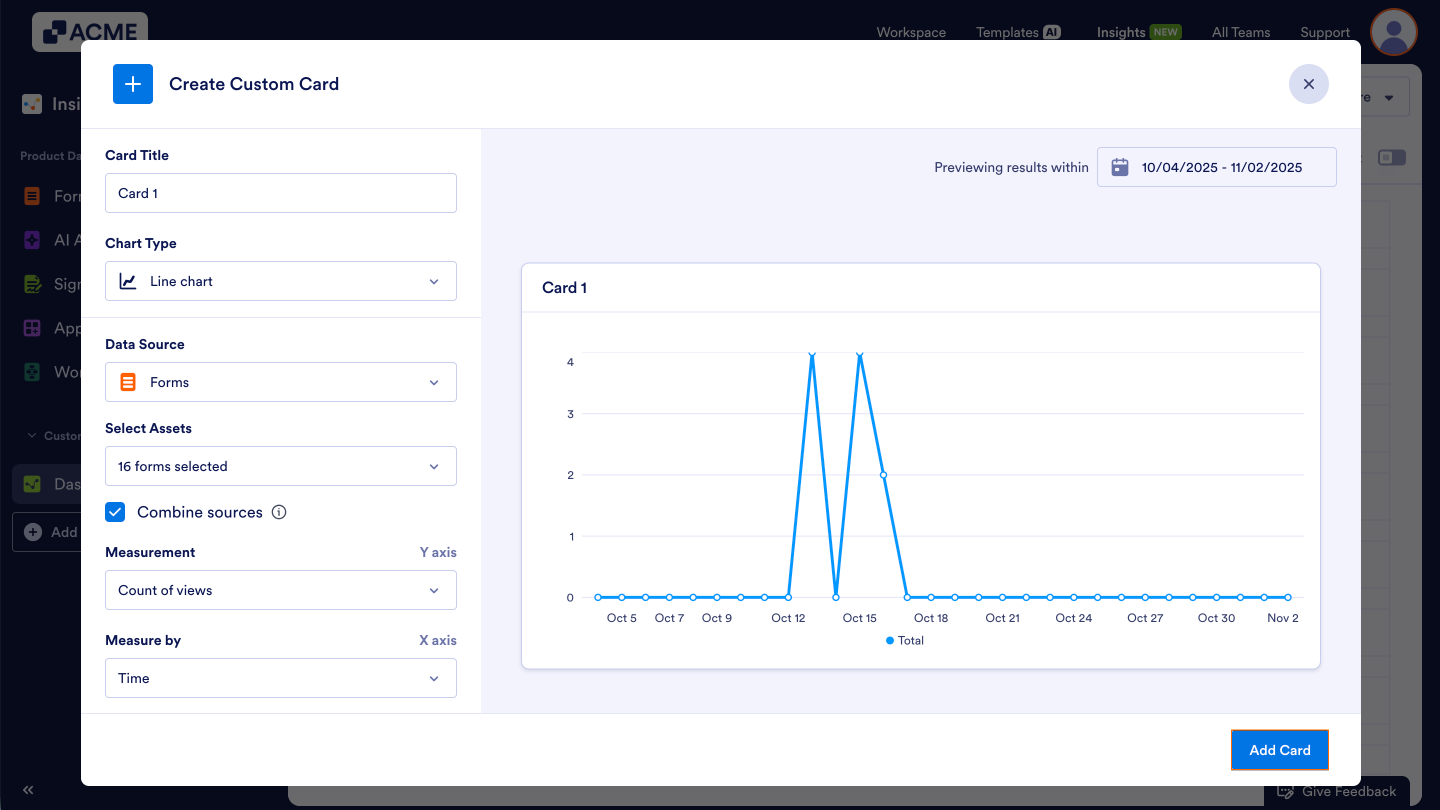
- If it’s a new tab or Dashboard, click Add Card in the middle of the page. Alternatively, you can click on Add Card in the upper right-hand corner.
- Under Card Title, give a name to your card.
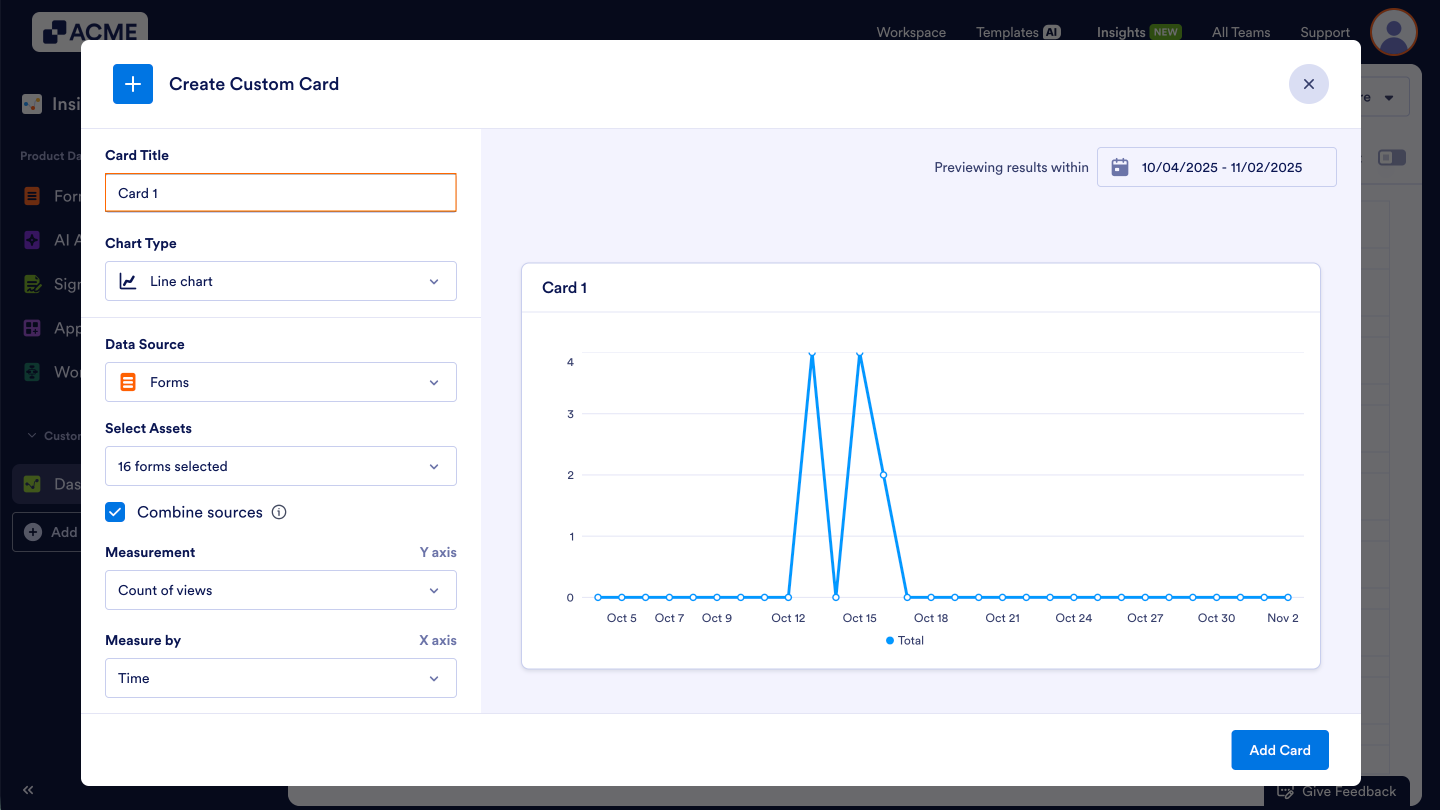
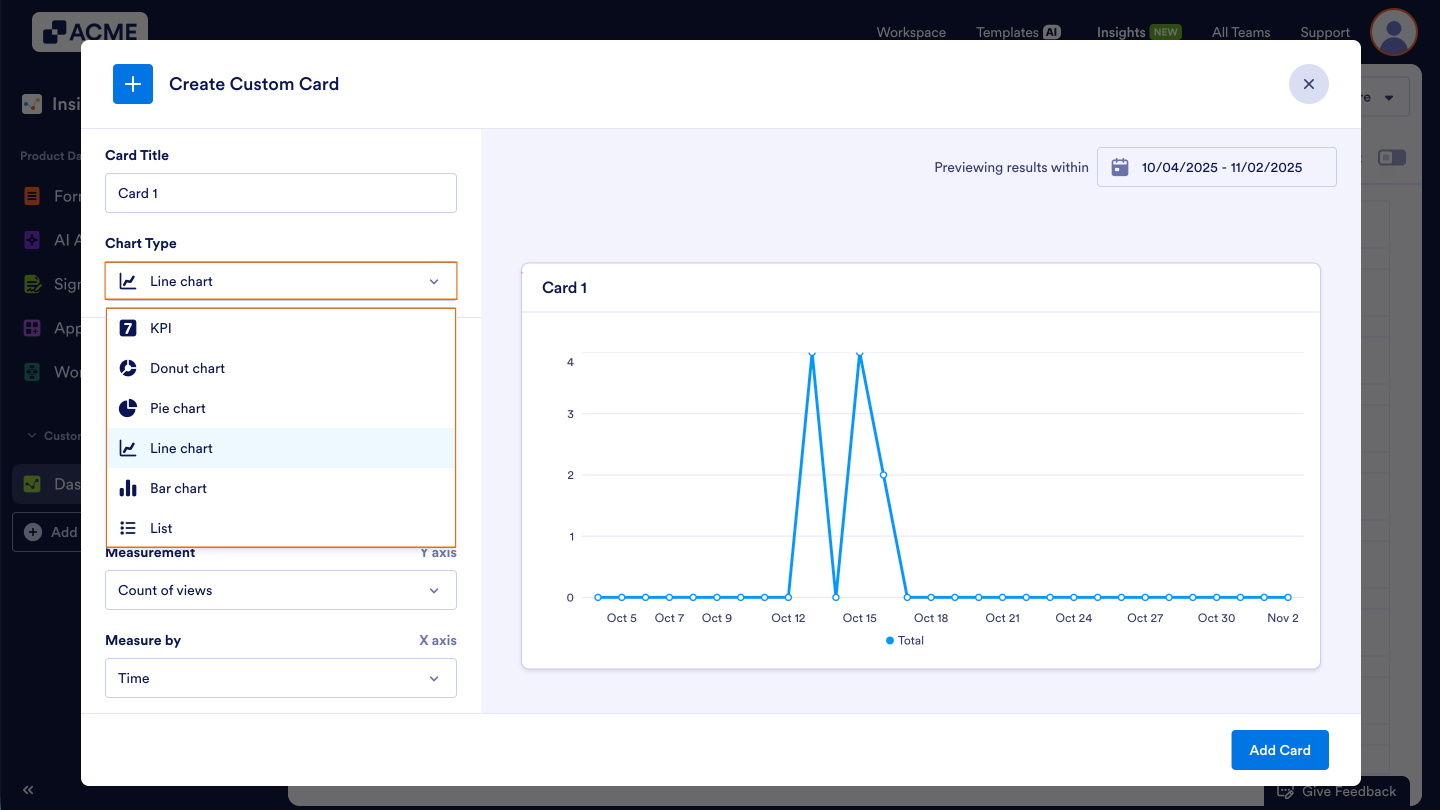
- In the Create Custom Card panel that opens, choose a Chart Type — such as KPI, Donut Chart, Pie Chart, Line Chart, Bar Chart, or List.
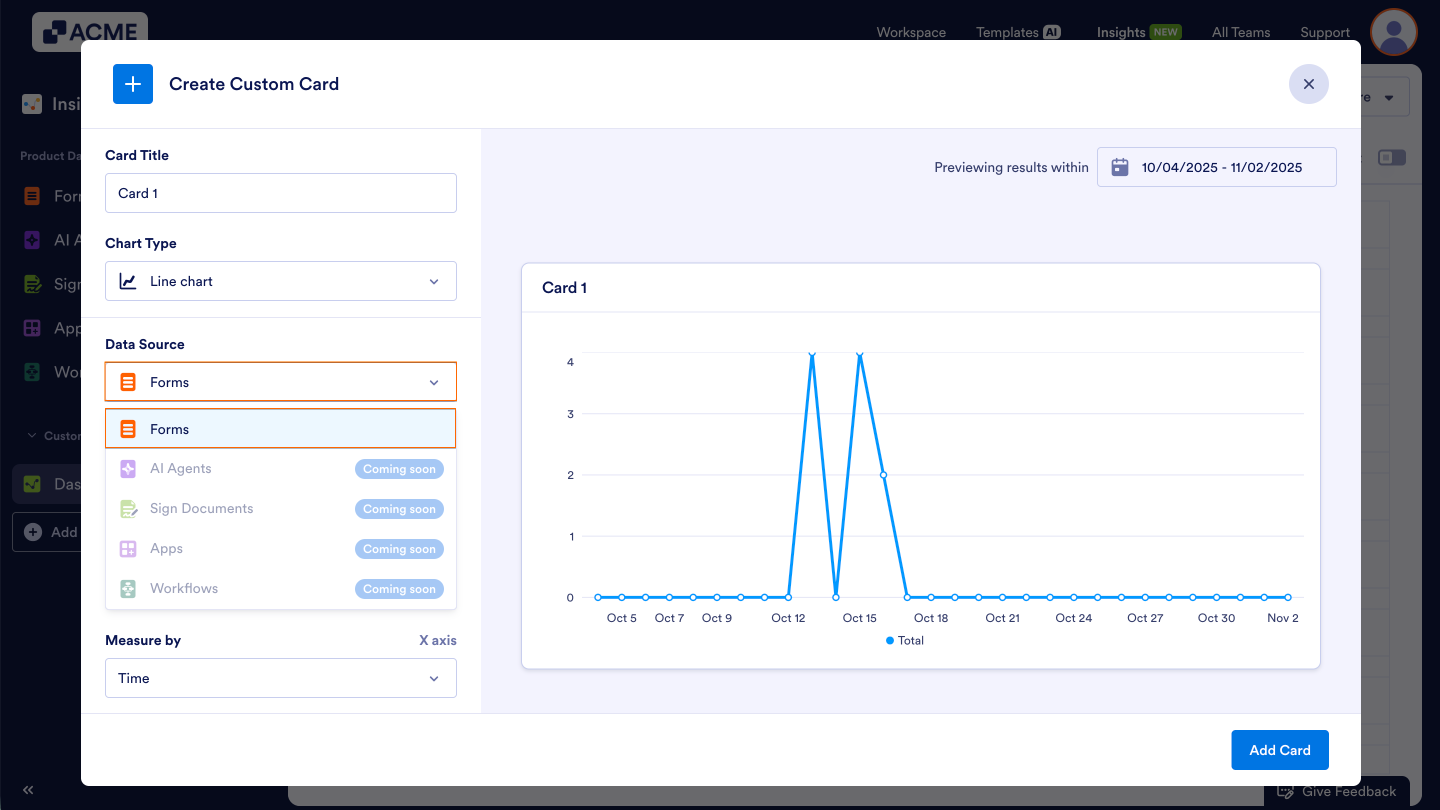
- Under Data Source, select the asset type you’d like to analyze.
Note: Currently, cards are only available for Forms, but other assets are coming soon, such as AI Agents, Sign Documents, Apps, and Workflows!
- In the drop-down menu under Select Assets, click on the checkbox next to each individual asset you’d like to display on the card.
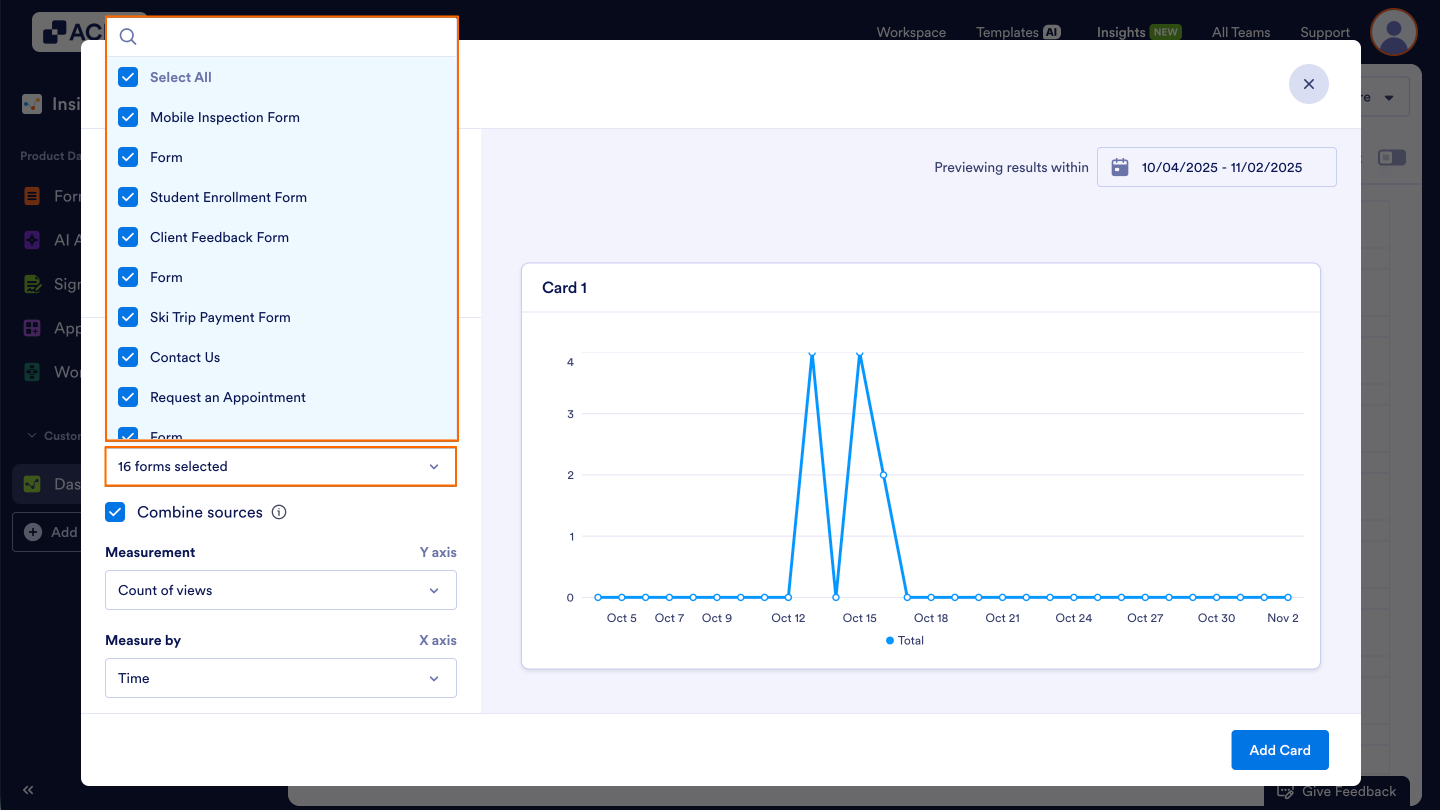
- To view multiple individual assets as a group, click on the checkbox next to Combine Sources. To view them individually, remove the check from the checkbox.

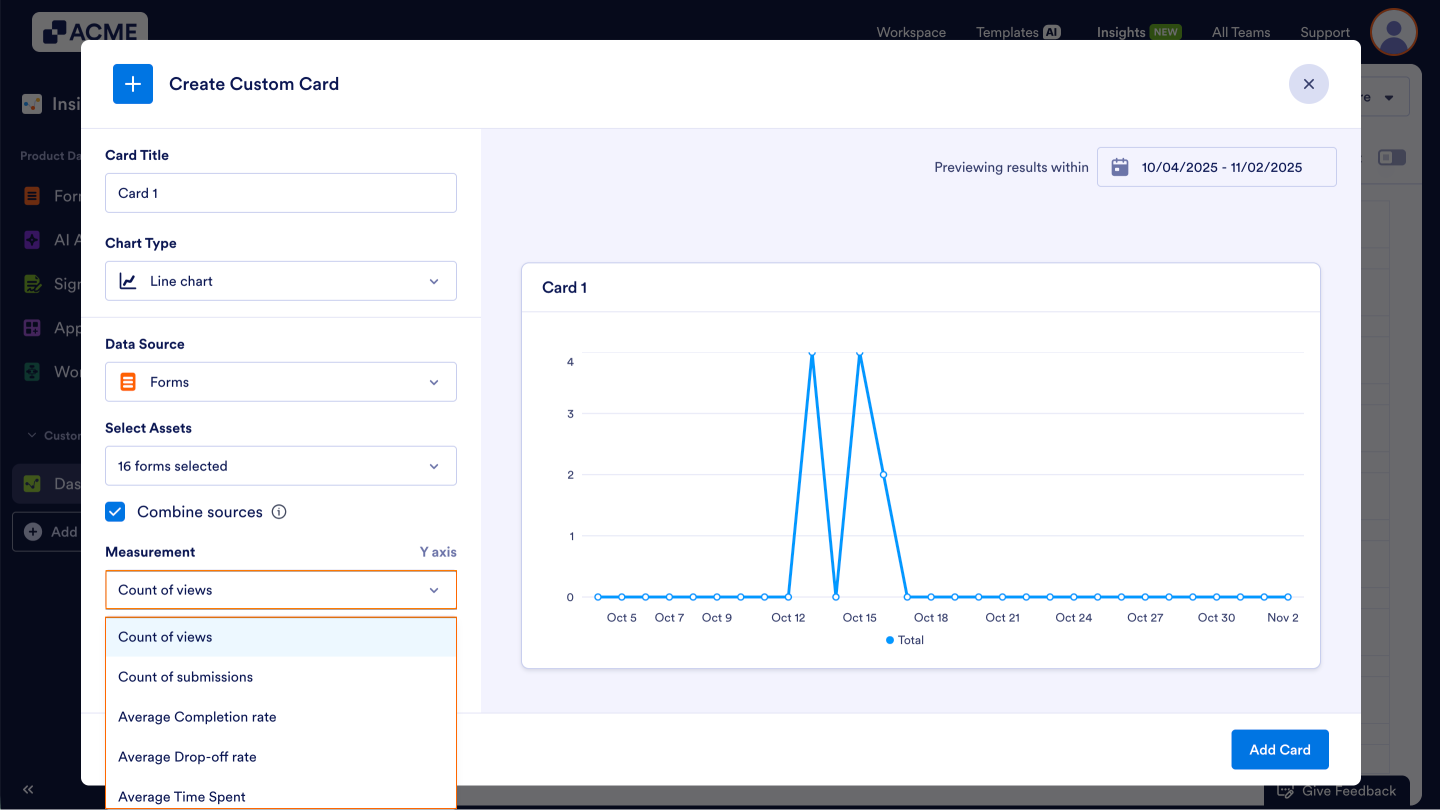
- In Measurement, choose what metric to track:
- Count of Views – Total number of times the selected forms have been viewed.
- Count of Submissions – Total number of completed submissions received.
- Average Completion Rate – Percentage of users who started and successfully completed the form, showing overall completion efficiency.
- Average Drop-Off Rate – Percentage of users who began the form but didn’t finish, useful for identifying form abandonment patterns.
- Average Time Spent – Average time users take to complete the form, helping assess form length and complexity.
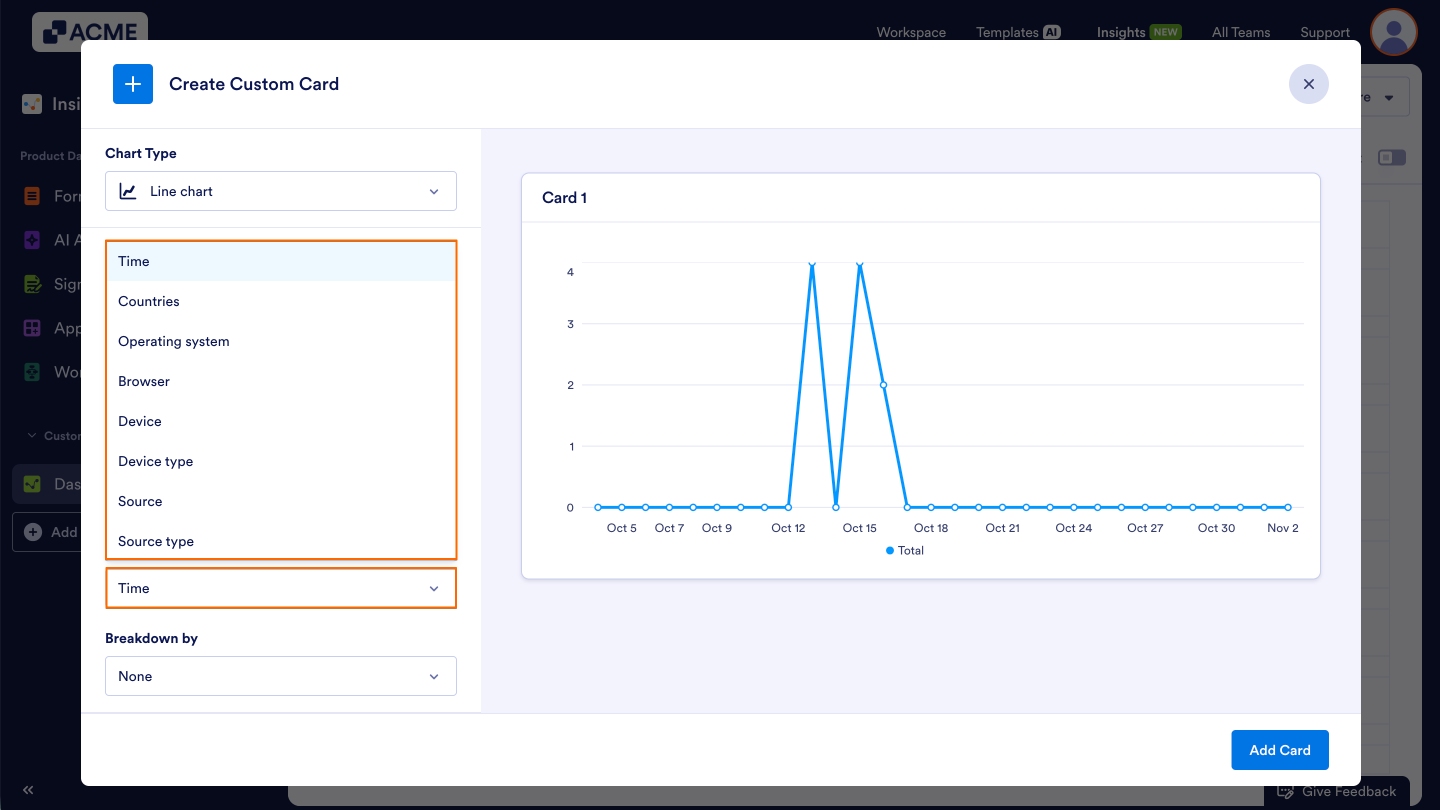
- In Measure by, pick how the data is grouped:
- Time – Displays changes over time (daily, weekly, monthly, depending on date range).
- Countries – Groups data based on respondent location.
- Operating System – Breaks down views or submissions by operating system (e.g., Windows, macOS, iOS, Android).
- Browser – Groups data by web browser used (e.g., Chrome, Safari, Edge).
- Device – Categorizes responses by device model.
- Device Type – Distinguishes between device types such as desktop, tablet, or mobile.
- Source – Groups data by traffic source (e.g., direct, social media, email campaign).
- Source Type – Categorizes broader source channels (e.g., organic, referral, paid).
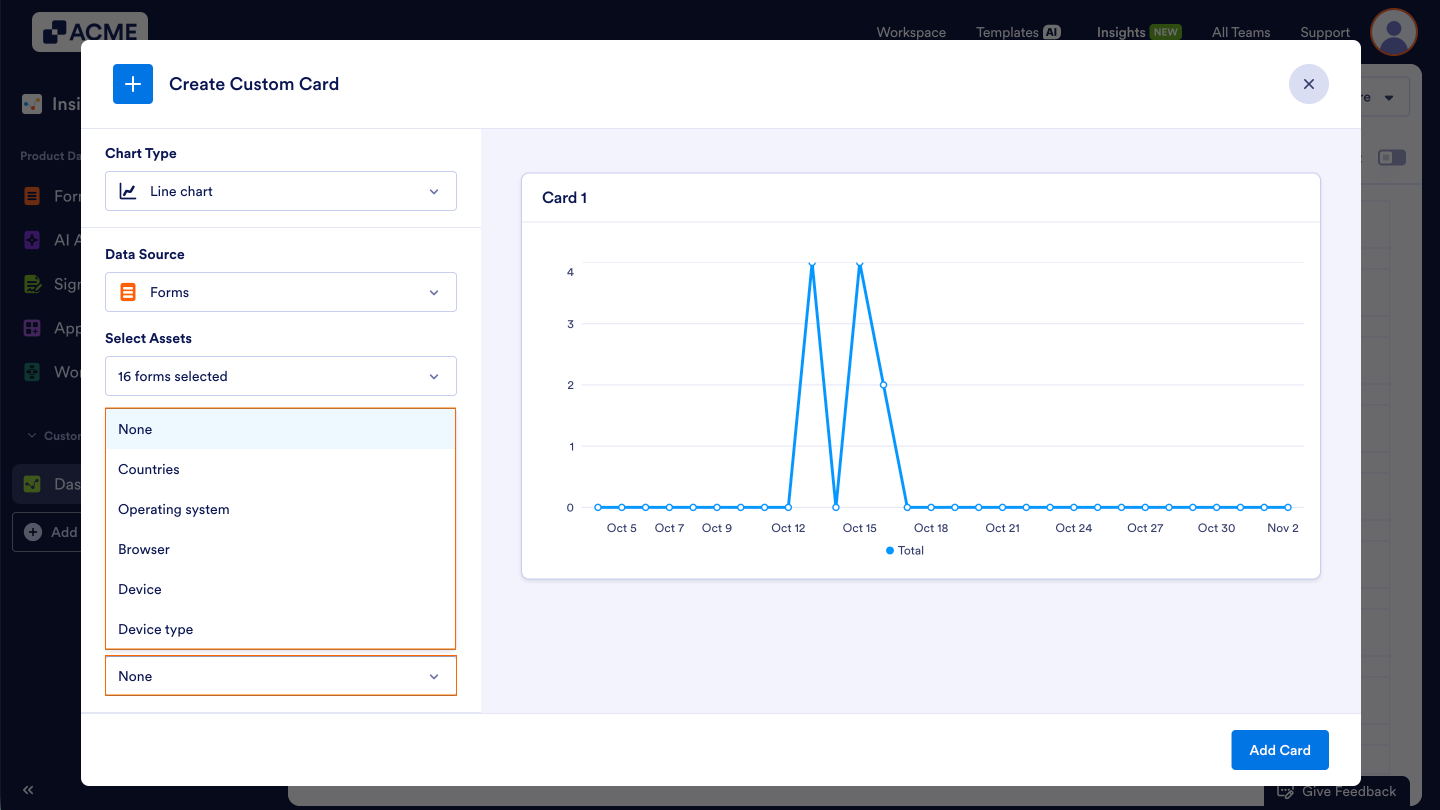
- In Breakdown by, you can add an additional layer of segmentation for deeper analysis:
- None – No secondary segmentation.
- Countries – Breaks each group down further by country.
- Operating System – Segments data by OS used.
- Browser – Adds browser-level segmentation.
- Device – Breaks down by specific devices.
- Device Type – Groups results by overall device type (desktop, tablet, or mobile).
- After checking the visualization out on the right, click on Add Card to add the card to your dashboard.
Your new card will appear on the current tab and populate automatically with live data.
Editing a Card
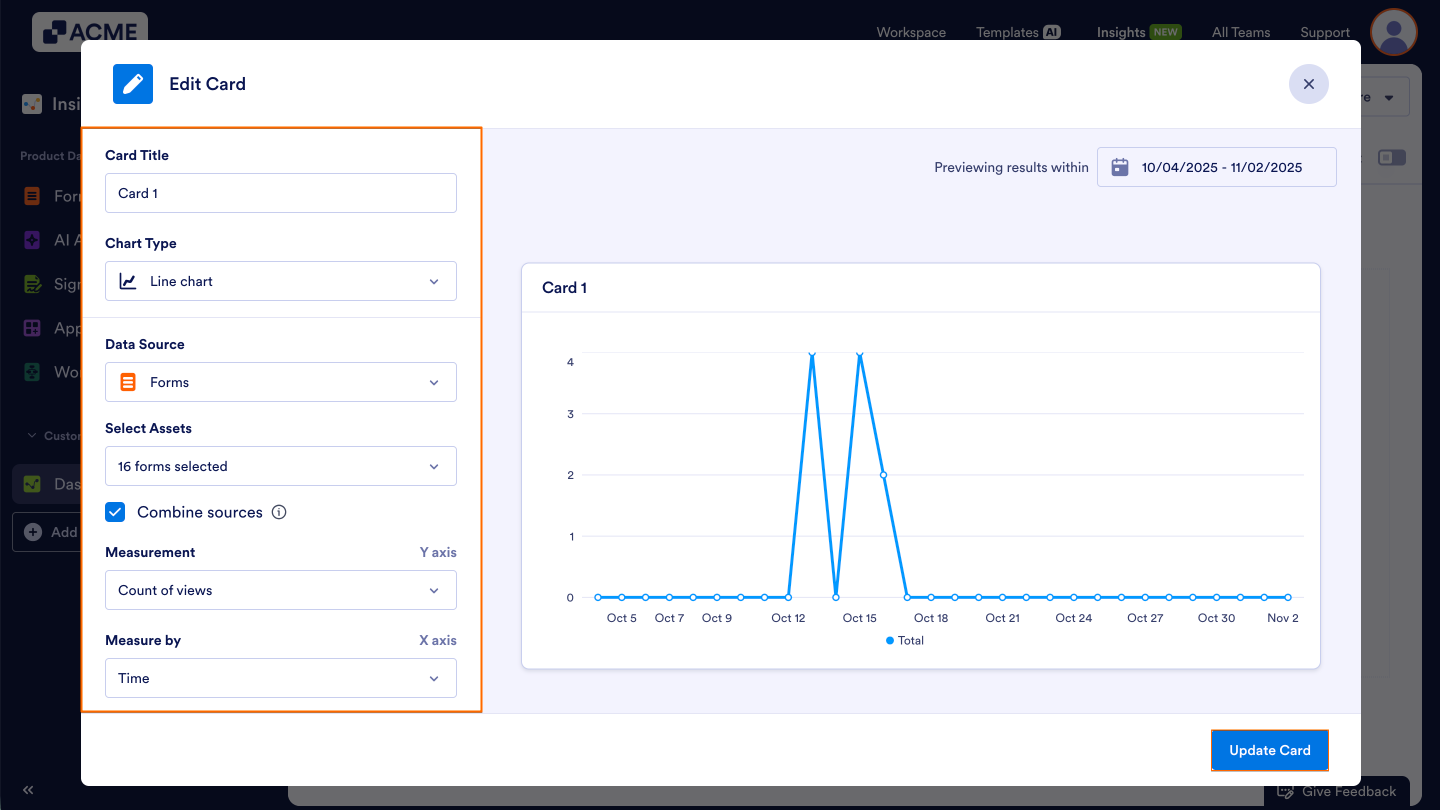
All card information — such as metrics, chart type, or filters — can be updated once the card is created. Let’s walk through this process together:
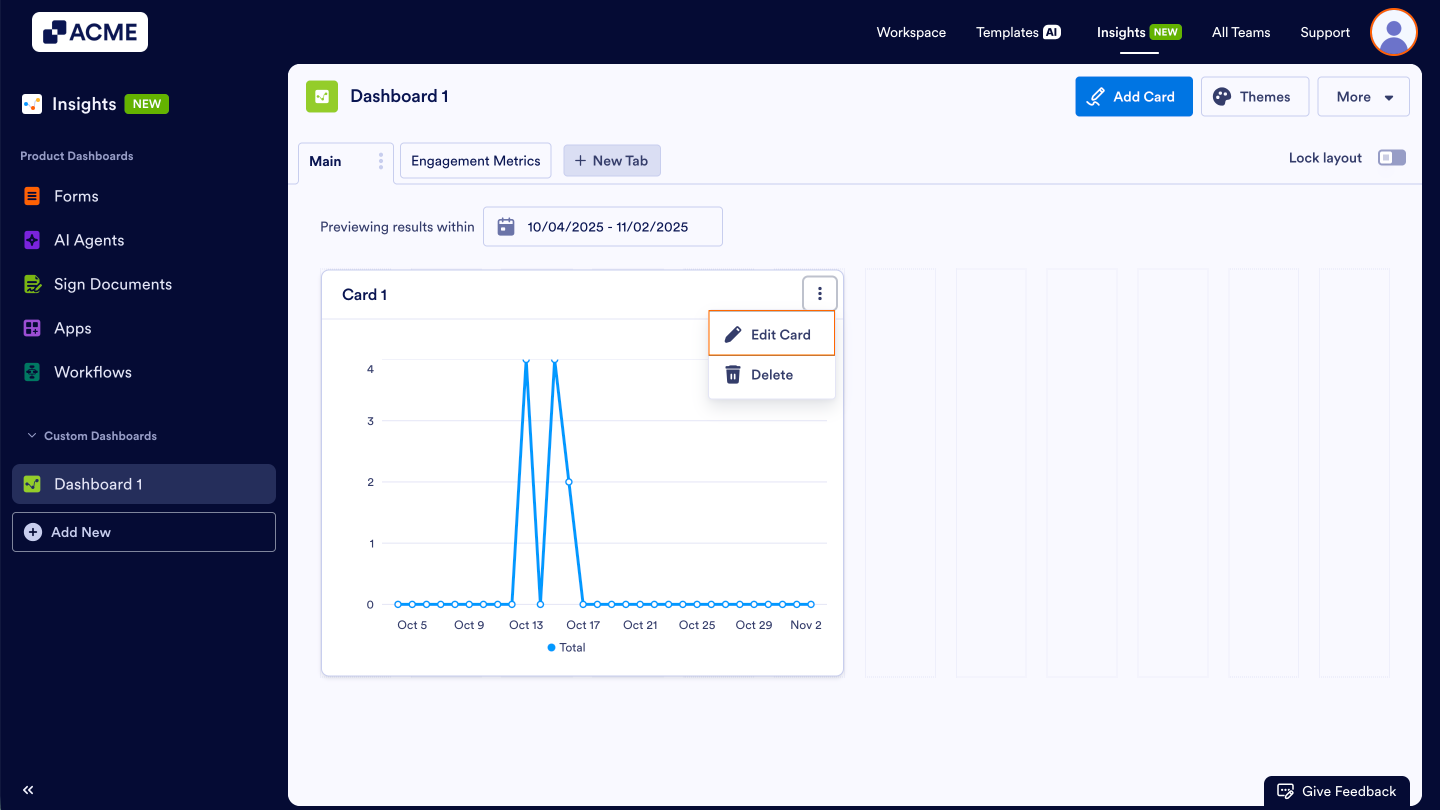
- Click on the three dot menu in the upper right-hand corner of the card you’d like to edit.

- Then, select Edit Card.
- Update your settings and click on Update Card in the bottom right-hand corner of Edit Card.
Moving a Card
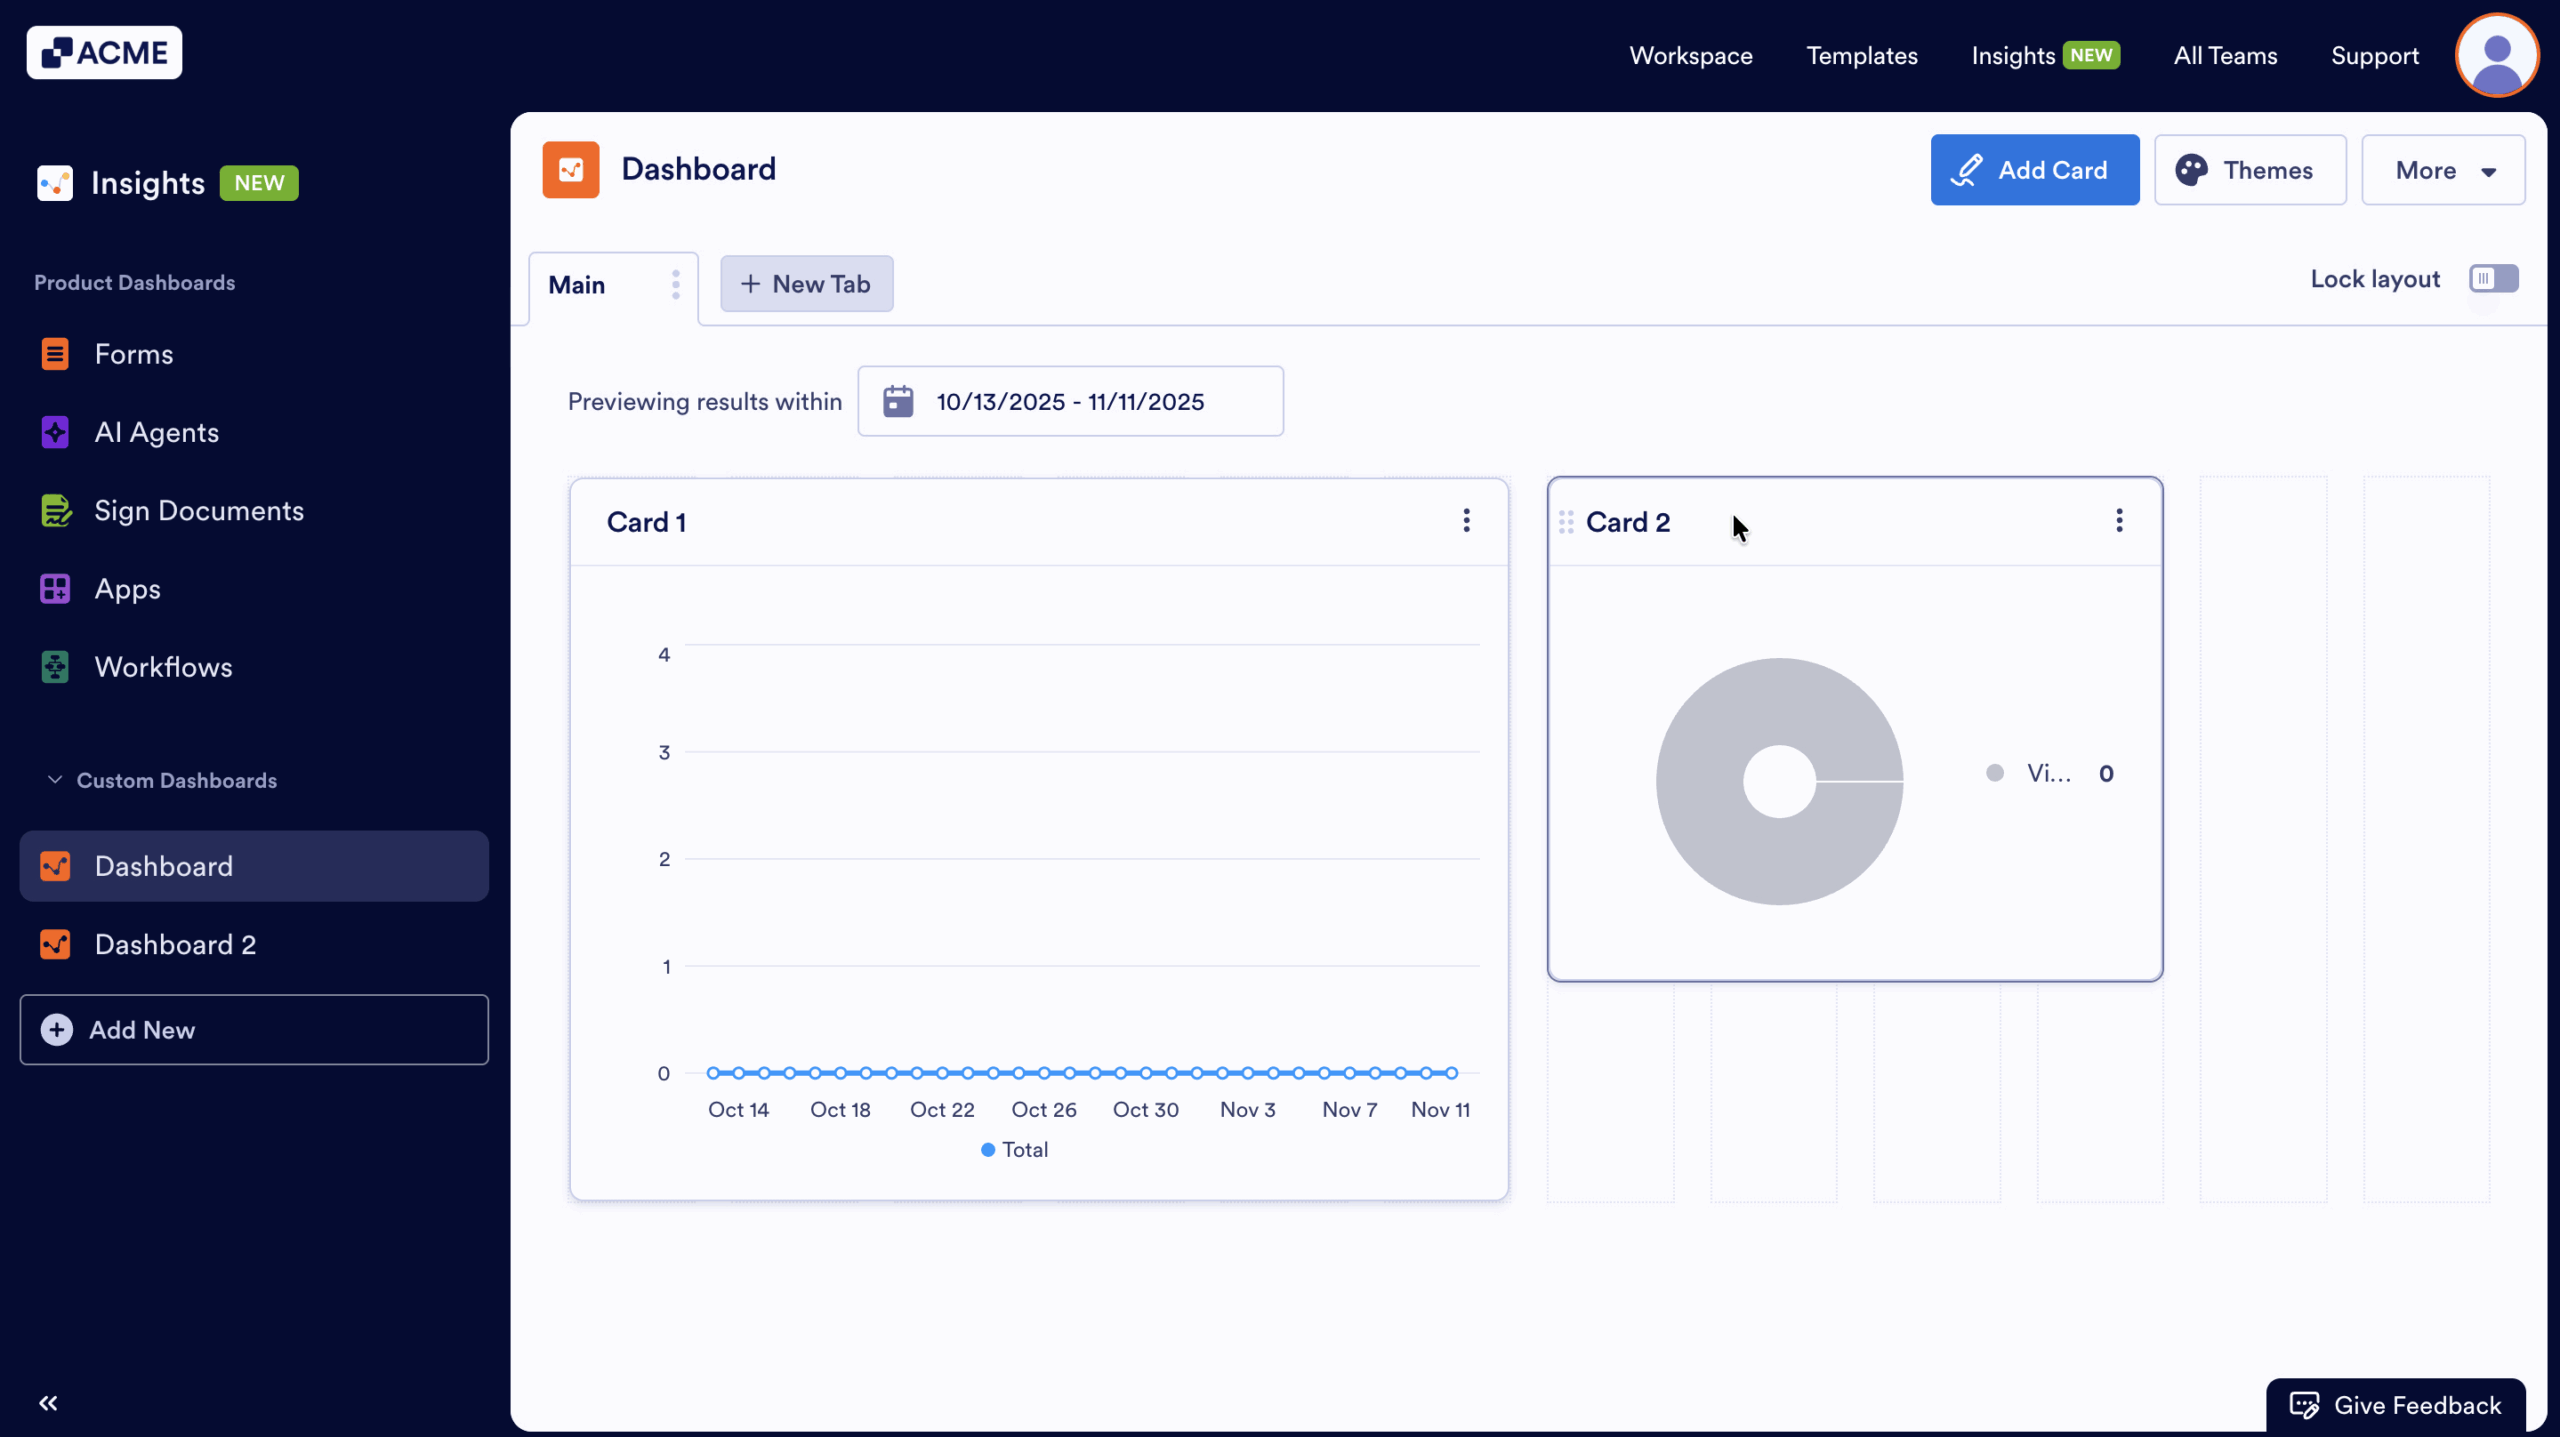
You can rearrange cards to organize your Dashboard’s layout. Let’s take a look at this process together
- Hover over the card you want to move.
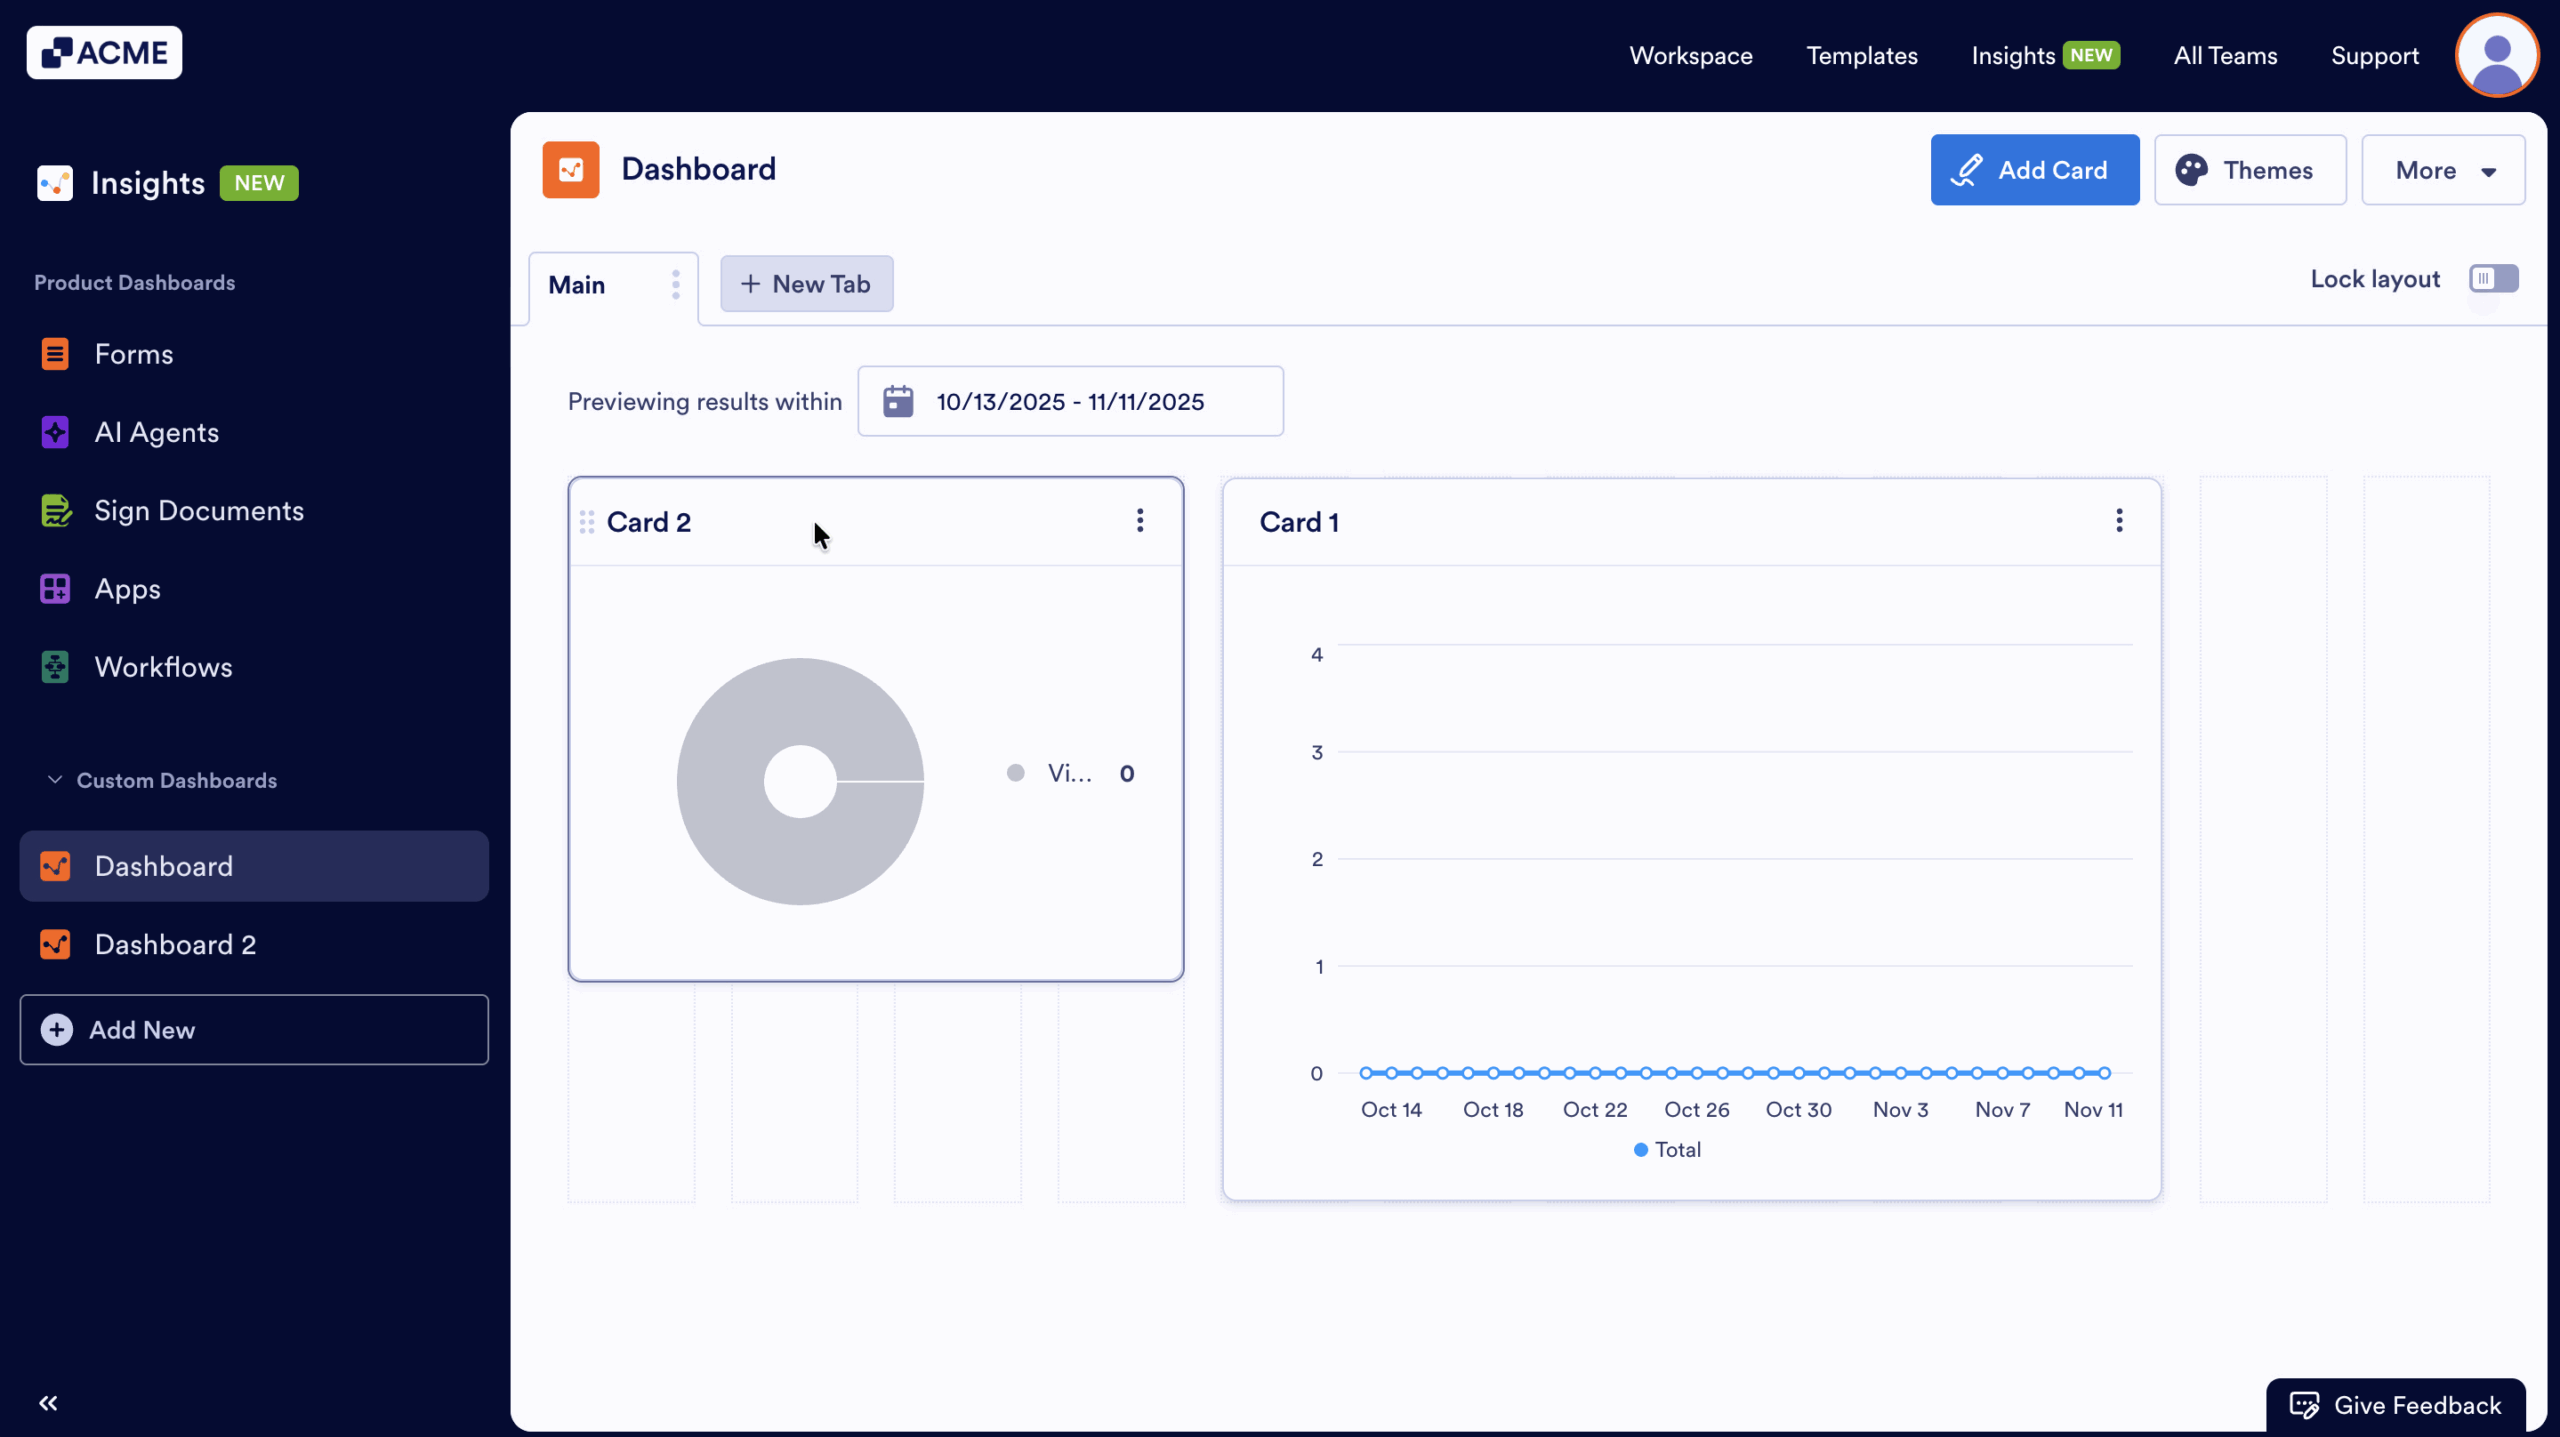
- Click on and hold the six dot icon on the left side of the Card Title
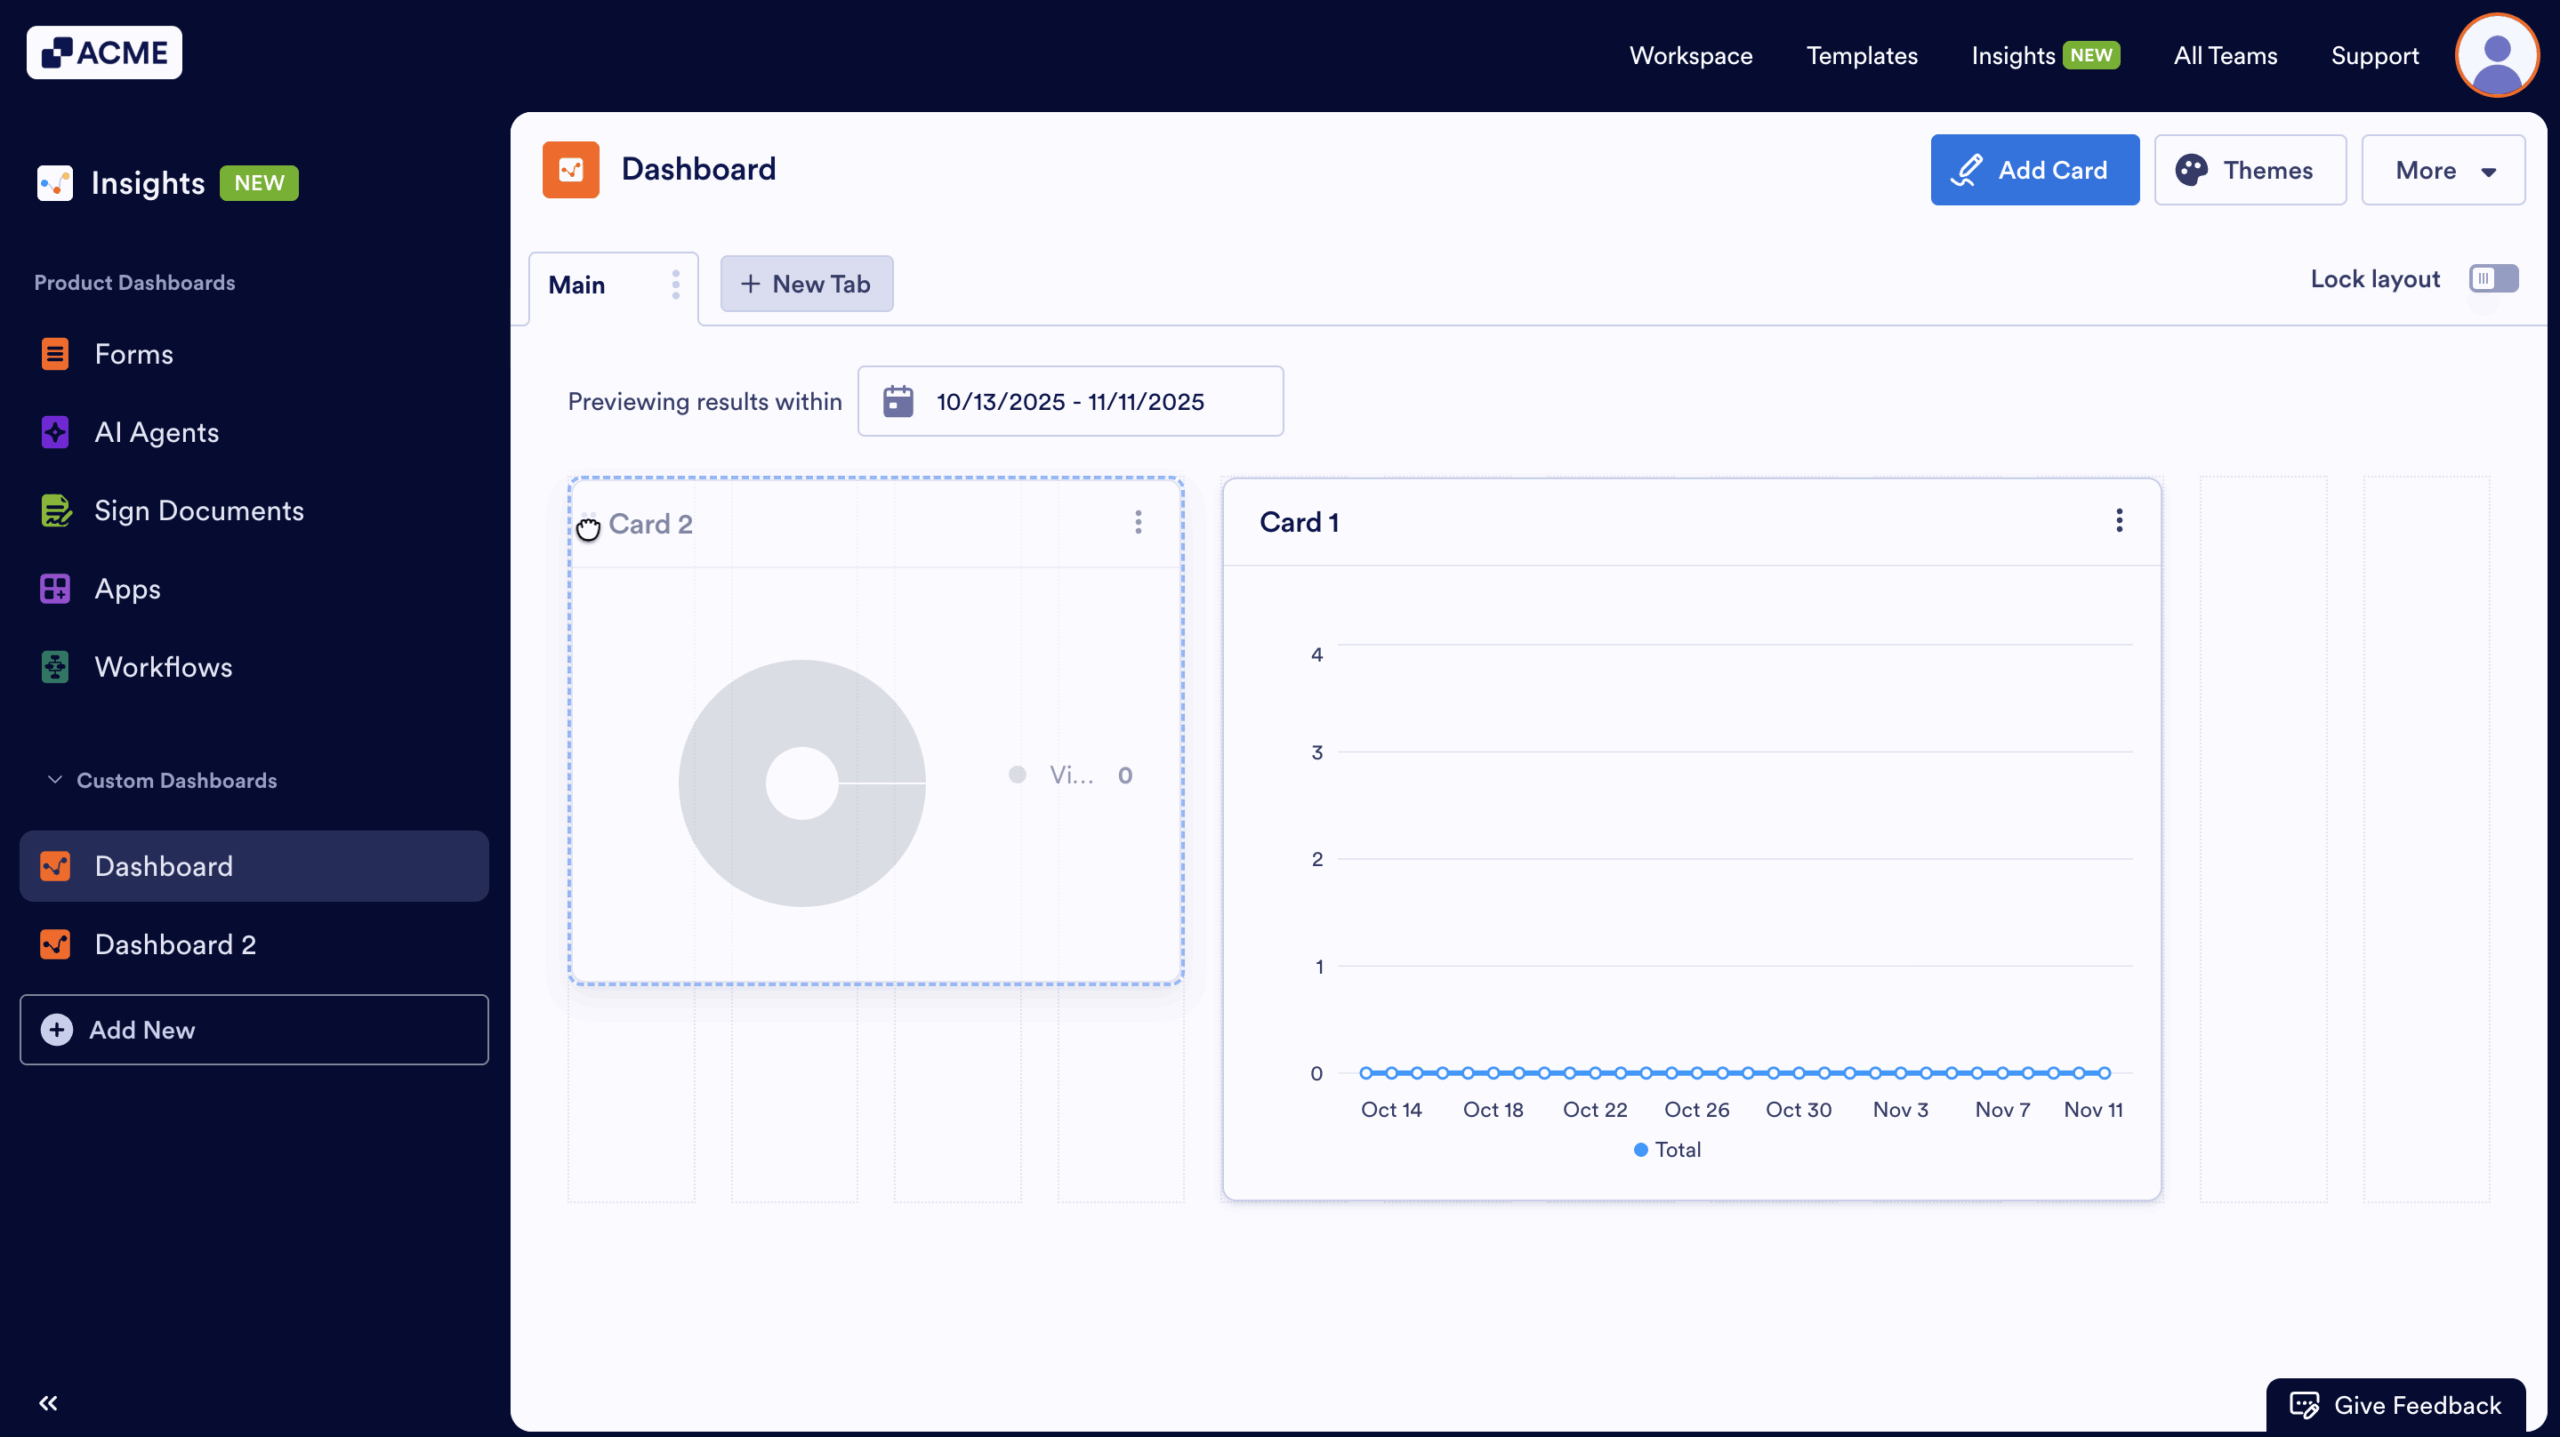
- Drag and drop the card to its new position
Tip
To prevent accidental layout changes, you can lock your dashboard. See How to Lock Your Custom Dashboard in Insights?.
Deleting a Card
If you no longer need a card or a data set, you can delete it from the Dashboard. This is a permanent action and cannot be undone. Let’s go through the process of removing cards:
- Click on the three-dot menu in the upper right-hand corner of the card you’d like to delete.
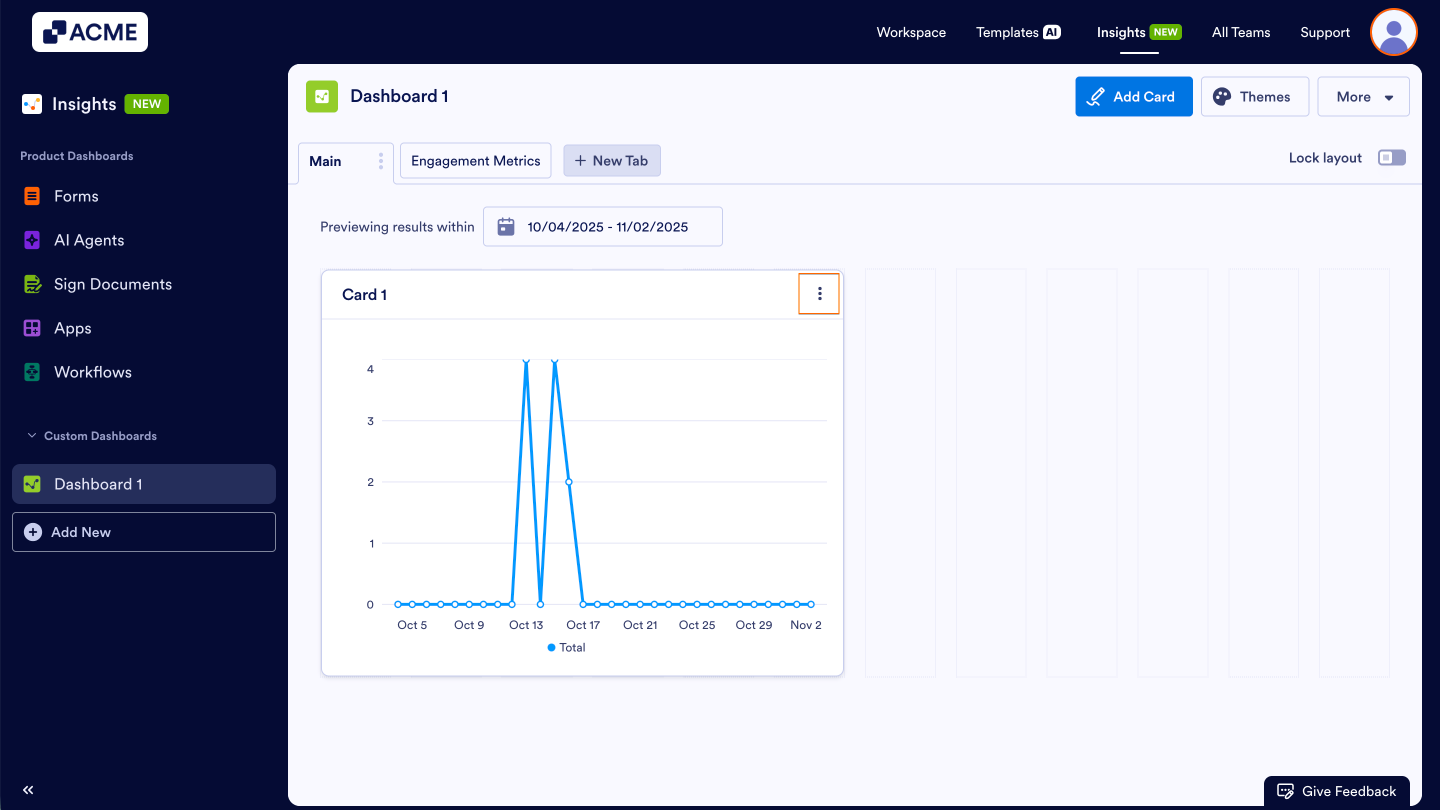
- Then, select Delete from the drop-down menu

- Finally, click Delete in the pop-up window.
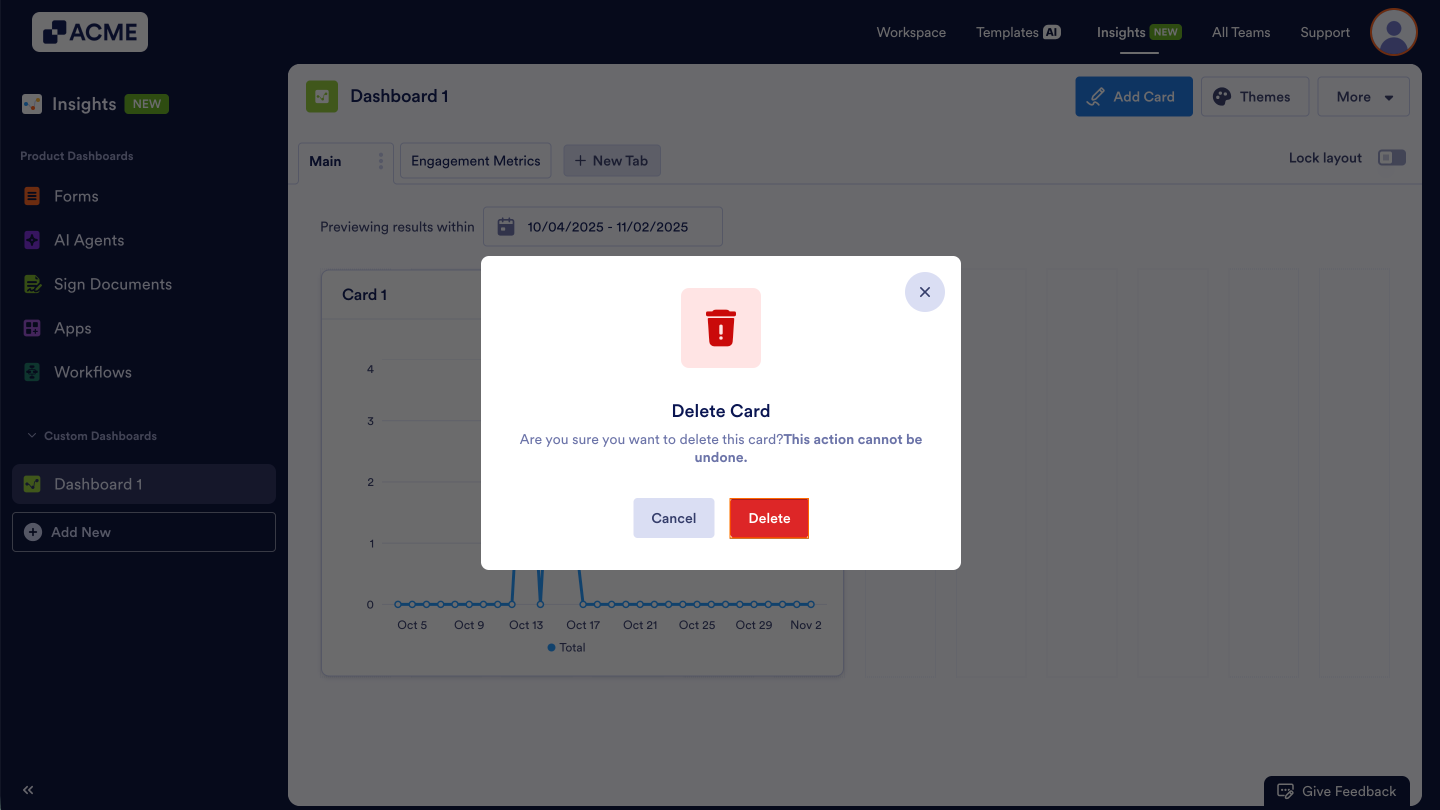
Once deleted, the card and its data visualization are permanently removed from the dashboard.

Send Comment: