Visual Report Filters in Jotform Visual Reports are powerful tools that allow you to customize and interact with your data in real time. These filters allow you to easily sort, group, and focus on specific insights without modifying the original dataset. Whether you’re analyzing submission trends or highlighting key information, Visual Filters make it simple to explore your data and present it in a clear, meaningful way.

Filtering Entries by Search In
You can filter your report data by different categories, including whether they are Unread, Read, Starred, or Unstarred. To filter using Search In.
- In Visual Report Builder, click Filter next to the search bar on the upper-left side of the page.

- In the Filter box that opens, click on Search In to open the dropdown menu, then select your preferred option and click on Apply Filter.
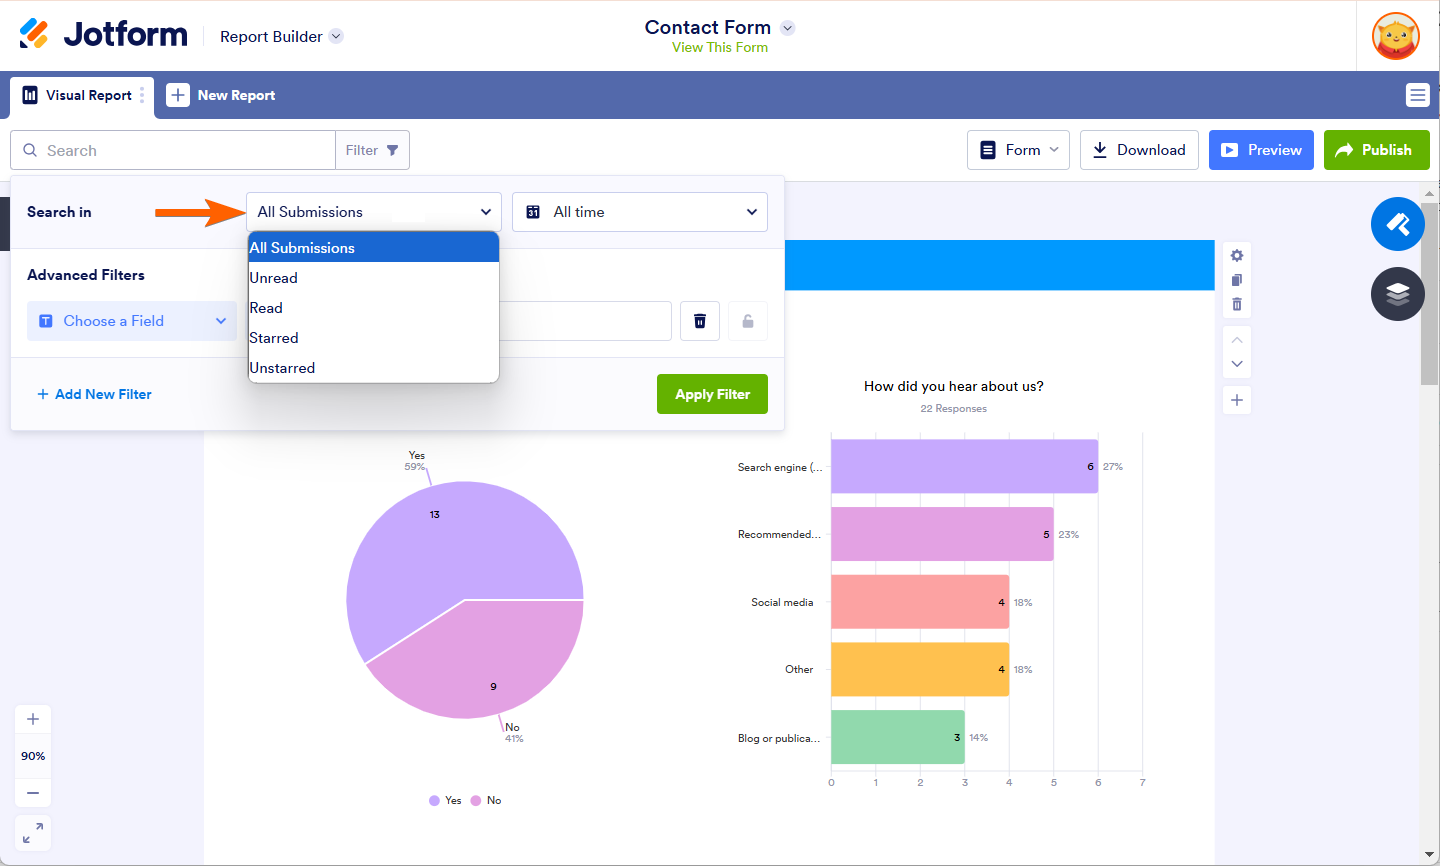
Here are the available Search In filters:
- All Submissions — This option shows all the form submissions regardless of their status.
- Unread — This filter shows only the submissions you have not read yet.
- Read — This filter shows the form submissions that you have already read.
- Starred —The Starred filter displays all submissions you have marked with a star.
- Unstarred — The Unstarred filter will display only the submissions that do not have a star.
Filtering Entries by Submission Date
If you need to view reports on your form sent on specific dates, you can filter them by Submission Date:
- In the Filter box, click on All Time. You can choose your desired range in the date picker. You can use the presets on the right or choose custom dates using the calendar.
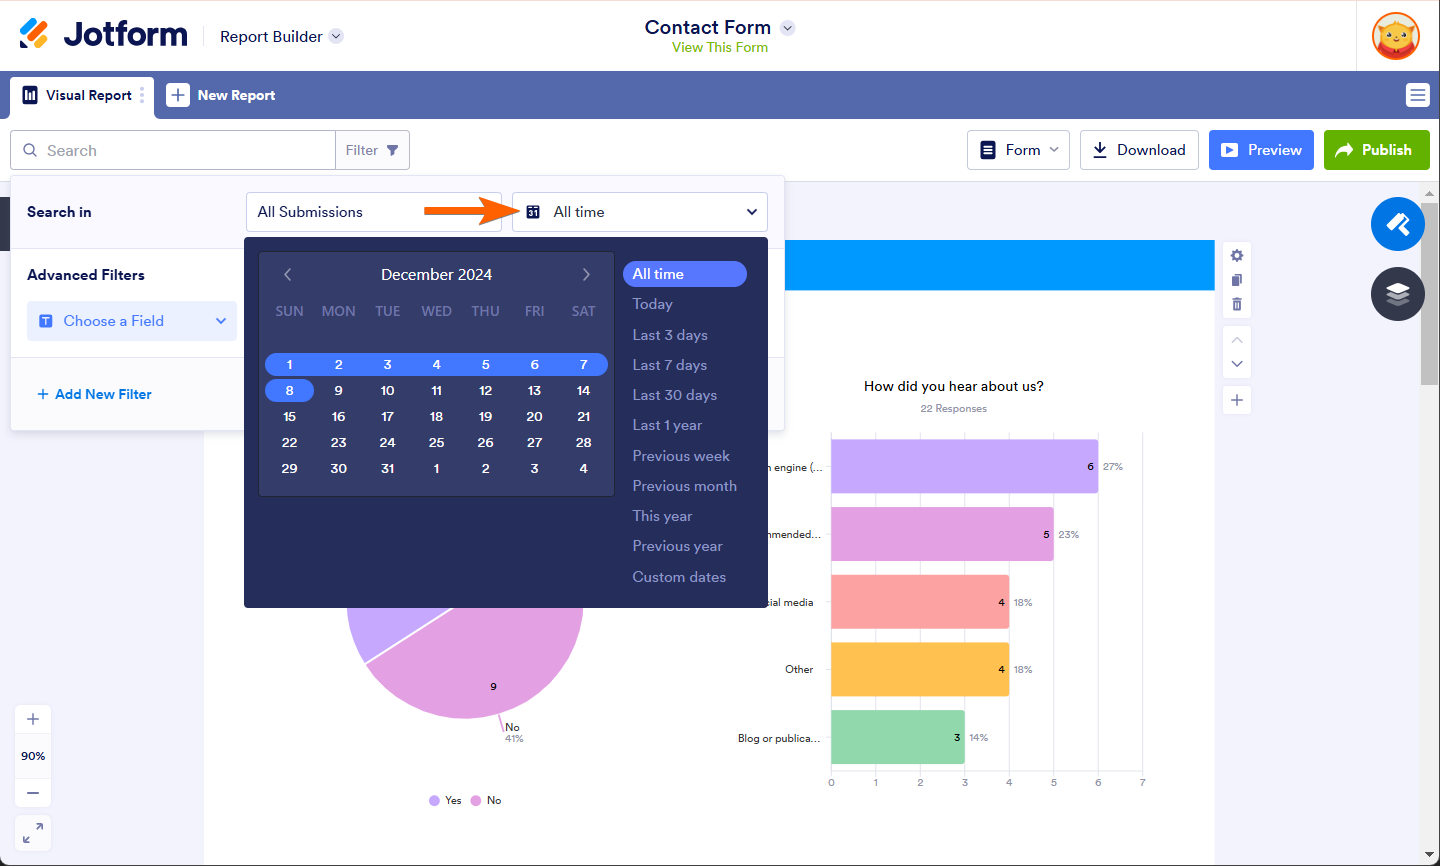
- Click anywhere outside the Date Filter box, then select Apply Filter.
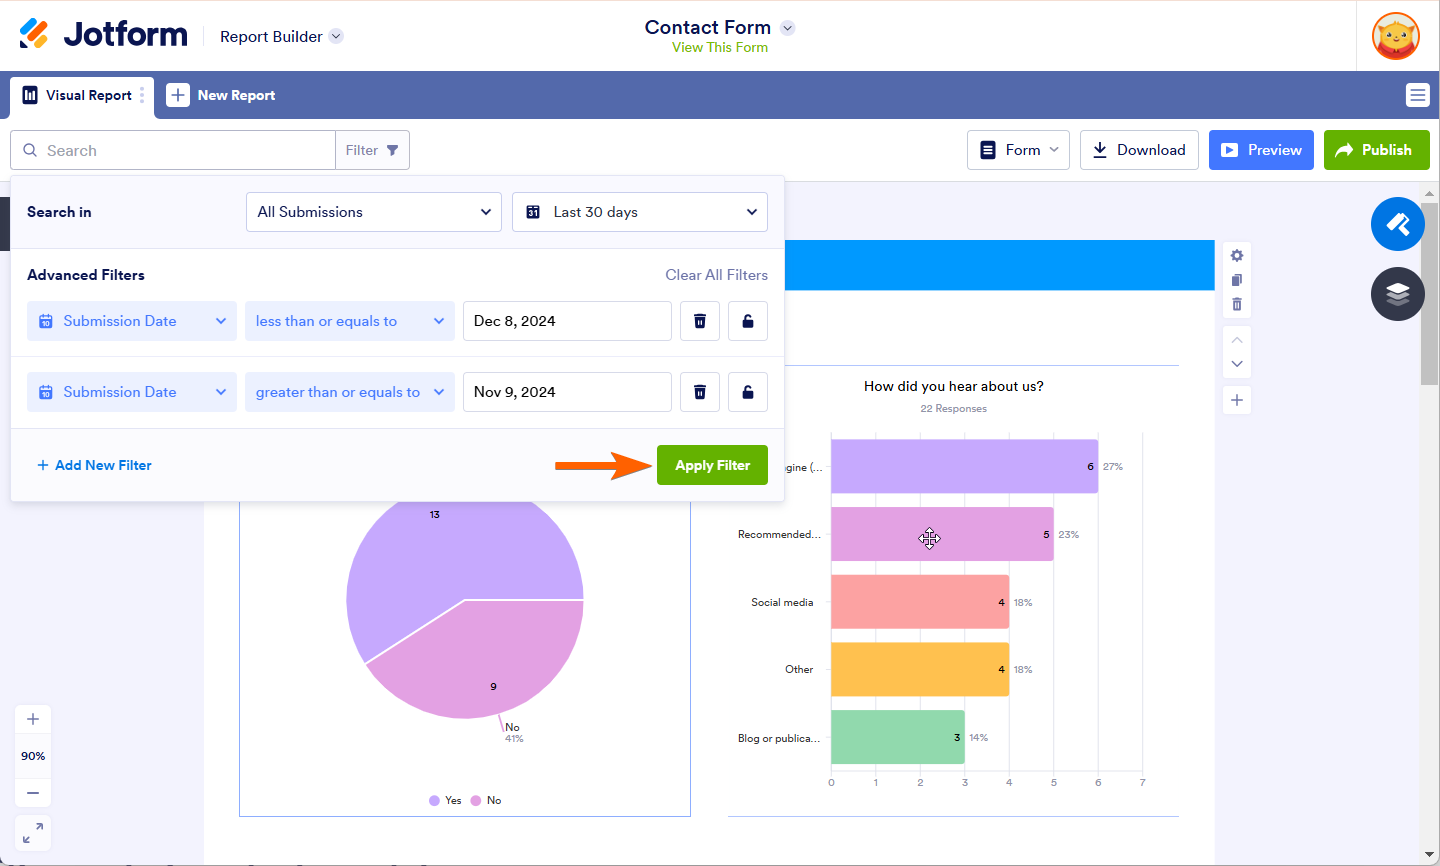
Filtering Entries by Advanced Filters
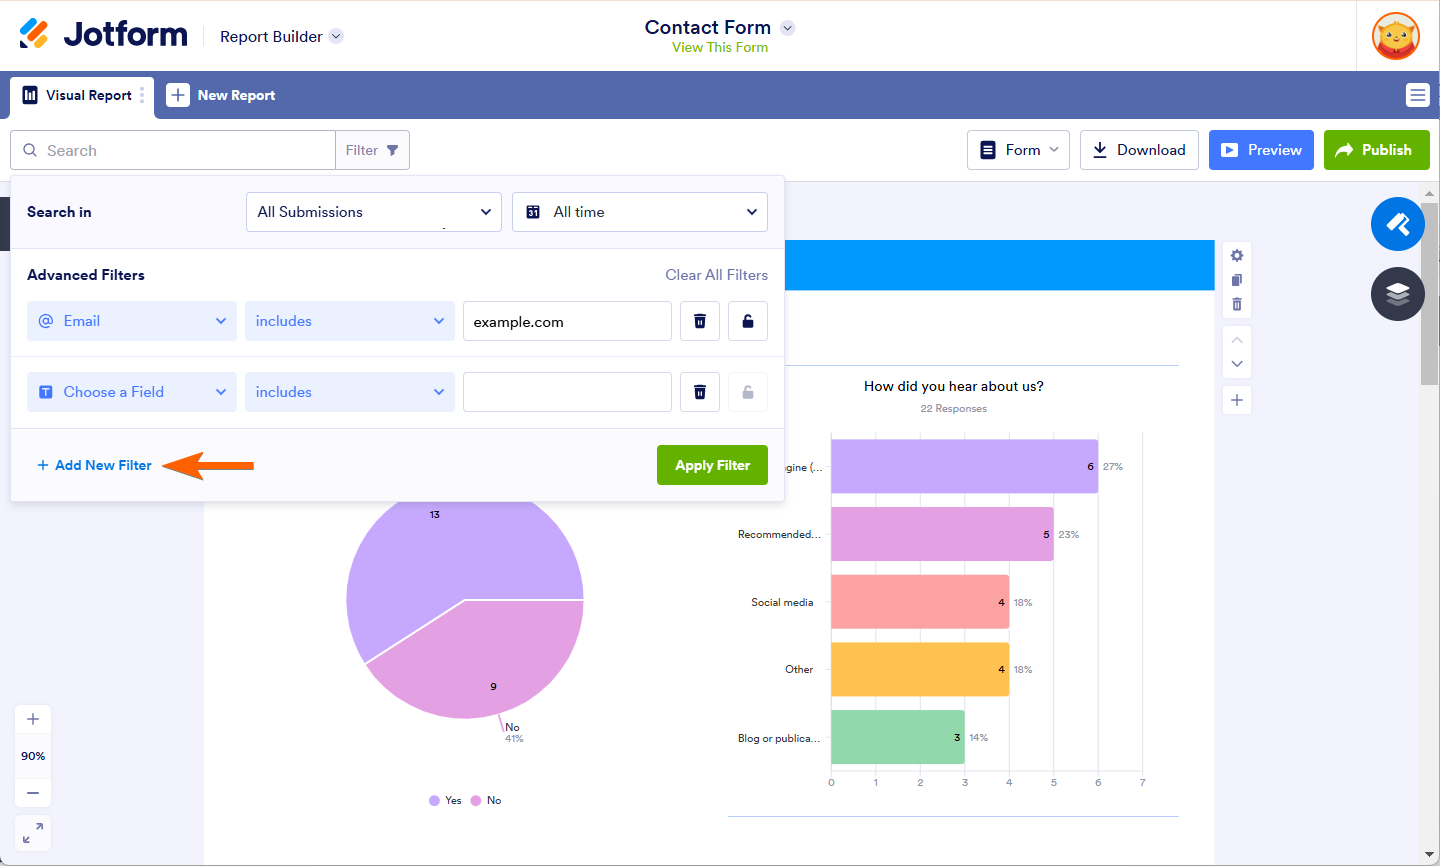
You can use the Advanced Filters option if you need to filter out any specific fields from your visual reports.
- In the Filter box under Advanced Filters, you can set a condition to a field you want to filter.
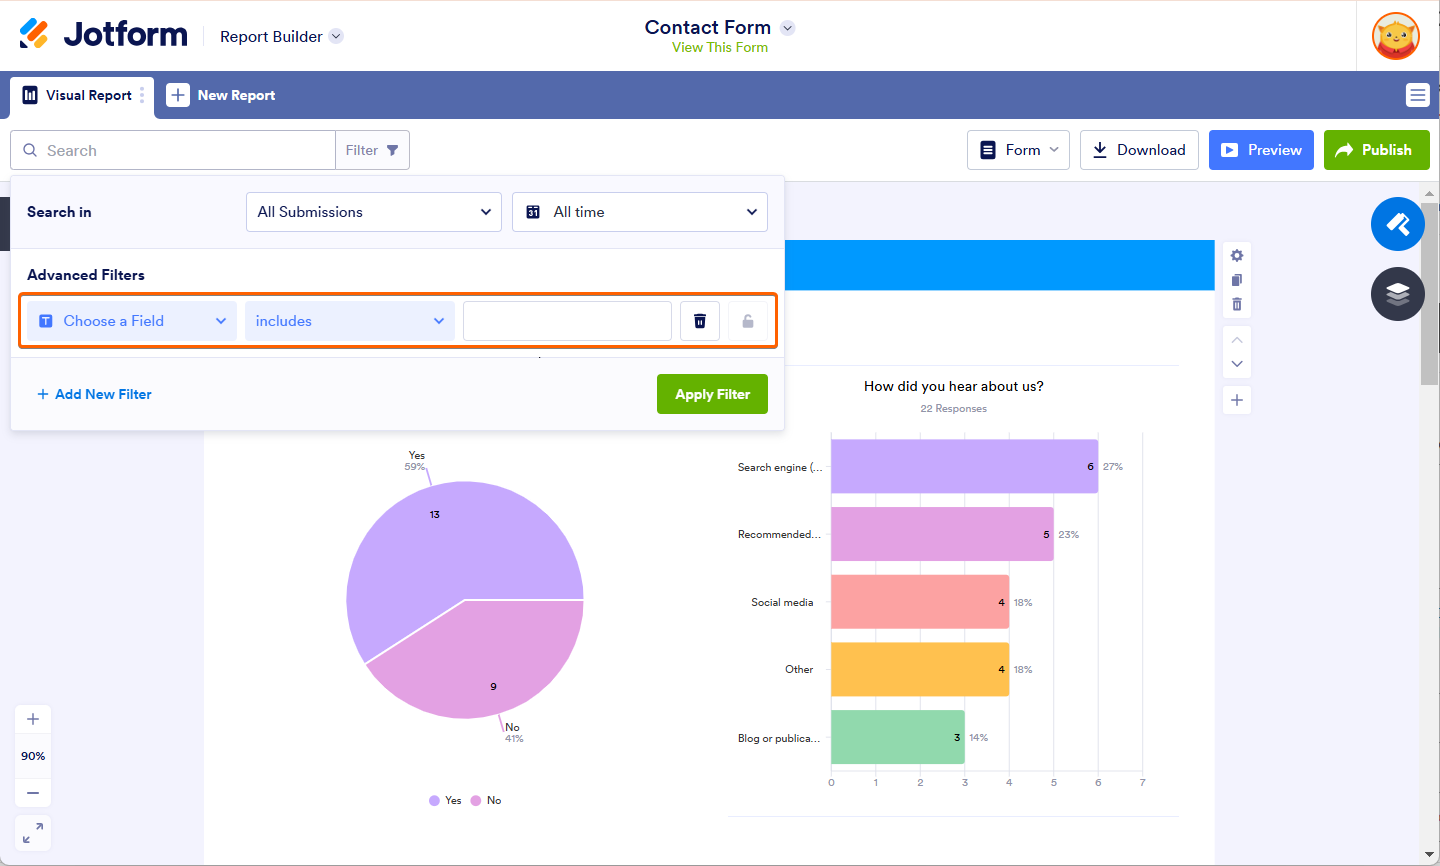
- Click on Add New Filter so you can add another Filter condition.
Note
- When creating a filter, you can choose field statuses such as includes, equals, not equal to, less than, less or equals, greater than, and greater or equals. Keep in mind that the available statuses depend on the type of field you’re filtering.
- Any Advanced Search or Filter left empty will be automatically removed when you close the settings. Similarly, completed filters that are not applied will also be removed. Make sure to click the Apply Filter button to save your filters.
Editing and Removing Filters
You can edit your existing filters by opening Filter. To remove filters, select the remove icon next to the Filter button.


Send Comment:
1 Comment:
More than a year ago
As I read over this it appears there is no current month date range setting. Is this correct?