Whether you’re running a small business or a large organization, seeing your results in an easy-to-understand report is essential. Jotform not only gives you the ability to collect data from people but also allows you to view it in a variety of ways. These reports are handy when you want to see the latest updates from your users in one place.
Jotform offers several form reports that you can use, which are described in the detailed guides below:
Some form reports allow password protection to ensure that your Submission Data is safe and will only be shared with your peers. With Jotform reports, you can
- view an overview of your submissions.
- manage who can access your submissions.
- manage the data that can be seen.
- access your submissions from any location with an internet connection.
- create as many reports as you need.
- modify your report with ease or remove it completely.
To create a report
- Go to My Forms and choose your form.
- Open Reports at the top, then select Add New Report.
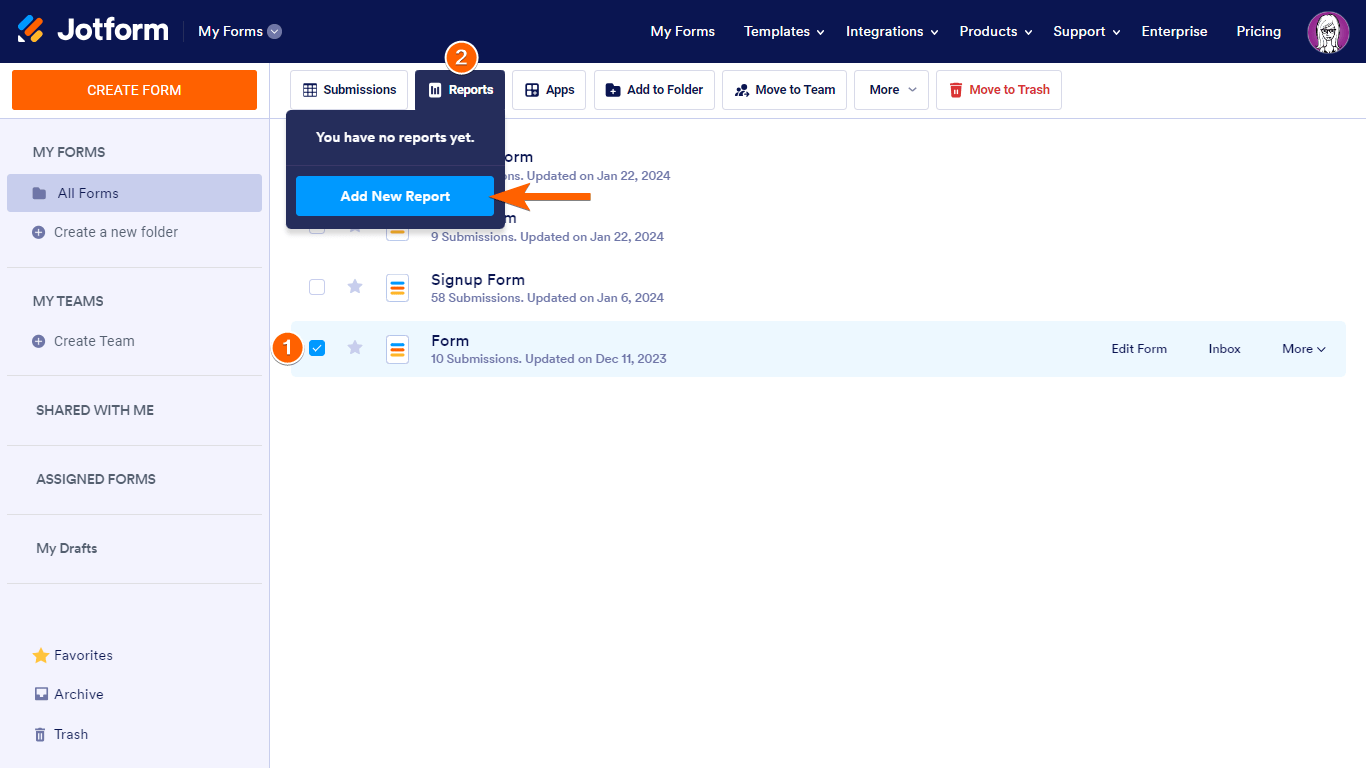
This will bring up a list of all the possible report options for your form.

Visual Report
A staple for many, Visual Report is the most customizable and offers a variety of visual options. It allows you to take the parts of your form’s submissions to create a graphical representation of data with charts, tables, grids, and more (e.g., Basic Chart, Donut Chart, Pie Chart, Column Chart, Bar Chart, Line Chart, Text Grid).
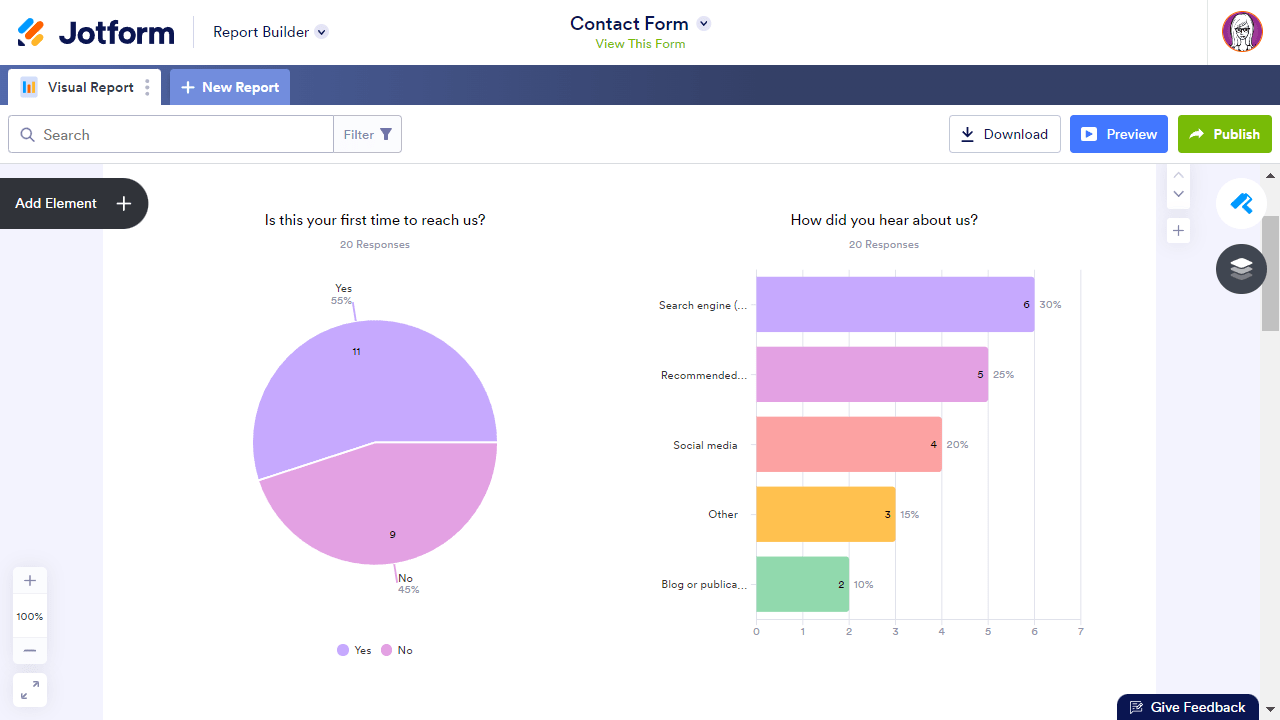
This type of report is created using the Jotform Report Builder. Whether you would like to gauge performance, keep track of your company’s growth, analyze sales activity, or interpret survey results easily, the Visual Report offers an efficient way of creating visually appealing and presentation-ready reports that you can keep for your record or use on your next meeting presentation.
Jotform Report Builder also automatically creates slides of your visual report, which can be downloaded or shared with your colleagues.
See How to Create Visual Report with Form Submissions to learn more.
Excel Report
You may be familiar with the option to export data to Excel in Jotform Tables. The benefit of using Excel Report is it allows you to easily choose the data or columns to include in the report. The generated report can be opened with any compatible application including Google Spreadsheets, Microsoft Office, LibreCalc, and any other Excel alternative.
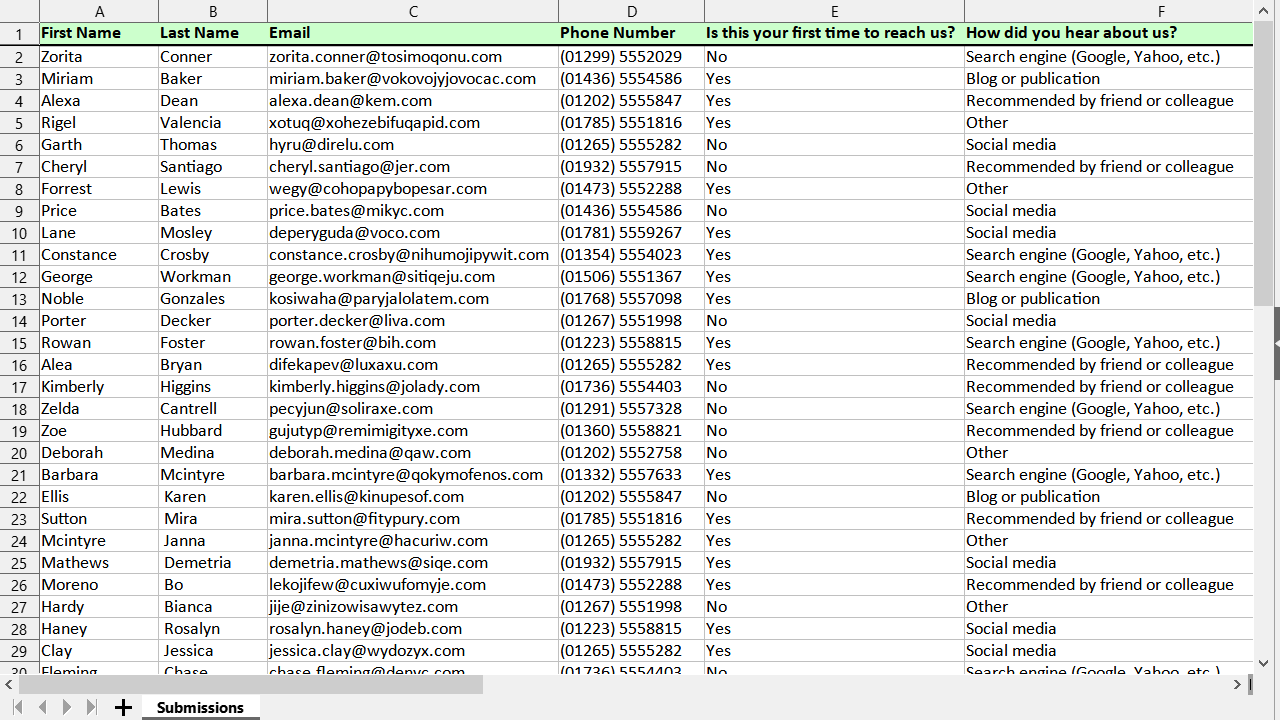
See How to Create an Excel Report for more information.
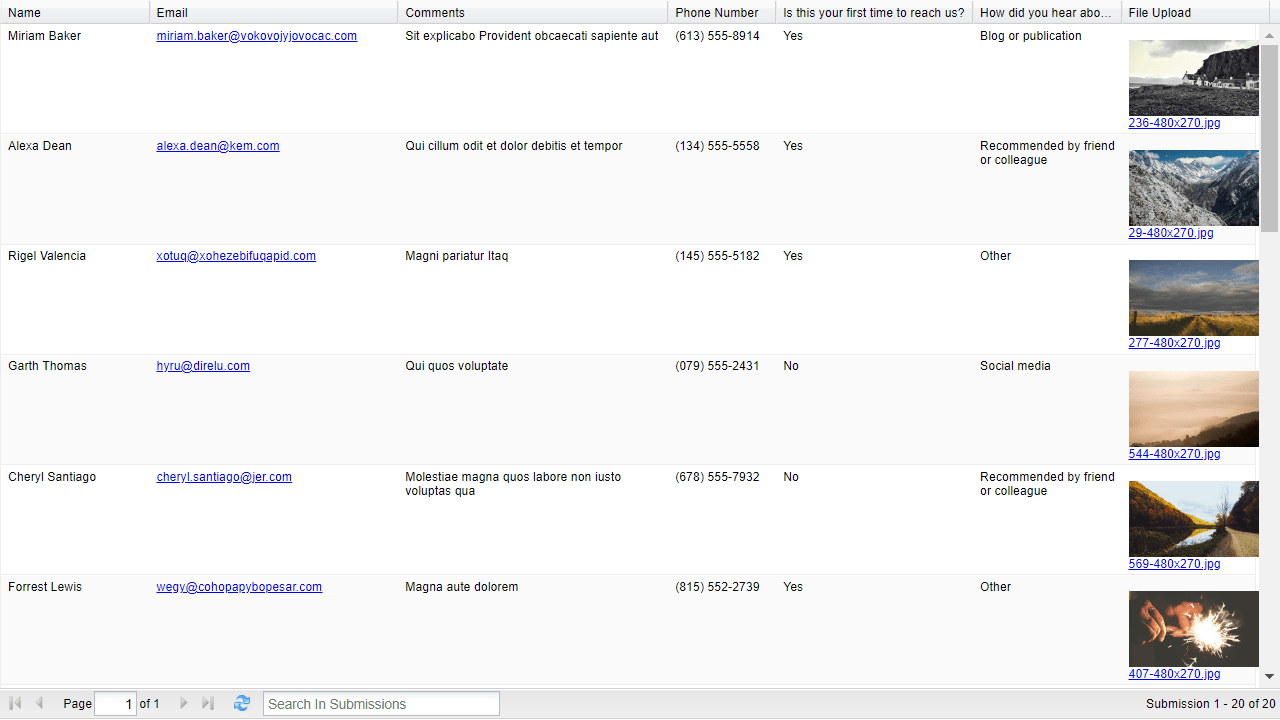
HTML Table Listing
The HTML Table Listing report will apply to users who want to share their submission data and present it as a table. It will allow you to quickly view all the form submissions online. You can sort them by columns by selecting the column name.
HTML Table Listing also displays thumbnails of photos that open with a larger preview when selected.
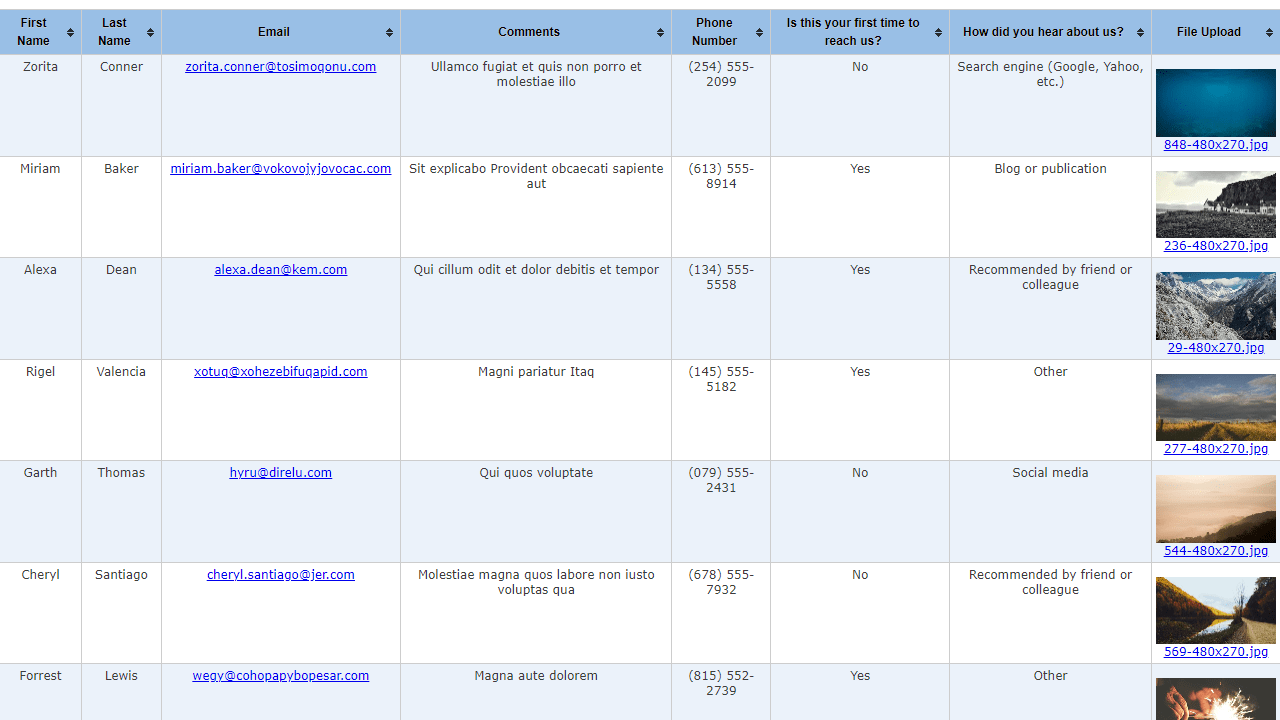
See How to Create an HTML Table Listing Report to learn more.
Grid Listing
Comes with a built-in search functionality, Grid Listing allows you to hide or show columns as you please to create a more flexible custom report.
The bottom bar includes some useful tools like a navigation bar, a refresh button, and a search bar. It also shows the number of displayed entries.
See How to Create a Grid Listing Report for more information.
CSV Report
CSV files are a common format for storing tabular data, such as spreadsheets or databases. They can be easily created and edited using any text editor and compatibility is a major advantage.

See How to Create a CSV Report to learn more.
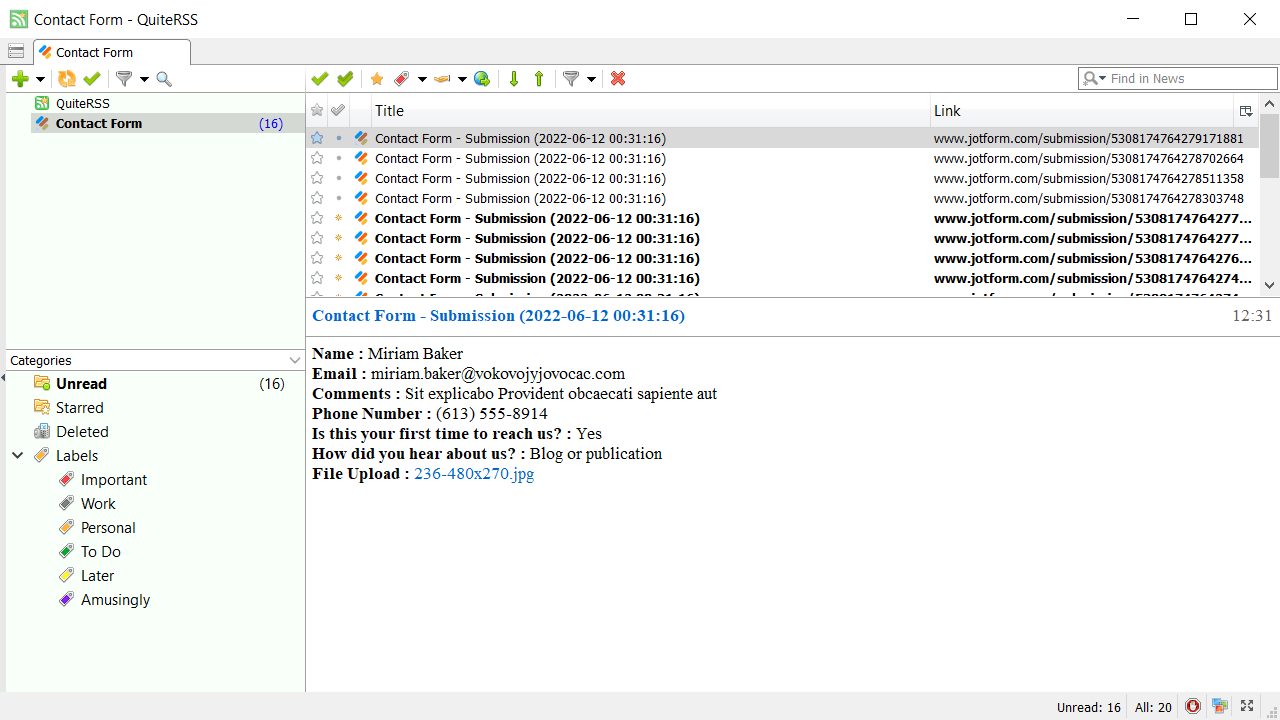
RSS Listing
If you’re familiar with RSS feeds, RSS Listing should work well with your favorite reader. On top of that, you can get notifications of new submissions right on your desktop or your app, just like how you get notifications about your favorite feed.
Here’s what an RSS feed would look like within a reader like QuiteRSS.
See How to Create an RSS Listing Report for more information.
Calendar Listing
Ideal for appointment scheduling, Calendar Listing allows you to easily view an overview of all your form submissions in a calendar format. This helps you quickly identify busy or available dates.
See How to Create a Calendar Report to learn more.

Send Comment:
10 Comments:
July 24, 2025
how to clone report to use for several cloned surveys?
June 25, 2025
I still need help. I don’t know which form should I use to report the progress of my apprentice to the State Board? Do you have any sample of whoever doing it?
May 5, 2025
how i should do if i dont want to get email when people summit form
March 1, 2025
can I auto calculate a sum of all of a specific field?
November 6, 2024
How to filter duplicate entries from report based on column score with highest value
October 30, 2023
How can I select a custom date range for a report? At this time, the report builder uses all of the surveys we have received over the last year, but I want to create reports that show a particular year or month. Thank you
February 10, 2023
How do I create a report per client automatically?
I know this has been asked, but I wanted to know if there's an update to do this now.
https://www.jotform.com/answers/4298619-how-do-i-create-a-report-per-client-automatically
December 14, 2022
How can I deselect certain individual survey responses so that they are not reflected in the report? For example, I have a survey with 15 responses. I want to generate a visual report for 14 of the responses. How do I do that without deleting that one response?
August 22, 2022
How do I create a report per client automatically.
I saw there is a filter option in the report. Need the same but automated.
I mean, I have the same form filled by the same client every month and want to mail them automatically all previos month's information.
But, don't want to let them see other clients information.
Thank you for your help!
August 22, 2022
How to combine forms into one report