Graphs and Charts Widget

Create website-ready charts from simple data

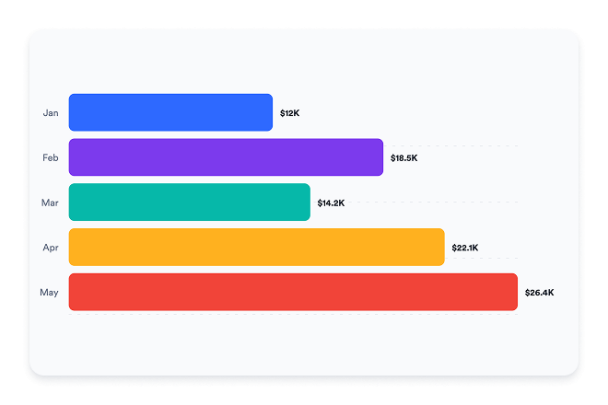
Build responsive chart embeds with editable data rows, multiple chart types, labels, legends, grid controls, and brand-friendly styling.

Create Your Graphs and Charts Widget - It's Free!
Create website-ready charts from simple data Hero Bg Image

How to embed Graphs and Charts Widget to WordPress

1Get your embed code

After customizing your Jotform website widget, click Try it on your website for free, and copy the generated embed code.

2Open the page editor

Go to the WordPress post or page where you want to display the widget, then add a new block.

3Add a Custom HTML block

Select Custom HTML and paste your Jotform Website widget embed code into the HTML field.

4Update and view

Click Update or Publish, then open the page to check your embedded widget.

Editable Data Rows

Paste labels, values, and optional colors into the widget settings. The renderer turns those rows into a clean chart immediately.

Data controls include:

LabelsValuesColorsPrefixesSuffixes
Add Your Data
Editable Data Rows

Seven Chart Types

Choose bar, column, line, area, pie, donut, or percent bar charts so each dataset can use the right visual structure.

Chart types include:

BarColumnLineAreaDonut
Choose a Chart
Seven Chart Types

Readable Labels and Legends

Toggle value labels, legends, grid lines, and rounded bars to help visitors understand the chart without extra explanation.

Display controls include:

LegendValue labelsGrid linesRounded barsResponsive SVG
Tune Display
Readable Labels and Legends

Brand-Friendly Styling

Switch between light and dark themes, adjust colors, keep Jotform branding visible, and add scoped custom CSS for advanced page-level styling.

Style controls include:

Light themeDark themeCustom colorsScoped CSSBranding toggle
Style Your Chart
Brand-Friendly Styling