Graphs and Charts Widget for your website
Present numbers clearly with responsive charts you can embed anywhere. Add data rows, choose a chart type, adjust colors and labels, and publish a polished visualization without custom code.
How to create a Graphs and Charts widget
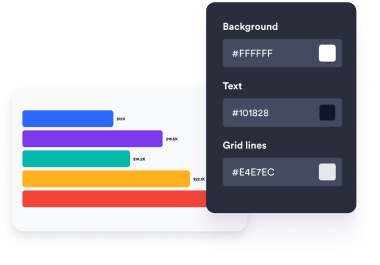
Add your data
Paste simple rows with labels, values, and optional colors to build your first chart.
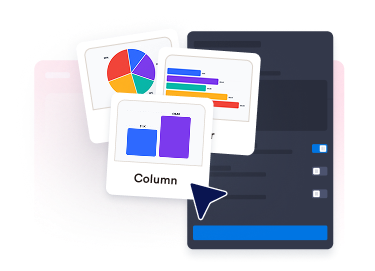
Choose the chart design
Switch between bar, column, line, area, pie, donut, and percent bar layouts, then tune labels, legend, grid lines, and colors.
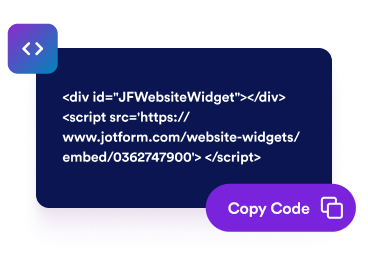
Embed it on your site
Preview the responsive widget, save your settings, and publish the generated embed on any page.
What makes Jotform Graphs and Charts special
Turn rows into clear visuals
Paste labels, values, and optional colors to create a chart from your own numbers. Use the widget for reports, dashboards, product comparisons, campaign summaries, and research snapshots.

Choose the right chart type
Switch between bar, column, line, area, pie, donut, and percent bar charts so the same dataset can fit a compact section, a broad report, or a quick comparison.

Control labels and readability
Show or hide legends, value labels, grid lines, and rounded bars to make chart details easier to scan on desktop and mobile pages.

Match your site design
Use light or dark themes, adjust background and text colors, choose an accent color, and add scoped custom CSS for page-specific polish.

Why Jotform Website Widgets stand out
Jotform’s widgets make your website more interactive and increase conversions. There are many tools available, from star ratings and testimonial sliders to social proof popups and media embeds. Add widgets to your forms or landing pages to collect data, display proof, and capture leads — no coding required.
Add Jotform widgets to your website with a simple embed code. Customize the widget, preview how it looks, and paste it into any page that supports custom HTML or embed blocks, all without a developer.
Use Jotform Website Widgets to collect leads, show customer feedback, display social proof, embed media, or add helpful web page tools. Each widget helps visitors interact with your business directly from your website.
If you need help setting up, customizing, embedding, or troubleshooting your widget, Jotform’s customer support team is available 24-7. You can move forward with confidence, knowing that help is there when you need it.
Where to use your Graphs and Charts widget
Use the widget anywhere visitors need a quick visual explanation of numeric information.
Business dashboards to summarize revenue, leads, growth, or team performance.
Research pages to turn survey results, study findings, or comparisons into readable visual summaries.
Marketing reports to show campaign performance, channel mix, or monthly trends.
Product pages to compare plan usage, savings, adoption, or feature distribution.
Education pages to present classroom, nonprofit, or community data in a visual format.
Internal portals to keep key metrics easy to scan without building a full analytics dashboard.
Convert leads into paying customers with the Jotform Form Builder
Turn engagement into action with Jotform. Create powerful forms that capture leads, collect payments, and automate responses, all in one place. Every submission lands in your Jotform Inbox, where you can follow up or connect with your favorite apps.
Get Started — It’s Free!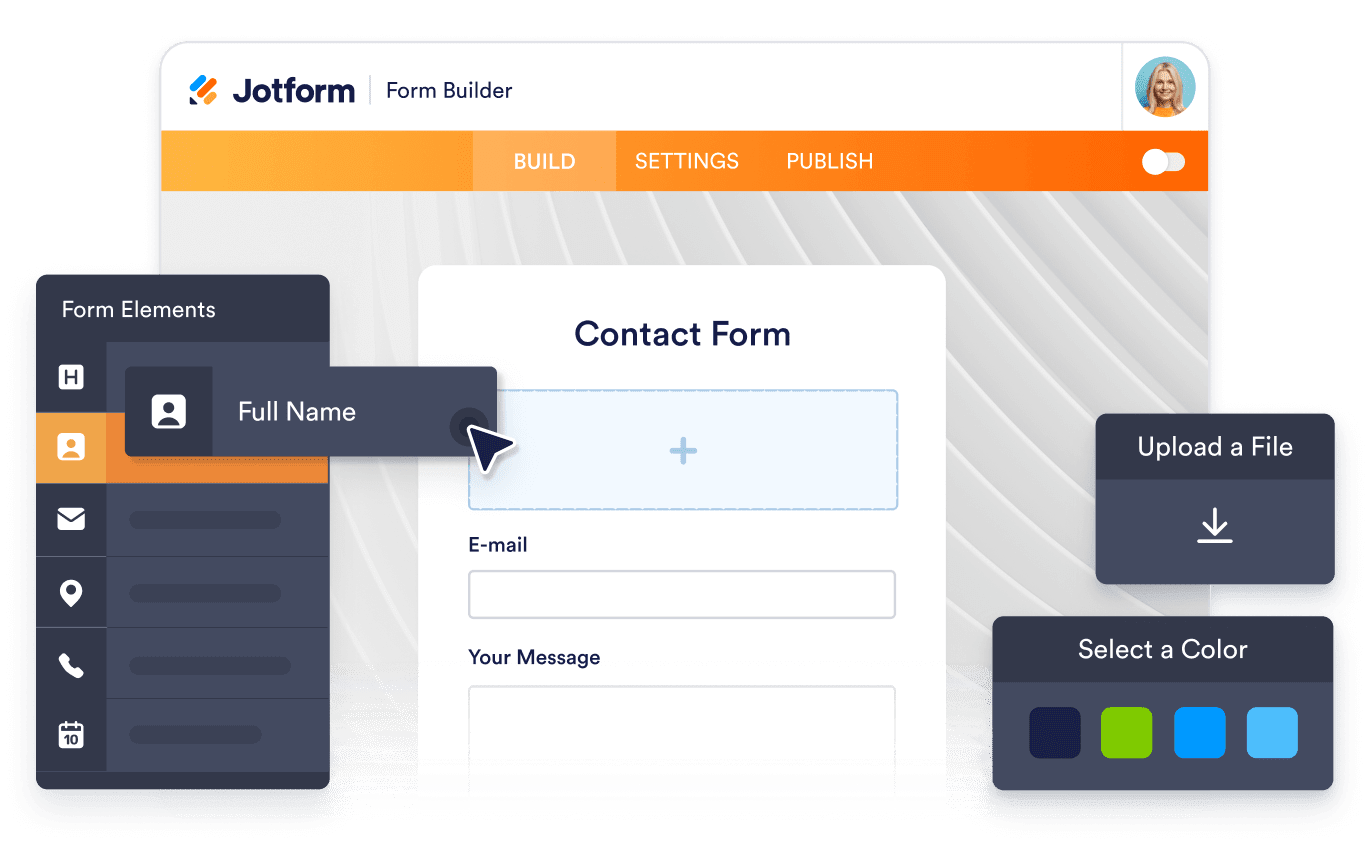
FAQ
How do I set up the graphs and charts?
Create and customize your widget in Jotform, then copy the embed code. Paste it into your website and publish.
Can I customize the design?
Do I need coding skills?
Does the widget work on mobile devices?
Can I update the widget after embedding it?
Why should I add a graphs and charts to my website?
Is the widget free?
Can I use it with Jotform forms and workflows?