Jotform’s Graphs and Charts Widget makes it easy to present information in a clear, engaging, and visually appealing way. Whether you’re sharing business metrics, survey results, sales figures, or other important data, the widget helps visitors understand it all at a glance.
Choose from different chart types, customize the layout and design, and tailor the widget’s appearance to your website. In this guide, you’ll learn how to configure the widget and add it to your website.
Creating Your Graphs and Charts Widget and Getting the Embed Code
Before you can add the Graphs and Charts Widget to your website, you’ll first need to enter your data, customize the chart, and copy the embed code for it. Here’s how to do it:
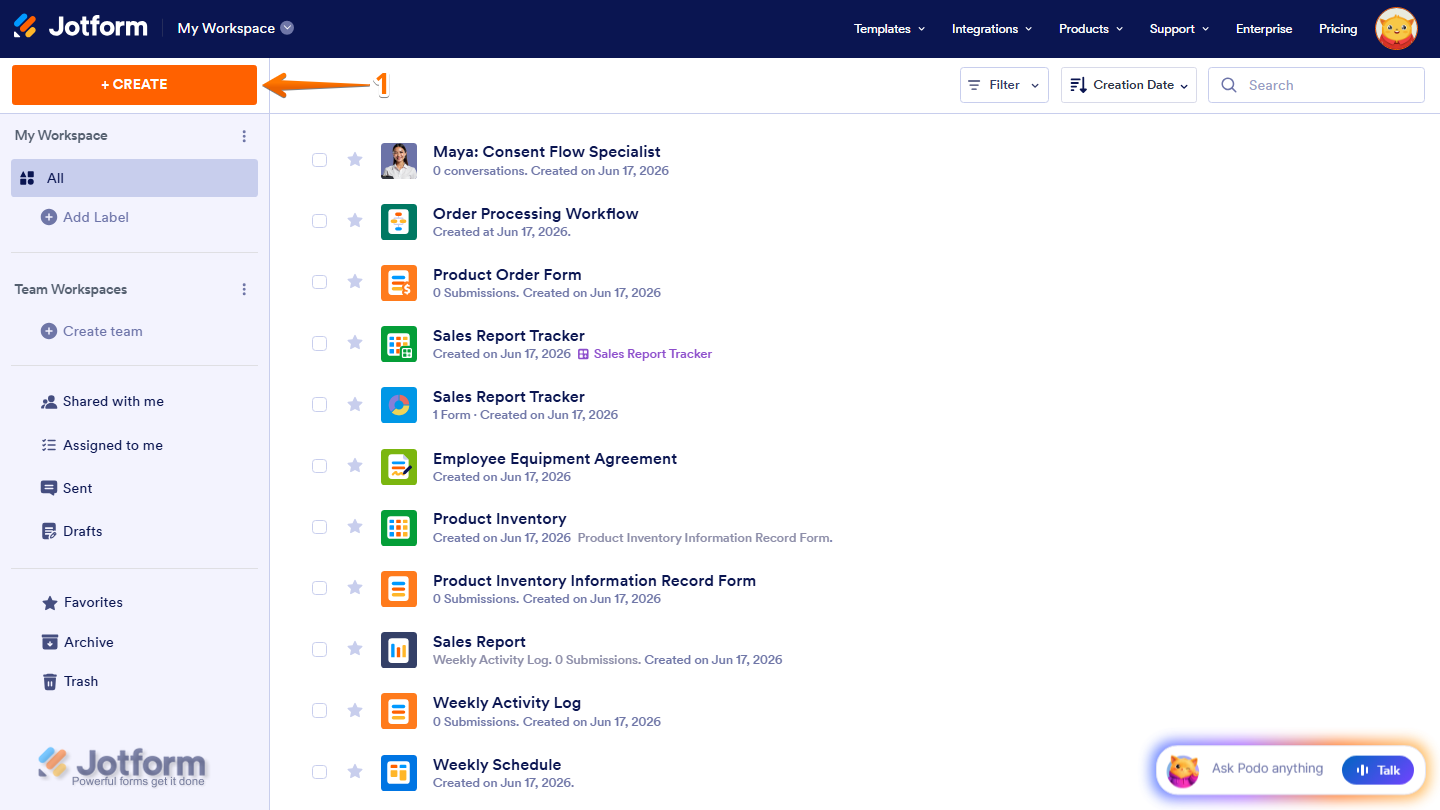
- On the top-left side of your Workspace page, click on Create.
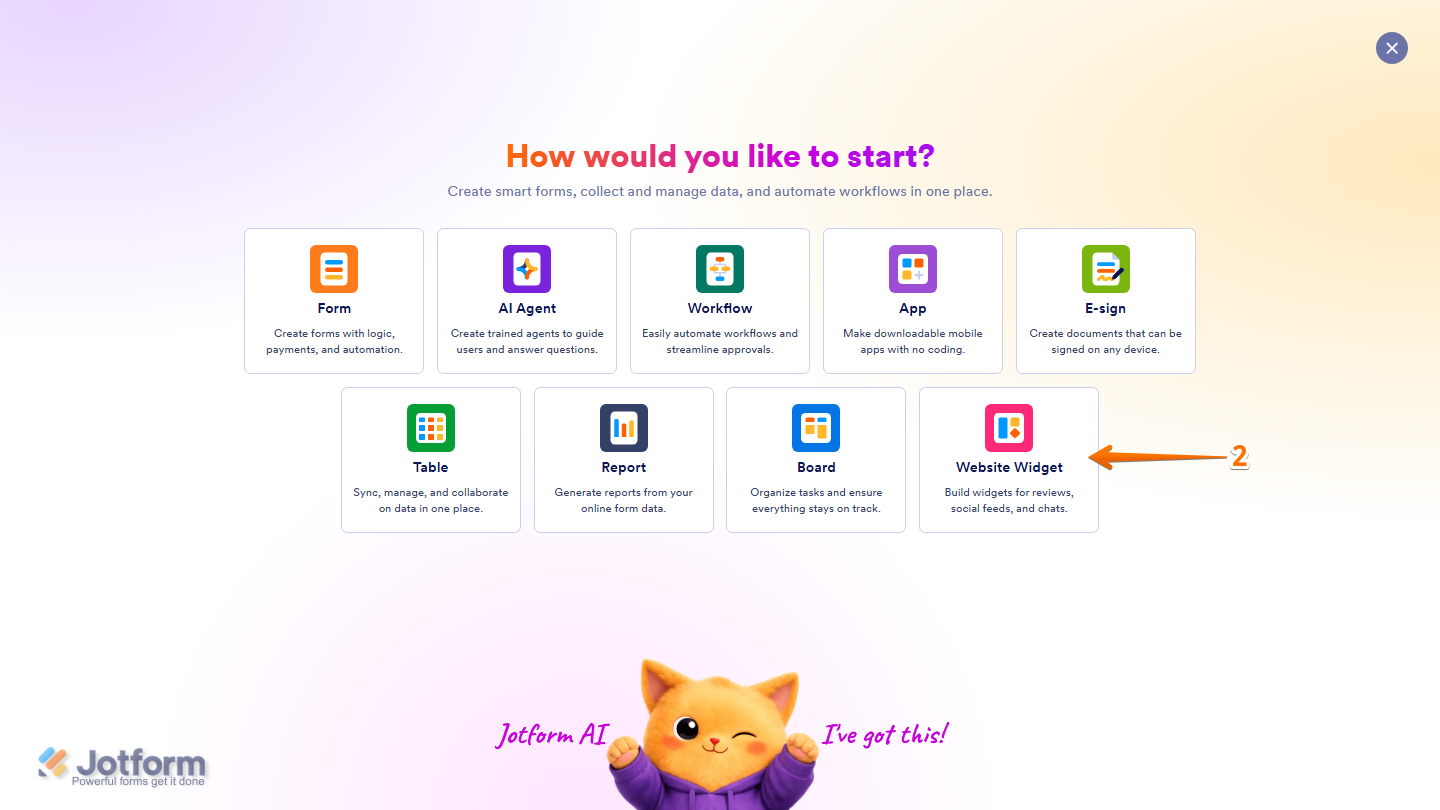
- In the menu that opens up, click on Website Widget.
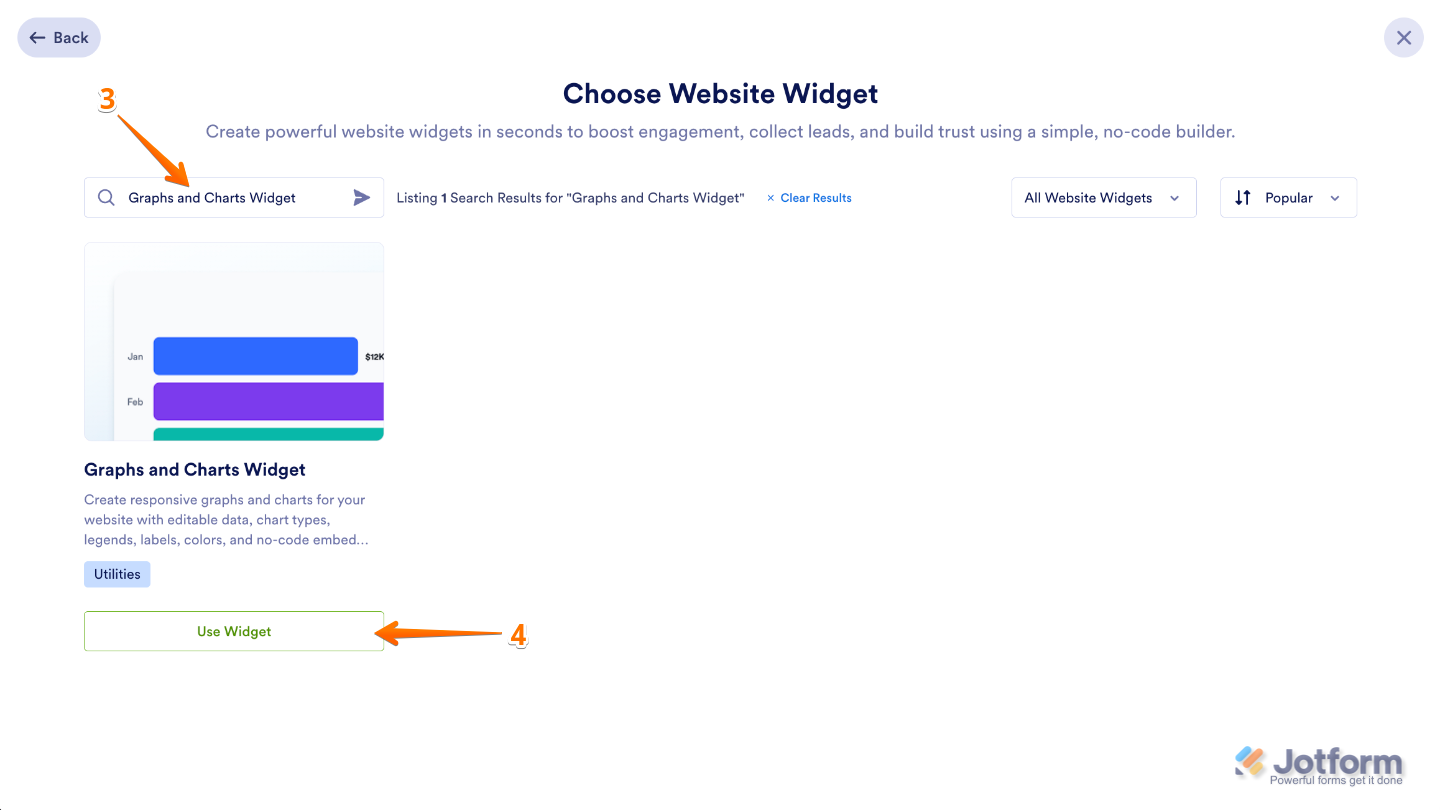
- Next, in the Search bar in the upper-left corner of the Choose Website Widget window, enter Graphs and Charts.
- Then, in the search results, click on Use Widget.
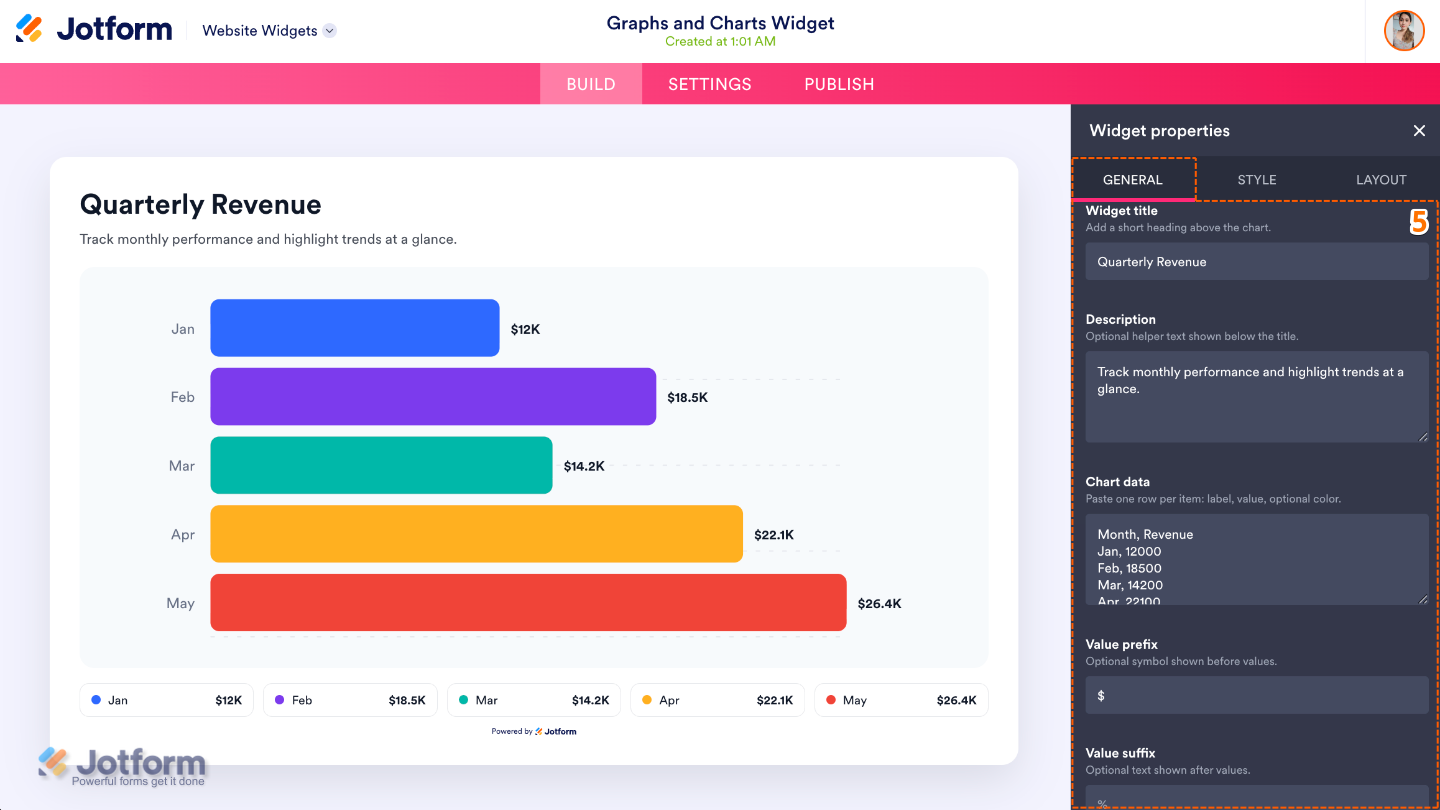
- Now, on the right side of the Website Widget page, in the Widget Properties menu, configure these options:
- Widget Title — Add a title to describe what your chart represents and give visitors helpful context.
- Description — Include a short description to explain your data or give additional info about the chart.
- Chart Data — Enter or edit the data that’ll be displayed in your graph or chart.
- Value Prefix — Add text or symbols before each value, such as a currency symbol ($) or other identifier.
- Value Suffix — Add text or symbols after each value, such as %, kg, or hrs, to indicate units or measurements.
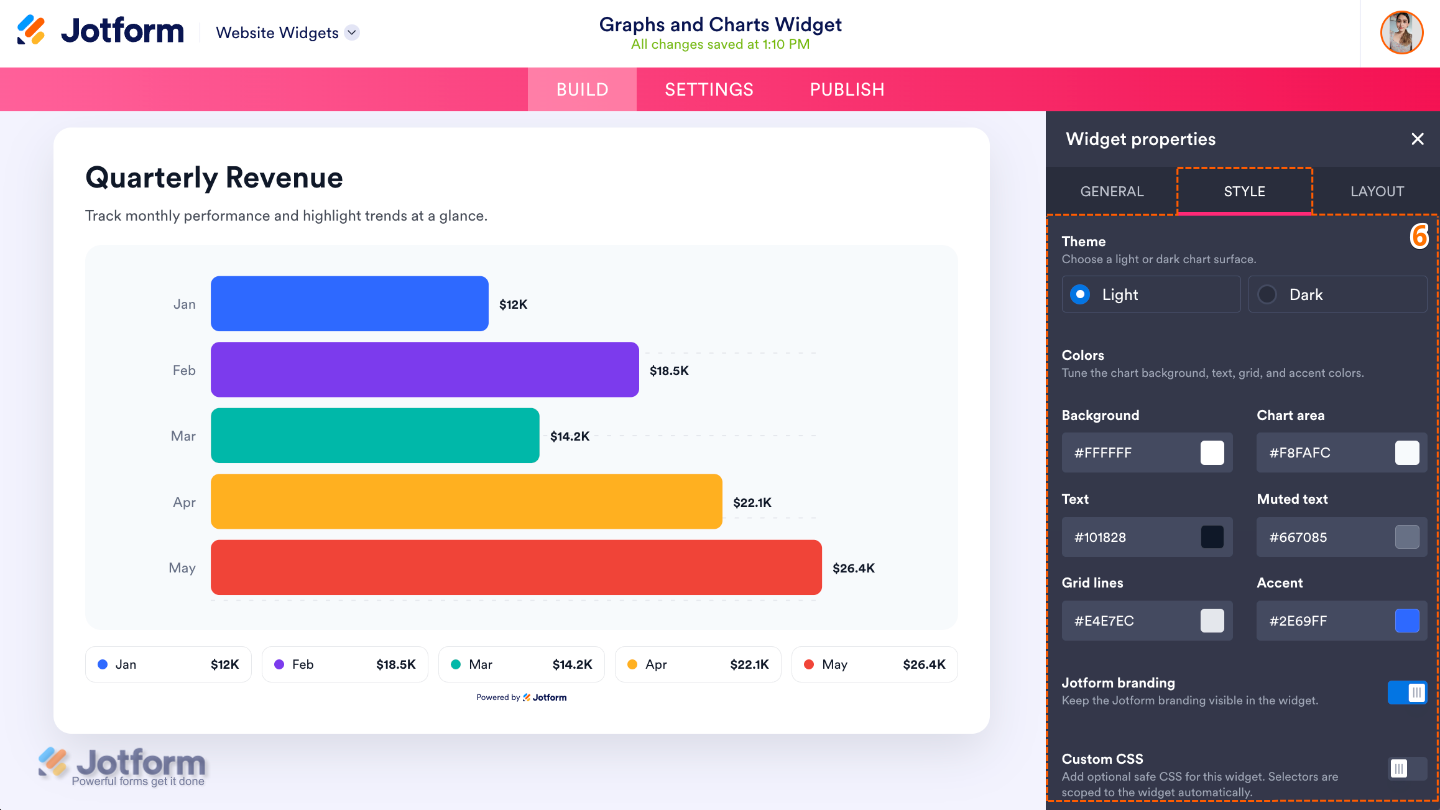
- Then, click on the Styles tab and manage the following options:
- Theme — Choose a pre-designed theme to quickly change the overall look and feel of your chart.
- Colors
- Background — Choose a background color for the widget.
- Chart Area — Select a background color for the chart area.
- Text — Pick a primary text color to use throughout the widget.
- Muted Text — Set a color for secondary text, such as labels or supporting info.
- Grid Lines — Set the color of the grid lines to improve readability or better match your website’s design.
- Accent — Choose a primary color to use for chart elements like bars, lines, or chart highlights.
- Jotform Branding — Show or hide Jotform branding on the widget.
- Custom CSS — Apply your own CSS codes for advanced styling beyond the built-in settings.
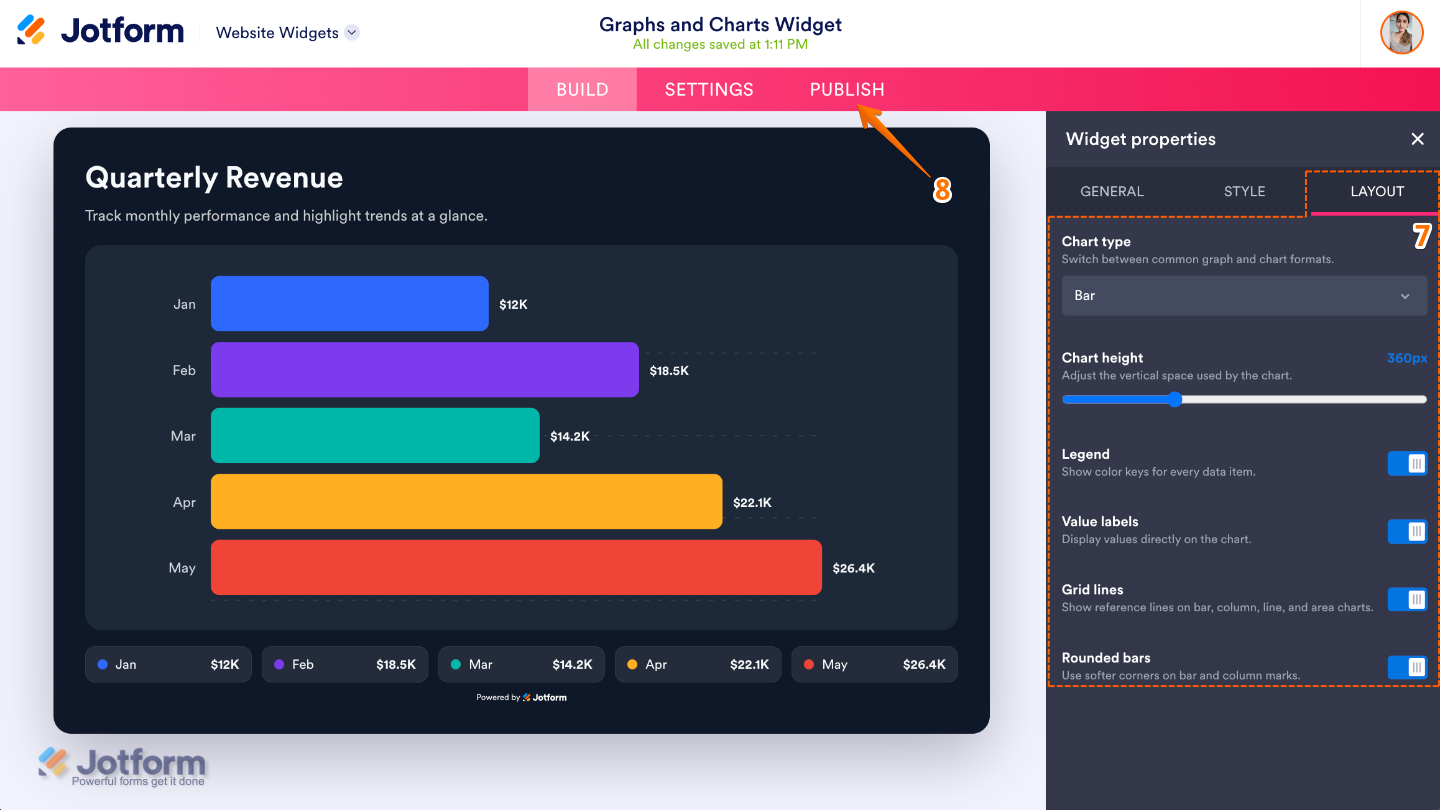
- Next, click on the Layout tab and configure these options:
- Chart Type — Select the type of chart you want to display, such as a bar, line, pie, or other supported chart.
- Chart Height — Adjust the height of the chart to fit your website’s layout.
- Legend — Show or hide the chart legend that identifies each data series or category.
- Value Labels — Display or hide the values directly on the chart for better readability.
- Grid Lines — Show or hide the grid lines to make chart values easier to compare.
- Rounded Bars — Round the corners of bar charts for a softer, more modern appearance.
- Once you’ve finished configuring the widget, in the pink navigation bar on the top of the page, click on Publish.
Note
You’ll be asked to log in to your Jotform account, if you’re not already, or sign up for one. Once you’ve done that, you’ll be able to get the embed code for your widget.
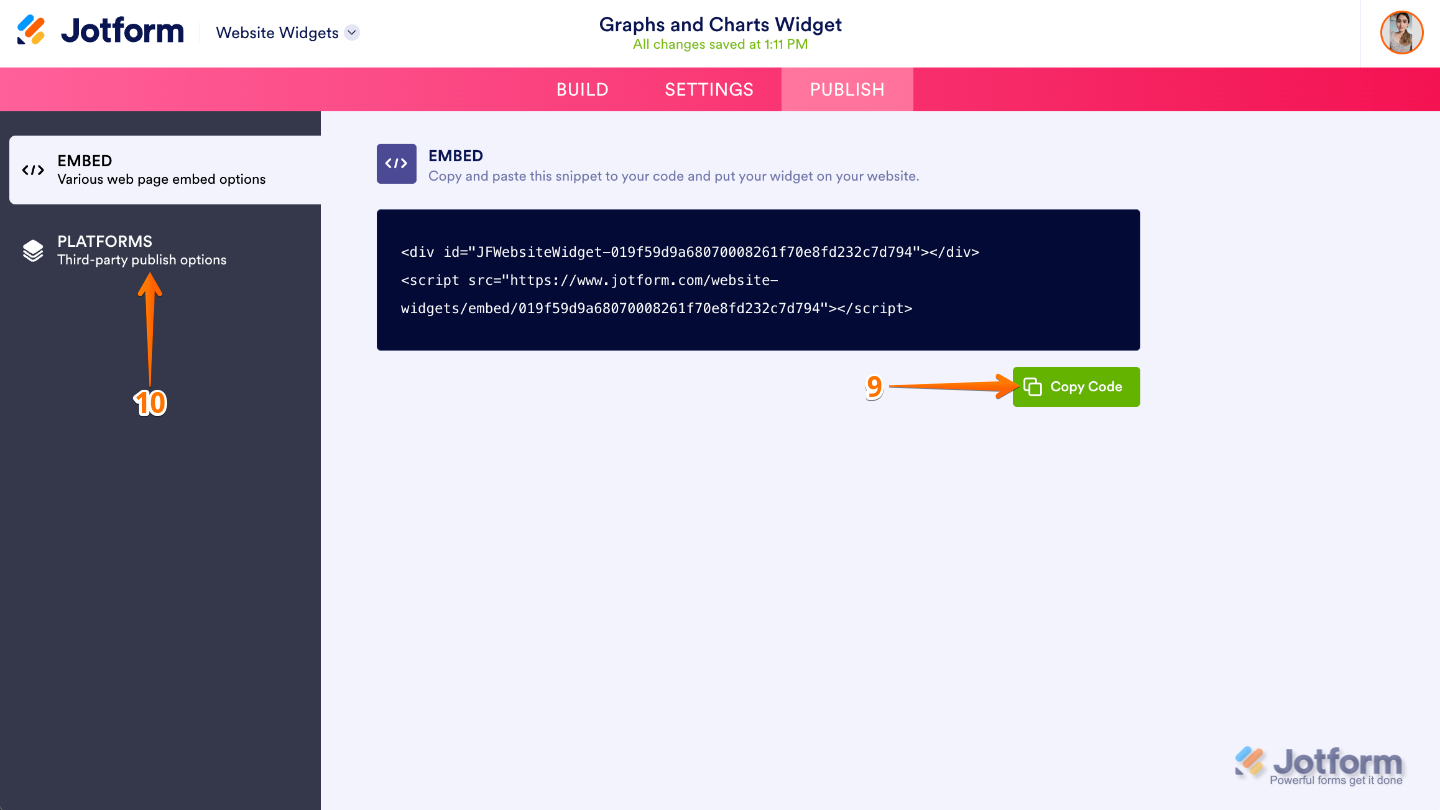
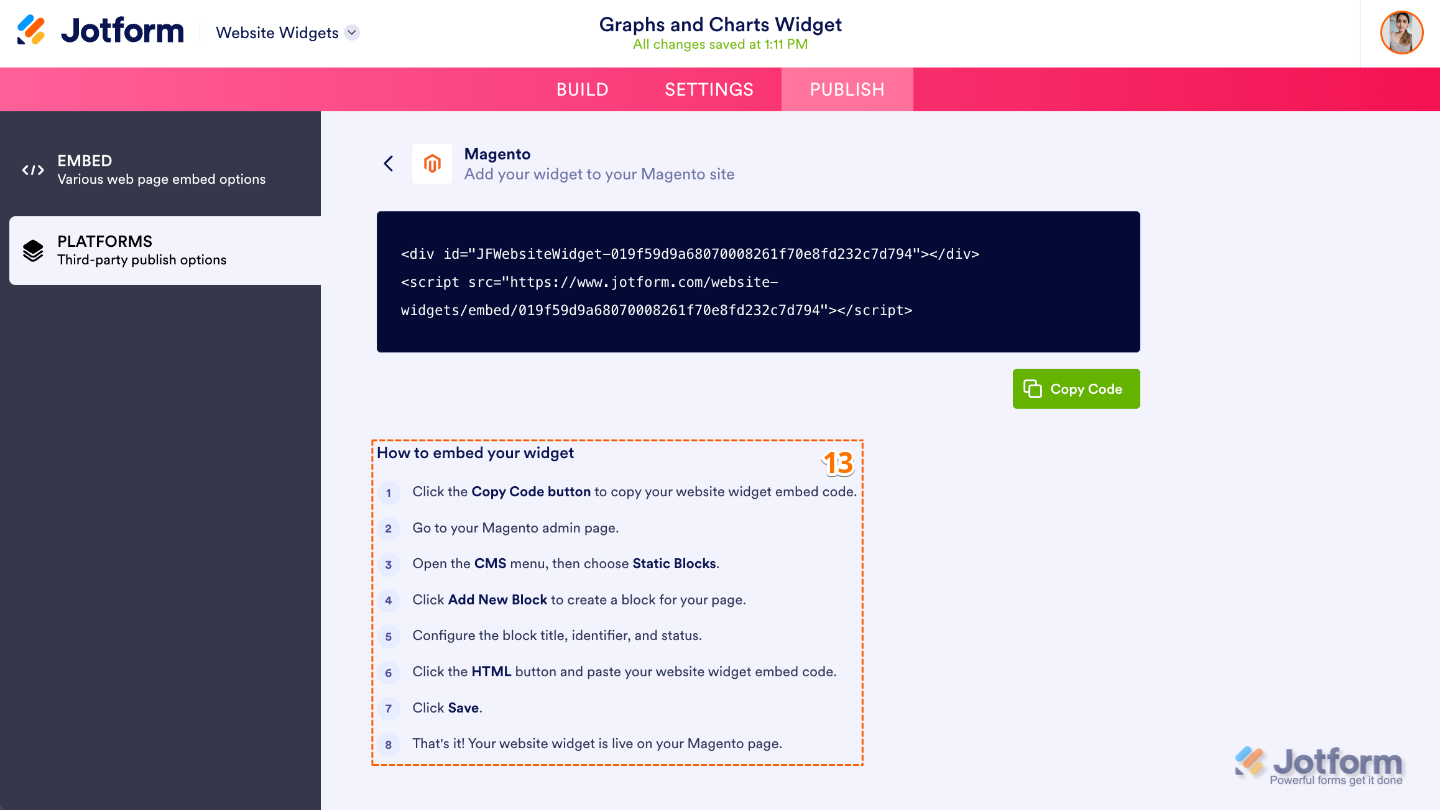
- Then, in the Embed section, click on Copy Code.
- Or, if your website is built on a supported platform, click on Platforms in the menu on the left.
- Next, in the Search bar at the top of the Platforms page, search for the platform you use for your website.
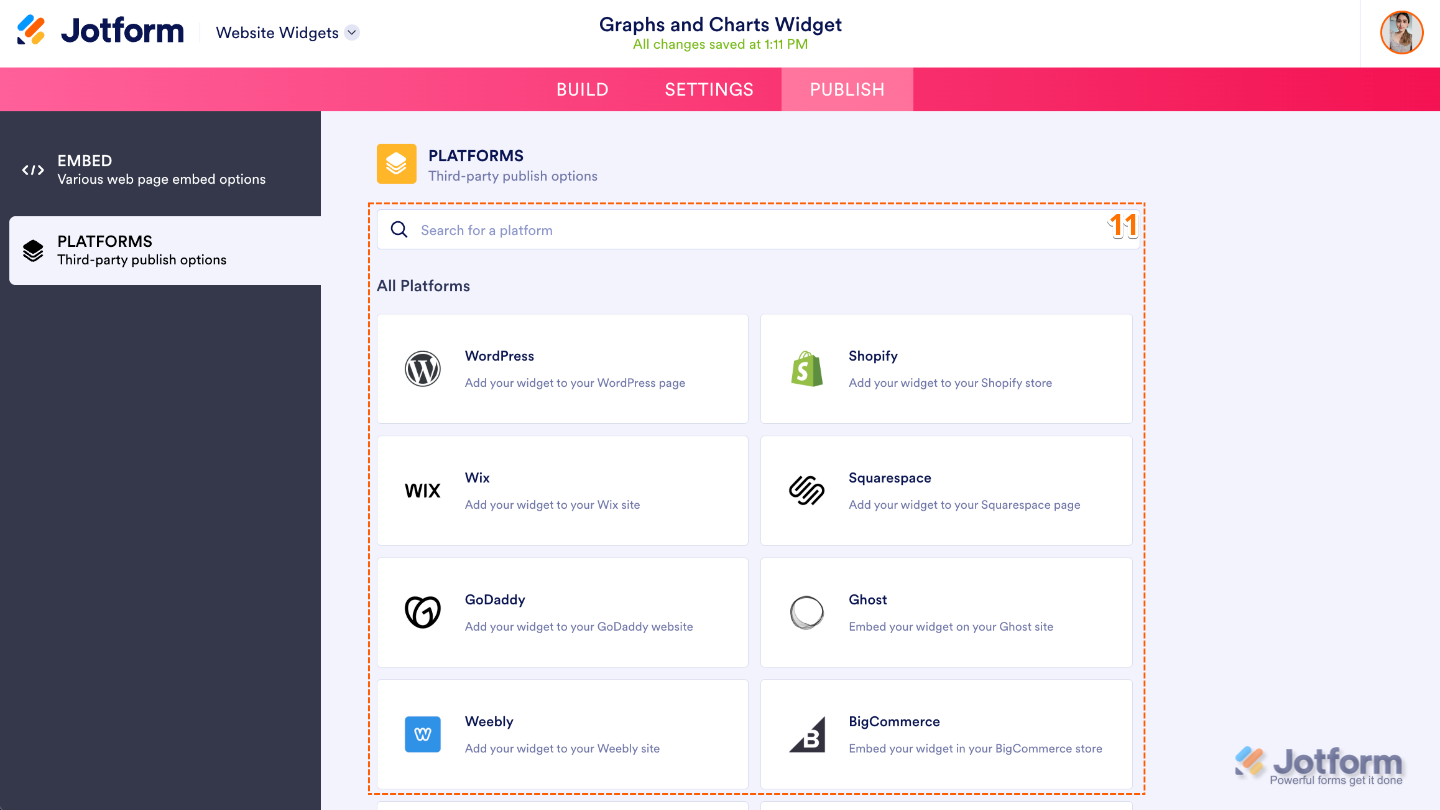
- For this example, let’s use the Magento platform. In Platforms, search for Magento and click on it.
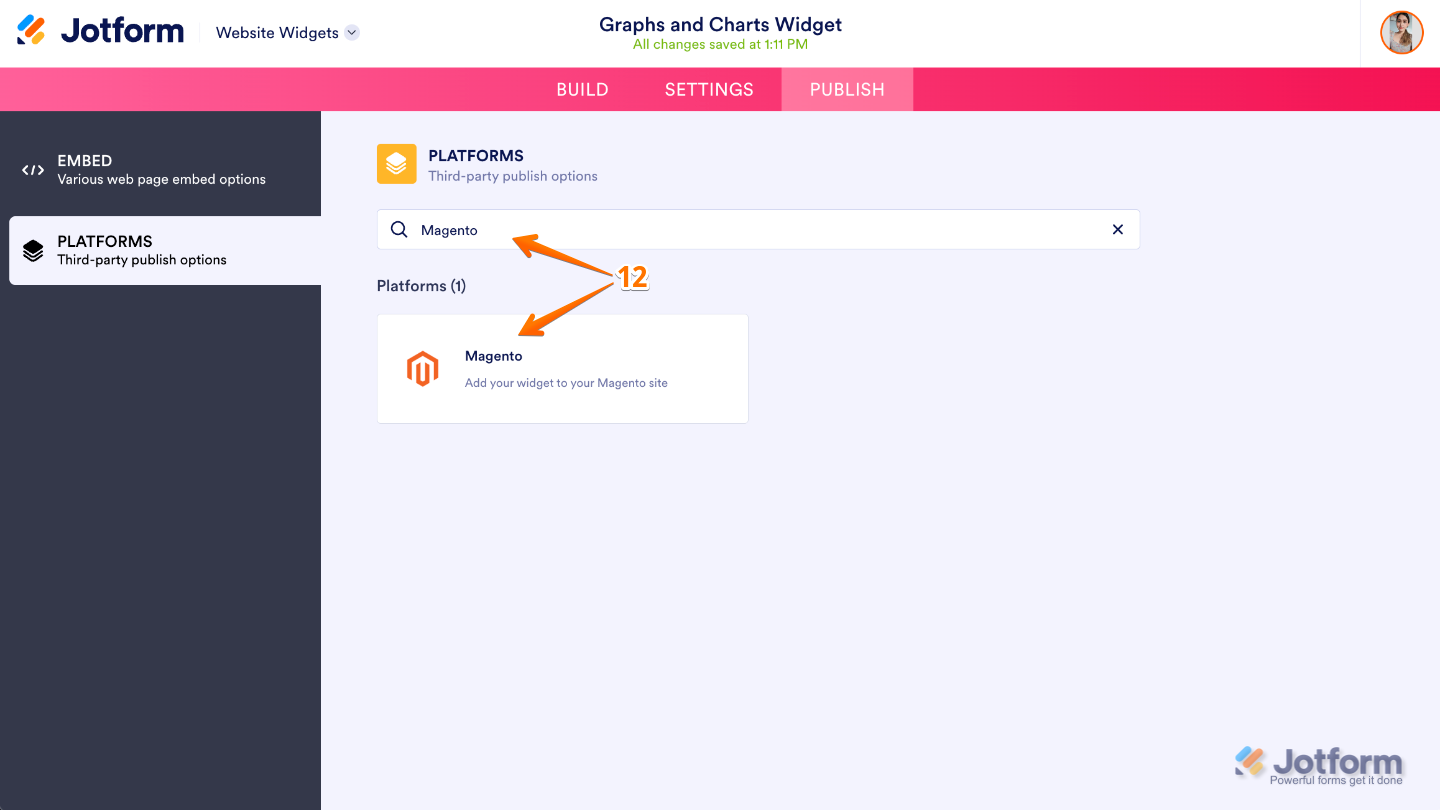
- Finally, follow the steps in the How to Embed Your Widget section to add it to your platform.
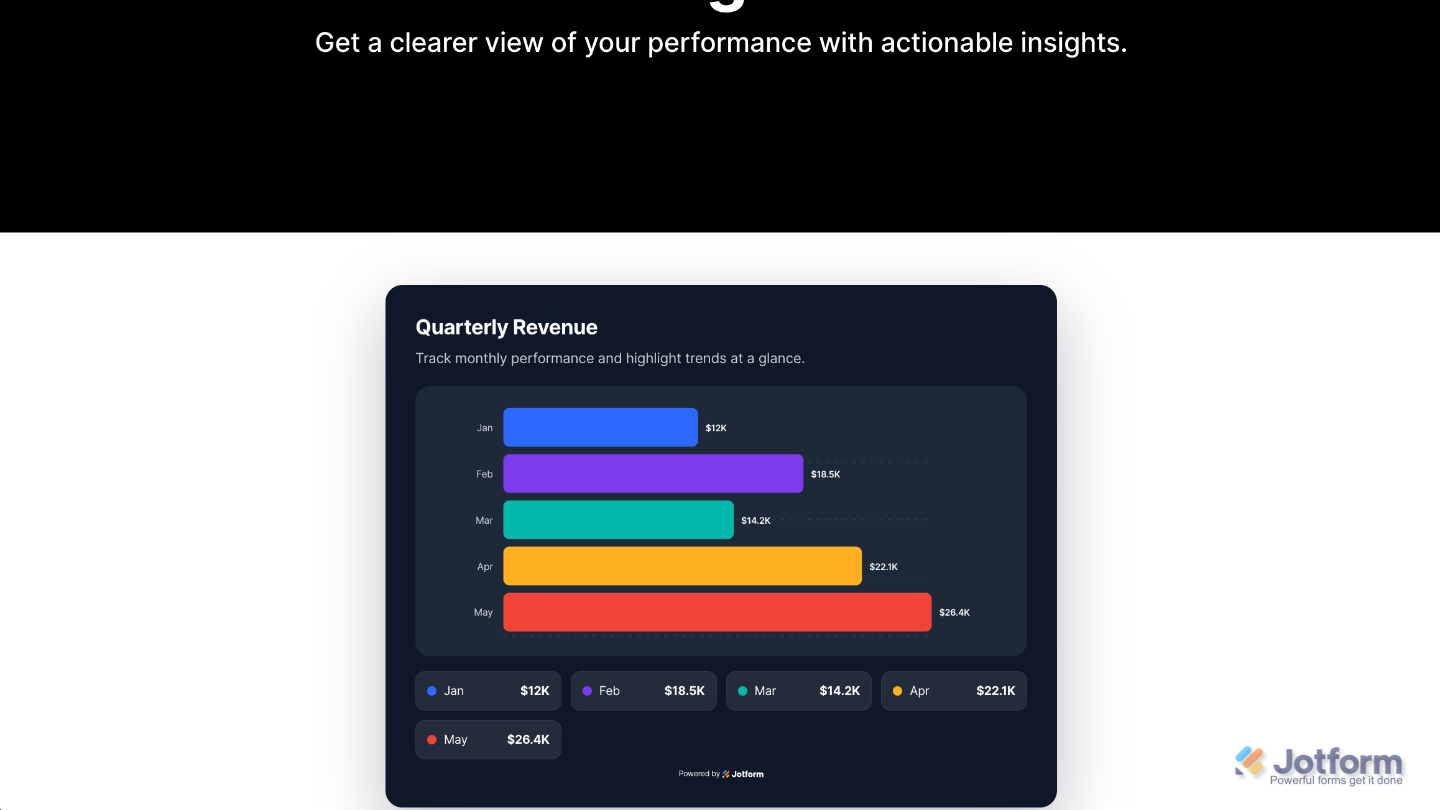
That’s it! Your Graphs and Charts widget will appear on your website with the design and settings you selected for it. See the screenshot below for an example of how it looks:
Note
You can manage the website widgets you’ve created at any time from your account. For a full breakdown of how to do it, head over to our guide on How to Manage Website Widgets.
Pro Tips
- Keeping your color choices consistent with your website’s branding helps create a more polished and professional appearance.
- Previewing your chart on both desktop and mobile devices before publishing ensures it’s easy to read and fits well on different screen sizes.


Send Comment: