Many people have heard of dashboards, and they’ve heard of reports. The two might seem mutually exclusive: One is a visual representation of data, and the other is data. But when you ask, “What is a dashboard report?” the answer may show that the two have more in common than you thought.
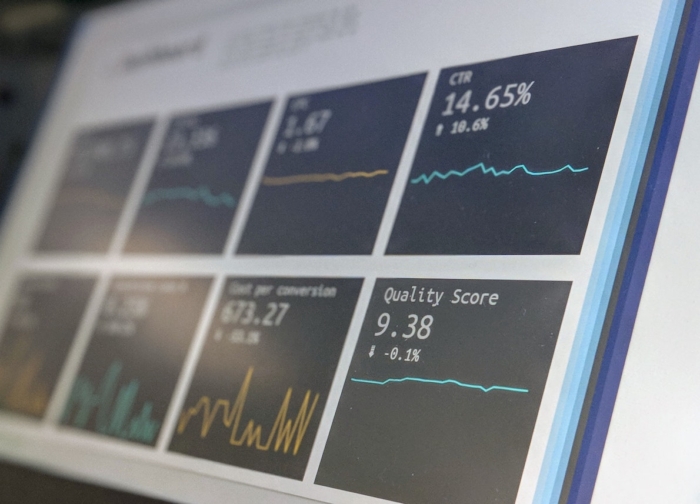
A dashboard is a place where you can keep an eye on what’s happening. You create one by specifying what data streams you’ll pull in, and then you use charts and graphs to visualize the data.
Meanwhile, a report is much more detailed. It dives into all the data you’re analyzing and lays it out in charts and graphs, much like a dashboard. But a report allows you to view everything that’s going on, not just what you need to make decisions.


So what is a dashboard report?
Somewhere in between a dashboard and a report, a dashboard report is a more detailed view than you’d find on a dashboard. Whereas a dashboard may only have a few key charts and graphs that cover what you need on a regular basis, a dashboard report is much more comprehensive.
Essentially, a dashboard report is built to look like a dashboard, but it has a lot more information. For example, a CEO might only see daily sales when viewing the dashboard. However, in a dashboard report, they’d also see the number of sales in each region or which products are selling out fastest.
The dashboard report is different from a standard report in that the charts and graphs may be interactive. Instead of the CEO scrolling through screens of charts and analyses about best-selling products, they can click on a data point in a chart in the dashboard report to zoom in on what product was selling during a certain time frame.
Types of dashboard reports
You can use three different types of dashboard reports: operational, strategic, and analytical. Each of these helps different people in the business make decisions.
Operational dashboard report
If you need a dashboard report that includes frequently updated data, you’ll likely be working with an operational dashboard report. This type of dashboard report monitors business processes and tracks different metrics and key performance indicators (KPI) in real time or near real time — it’s ideal if you need to look at the health of your business several times a day.
For example, you might build a web performance operational dashboard report. This would track metrics like how many site visits you’re getting, where your site traffic is coming from, and how long people are spending on your website. It would also compare these metrics to the goals you have for your site.
Strategic dashboard report
Designed for the C-suite, a strategic dashboard report focuses on the KPIs that matter to executives. The information doesn’t need to be updated in real time, as executives typically only look at these types of dashboard reports once or twice a day.
One type of strategic dashboard report might focus on the company’s product, like a cloud-based storage service. It could include information on sales, the marketing tactics in use, ad spend, budgets, and customer retention rate — all using preset KPIs.
Analytical dashboard report
The third type of dashboard report, the analytical dashboard report, is typically used to analyze large amounts of data. This type of dashboard report tends to be more interactive, since users view it to predict trends and dig deeper into some of the metrics they’re viewing.
The data in these types of dashboard reports typically isn’t real time, but it does need to be accurate and up to date so that users can make sound decisions based on it.
An analytical dashboard report might focus on monthly recurring revenue and the associated accounts. Based on accounts that have been frozen or dropped, a user can try to reduce customer churn.
Deciding on a dashboard report
What you include in your dashboard report — and what it focuses on — will depend on the viewer’s role in the organization as well as what they want to learn from the dashboard report. They might want to know information related to their jobs or about the health of the overall business.
If you’re preparing a dashboard report for an IT professional, you’ll include data on the health of the systems and the network. On the other hand, a dashboard report for a marketing professional would include things like how well ad campaigns are performing and which keywords are bringing traffic to the website.
Ultimately, using a dashboard report can help you dig deeper into how the business is doing. Know what the goal is — and what you need to view — and you’ll be able to prepare a dashboard report that will help you make sound business decisions.


Send Comment: