
How do you debug problems on your product? One way would be to read your code line by line and try to find the problem. If you can catch bugs with your plain eyes, you are my hero. Know that the programmer gods have given you a big gift. For the rest of us lowly mortals, that is not an option.
Even when you look at your own code, it is still hard to catch bugs. People tend to not see their own mistakes.
The solution: Use a debugger.
I have seen many developers consider debuggers not a necessity. Especially on the web. Most developers just log/print the variable values to the console/screen. On the other hand, I’ve also seen how the best of the best use debuggers like a wizard.
Of course you could fix your bugs by printing junk on the console, but it has a cost. You are wasting too much time trying to find that line that has the bug. You have to keep logging everything. You have to refresh and wait and do the same old steps on the UI for the umpteenth time. I know because I have done all of these things myself. You have to wait for the refresh to complete. You have to wait for this and you have to wait for that. If you are logging the wrong variable, you start over. Things may get all mixed up and you may never know where the bugs are roaming around.
Debugging is a much faster way to catch bugs. It is simple and fast. You mark where the execution should pause. You can see all of your application state at that point. You can go through your code step by step and at each step you can find out how your application reacts. This way, you will accelerate the process, gain time, and your time won’t be wasted.
Chrome DevTools
To debug your javascript code, you can use Google Chrome’s debugger tool.
First, launch the Chrome Developer Tools (a cool shortcut you must memorize right now: cmd + alt + i ). Then click Source tab. You will see that the page is separated into 3 panels.
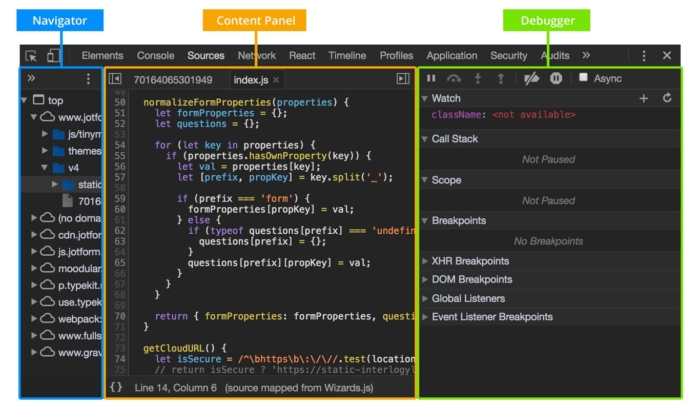
- Navigator: All your project files are listed in this section.
- Content Panel: You can see your selected file’s content.
- Debugger: You can debug your code with tools under this section.
Debugger Panel
This panel is separated into 5 parts and all of them are going to make our debugging process much easier.
- Debugger buttons
- Breakpoints
- Watch
- Call Stack
- Scope
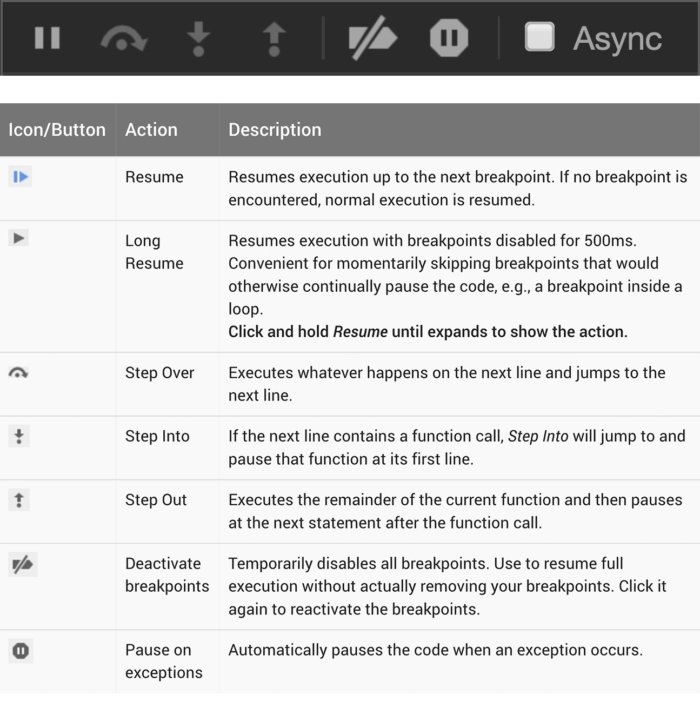
Debugger Buttons
While debugging, these buttons will help you navigate your code like a champion.
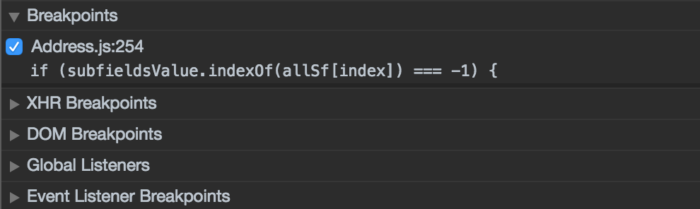
Breakpoints
Breakpoints are the points where our program is paused. Thanks to the breakpoints, we can pause our application at the exact moment we would like to check things out. Breakpoints are the most fundamental feature of the debugger.
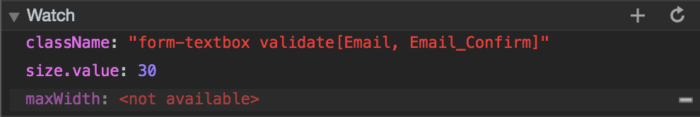
Watch
In this section, you can enter a variable name you would like to watch.
Your variable’s value is shown on that part while the debug mode is on. If the variable isn’t set or cannot be found on this state then the variable value is shown as <not available>. Using Watch allows you to focus on only the variables that you would like to watch, and I think this is one of the greatest features of this debugger.
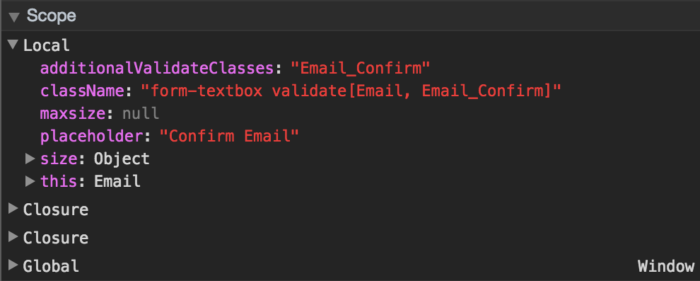
Scope
Scope panel shows all of the variables that the debugger is able to reach at the moment of pausing. You will see that the variables are grouped from local to global.
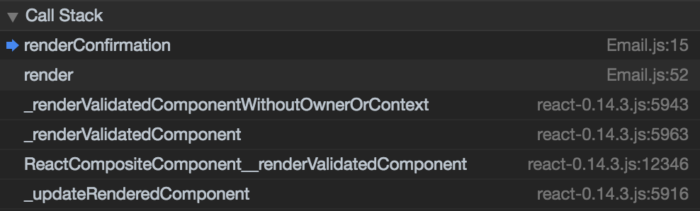
Call Stack
This section shows the journey of your breakpoint. I mean, you can basically see every single function of your code done in reverse order. Also, you can easily navigate between functions with a single click.
How do you pause your application at an exact point?
It is an important skill to know how to use breakpoints and more importantly how to place them at the exact right location.
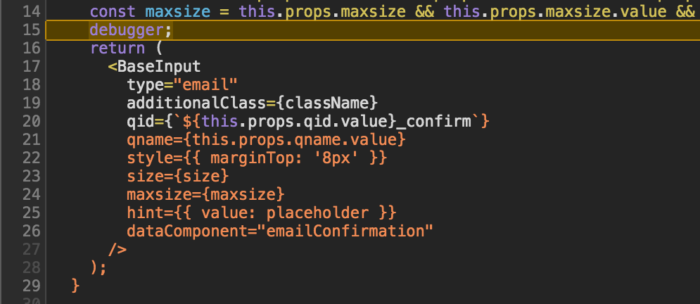
1) Write “debugger” keyword in your code.
Let’s assume that we know where the problem is. Then it is simply a matter of putting down a “debugger” above that line. When the code is executed, the debugger will see it and and it will pause there. (Note that developer tools should be open for it work.)
Cool! You are now ready to debug your code.
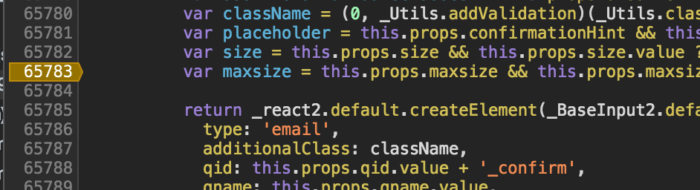
2) Set your breakpoint on a specific line:
You can also set the breakpoints using the Content Panel. To achieve that, just click the line numbers from the Content Panel and you are done. This is especially useful if you are trying to pinpoint a bug that only happens on production with real data.
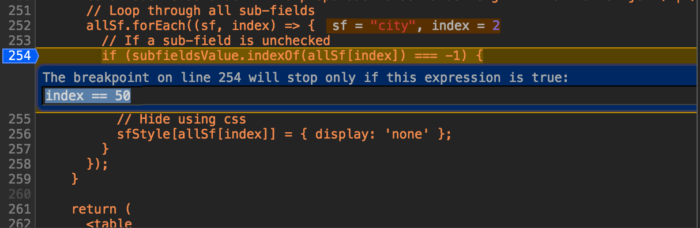
You can also create conditional breakpoints this way. What if you have a loop which is meant to loop 100 times but you would like it to stop and check a variable on a particular line at the 50th loop?
To create conditional breakpoints, right click on the line number and click on “Edit Breakpoint”. Then, an input field will appear and you can write your conditional statement right there. Cool, isn’t it?
You must also read How to use Chrome DevTools like a Pro to learn how to find a particular file easily and 20 other pro tips.
3) Set Breakpoint at DOM Manipulation
Another cool thing about Dev Tools Debugger: You can put breakpoints at DOM. Think about this, you have an unfamiliar code base and you have to fix bugs. The only thing you have is DOM elements changing. You don’t know where to start. Then this feature is exactly what you are looking for. You can set breakpoints on 3 different DOM manipulation events. Just decide which one of these cases fits your need.
- Subtree Modification
- Attributes Modification
- Node Removal
a) Subtree Modification: Whenever the node’s children is added, deleted, or changed (not changing child attributes), the debugger pauses the page and takes you to the exact line of code that’s causing it.
b) Attributes Modification: If you select this option, page will pause when selected element’s attributes change.
c)Node Removal: It pauses the page when the selected DOM element is discarded from page.
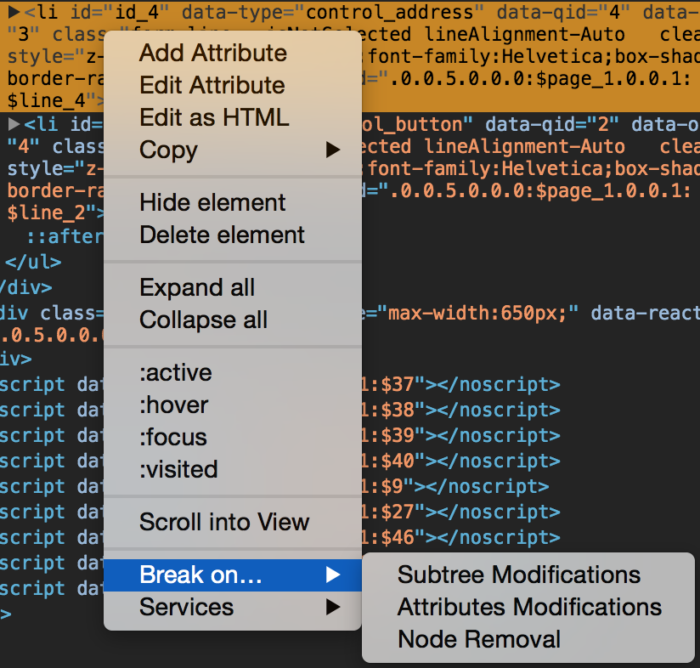
Select DOM from Elements Tab, right click on an element. You can see DOM breakpoints under the “Break on…” option.
By the way, you can use these options on the same DOM element at the same time.
4) Set Breakpoint at EventListener
Event Listener Breakpoints is in the Debugger section. It allows you to pause your app whenever a selected event is triggered. You can set breakpoints on all kinds of main events, like mouse events or animation events. The list is shown in the image below.
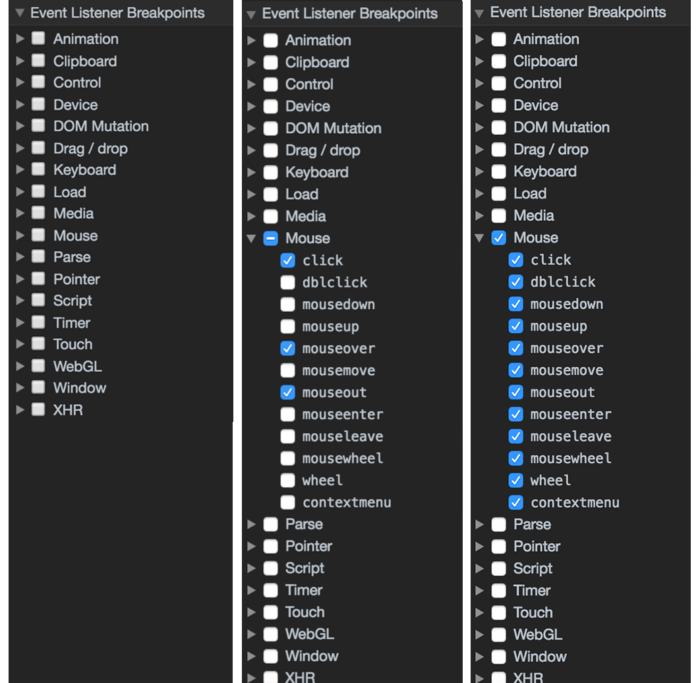
You can select sub events which are shown under the main events. You can select them one at a time or you can select them all by just clicking on a main event such as “mouse”, “keyboard” and “drag & drop”.
For example, you selected the click event under the mouse event on the Event Listener Breakpoint section. This means whenever you click something which triggers the click event, your app will be paused.
5) Set Breakpoint on Exception

You can pause your code right before code throws an exception. To do that, click on “Pause on Exception” button from the debugger buttons. This button helps you pause your code before the exception is thrown.
Do yourself a favor and start using a debugger. Today.
Using a debugger may seem confusing or unnecessary at first, but when you get used to it, you will gain an amazing amount of speed up in your bug hunts. Another advantage of using a debugger is that your code reading skills will be improved.
We have been working on Jotform 4.0 for the last 1.5 years. It is an amazing piece of software. I am very proud of our accomplishments as we approach the launch date and watch our beta users be amazed by the product. Without a debugger, my output to my team would have stayed at a 50% level.
Learn your debugger and you will dominate your code. But don’t forget the valuable quote from Uncle Ben:
“With great power comes great responsibility” ~ Uncle Ben


Send Comment: