

Top 5 AI chart makers
Imagine tomorrow is your company’s monthly sales meeting, and you have only a few hours to put together an engaging presentation. Chief on your to-do list is chart creation. You want to highlight trending sales by product and region because the data shows strategic revenue growth opportunities. But you’ve always struggled with graphs and charts. They’re time-consuming and rarely turn out how you envision them. What to do?
AI chart generators can help. These tools ingest raw data and turn it into impactful visualizations. With the right solution, you won’t have to worry about manual formatting or picking the proper chart type. The tool does the heavy lifting for you using your prompts and inputs. In this article, we’ll compare the top five AI chart makers. You’ll learn about their features, pricing, and ideal workflows so you can pick the one that best fits your workflow.
Top 5 AI chart makers to try in 2026
Finding the right AI chart maker starts with understanding your use case. Are you planning to share charts on social media or with customers? Or are you using them for internal purposes? If you plan to share them, choosing a tool that supports embedded code and links is a top priority.
Another consideration is pricing. For everyday chart generation, free and inexpensive tools provide enough features to turn your data into clear visualizations. However, it makes sense to go with an enterprise-level product if you have a large team or work with heavy amounts of data.
Here’s a breakdown of the top AI chart makers, plus an in-depth review of each tool.
| Tool | Best for | Export options | Pricing |
|---|---|---|---|
 Jotform AI Chart Generator |
Visually appealing AI-generated charts |
Link, email, social media, embedded code |
Free; paid plans available |
Canva |
Basic charts and graphs |
PDF, PPTX, JPG, PNG, link, embedded code |
Free; paid plans with AI features available |
Microsoft Copilot in Excel |
Summarized data insights |
Image or chart object |
Starts at $9.99/month for individuals; $12.50/month for businesses |
Datawrapper |
Publication-ready professional charts |
PNG or embedded code |
Free; paid plans start at $599/month |
Tableau |
Users with complex data sets |
XLSX, CSV, PDF, PPTX |
Starts at $15/month plus $75/month license fee |
1. Jotform AI Chart Generator: Best free AI chart tool
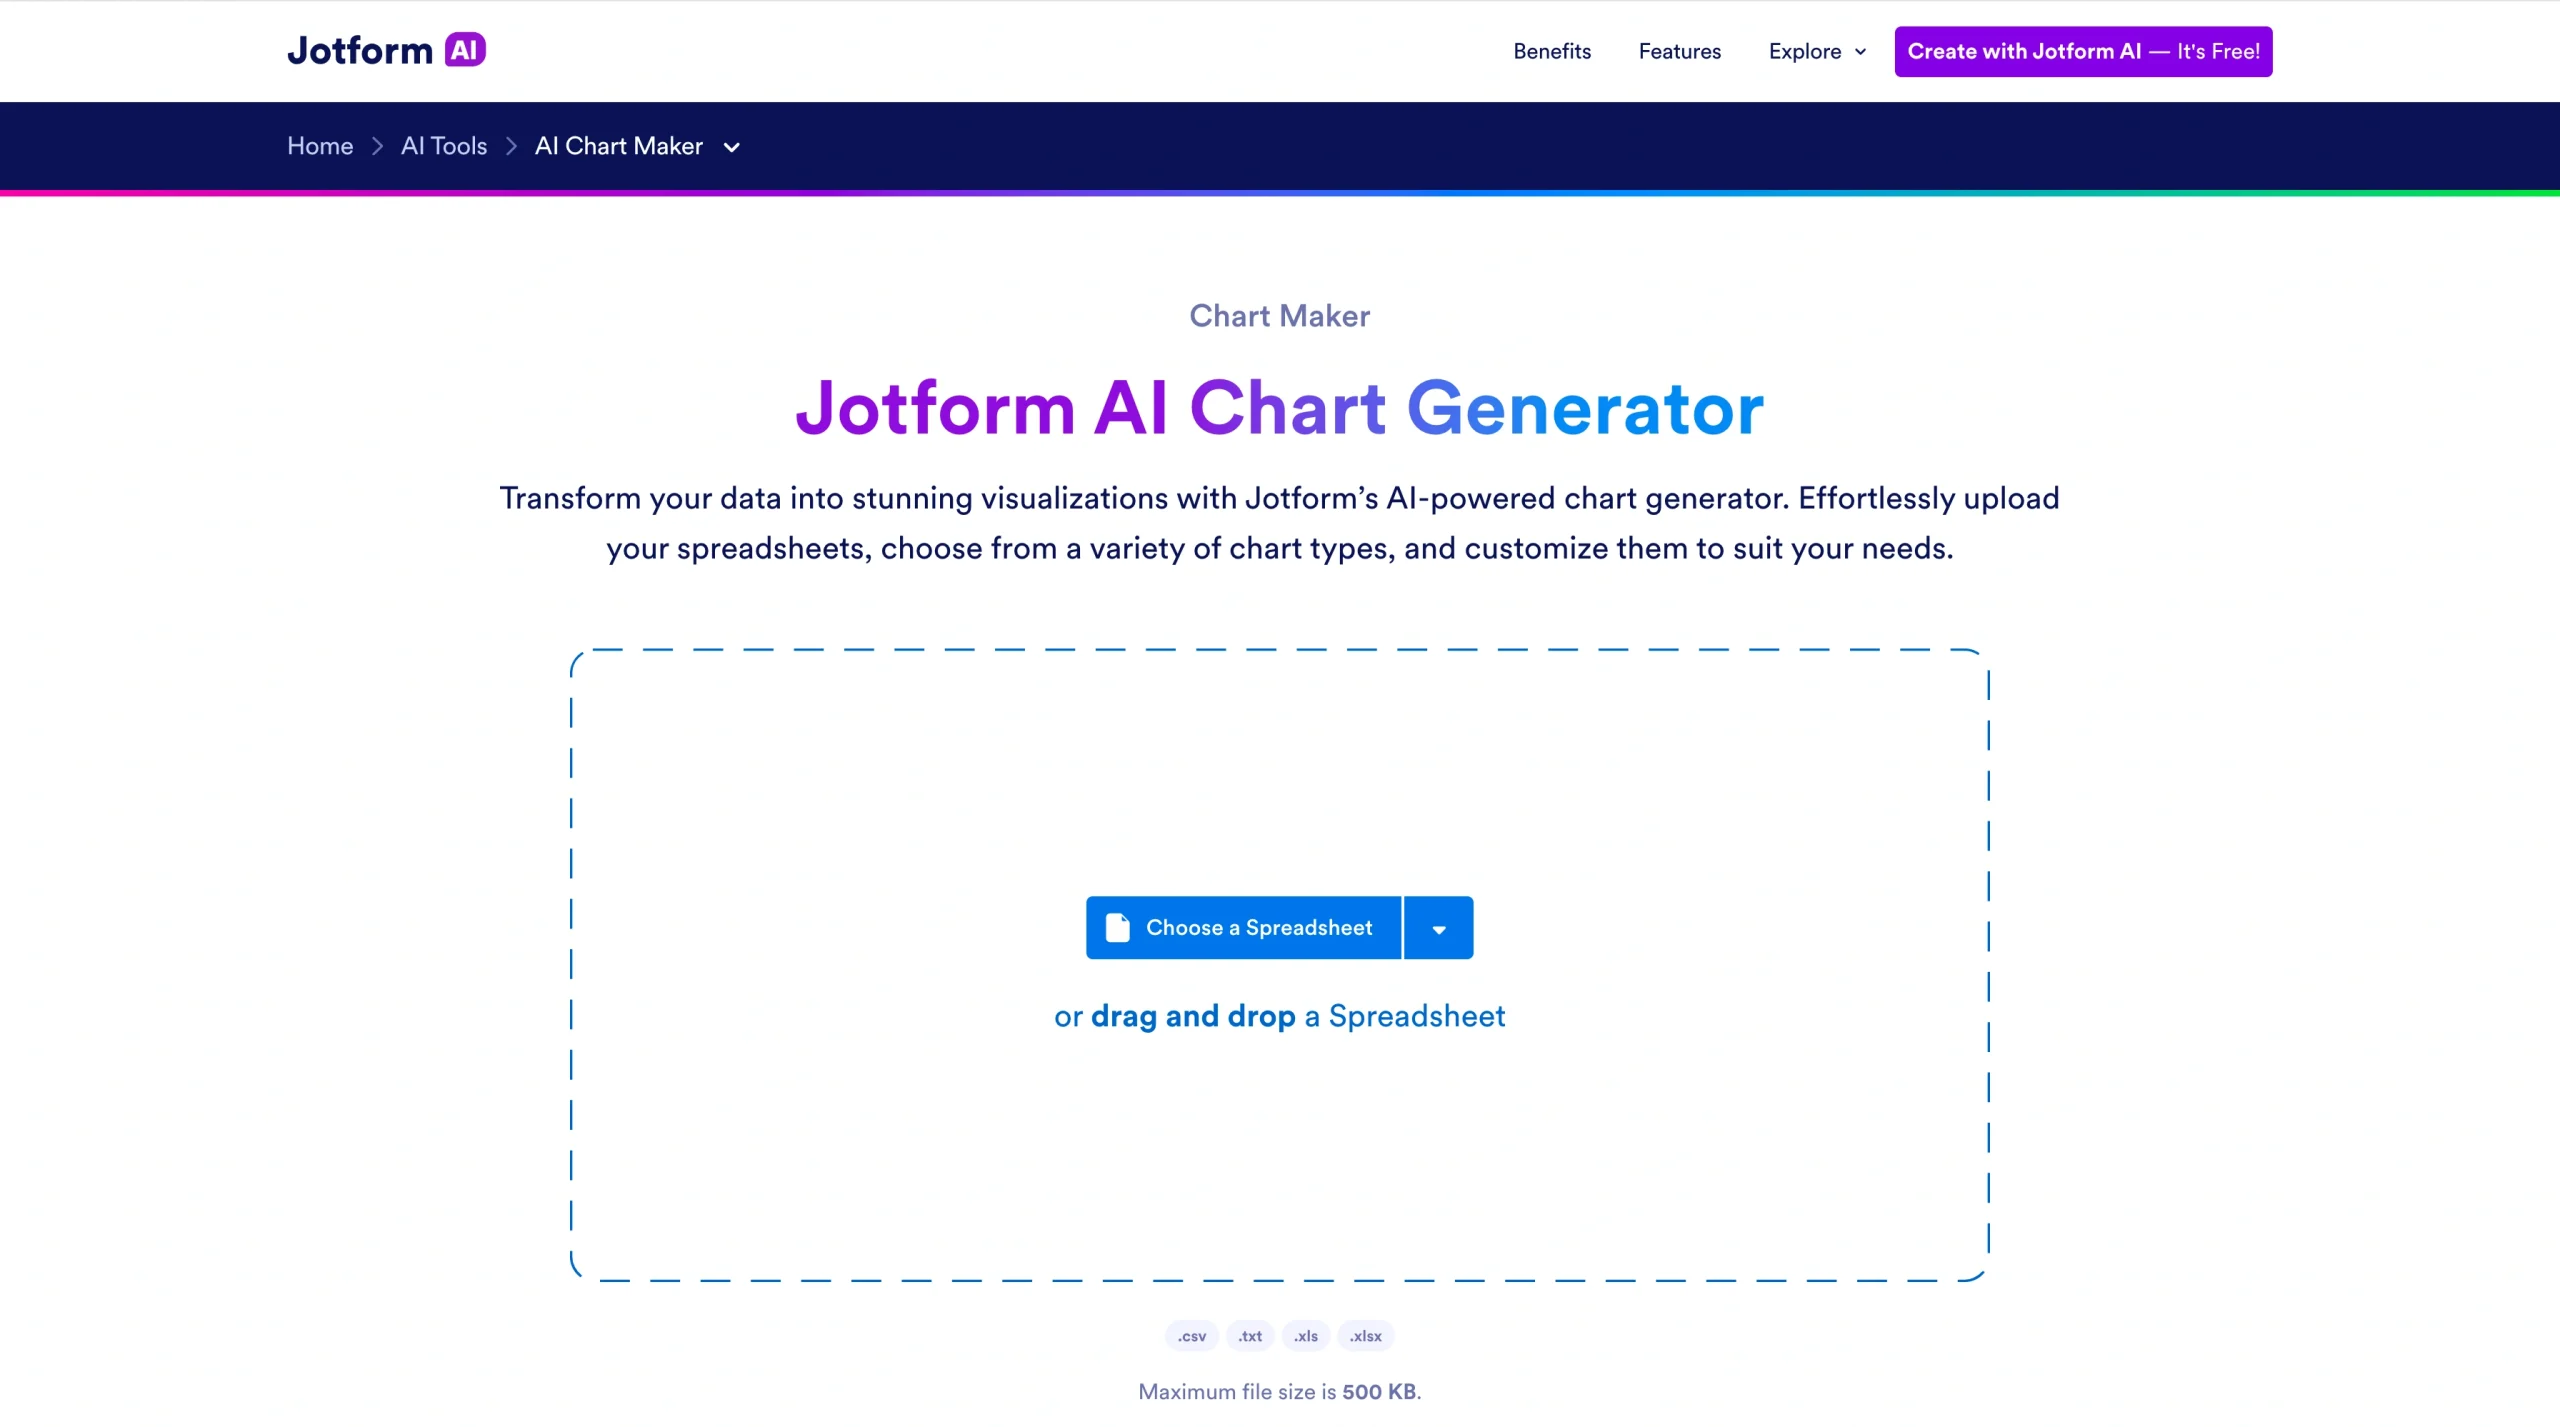
Jotform’s AI Chart Generator creates stunning graphs and charts sourced from your data. To use it, upload your spreadsheet to Jotform and select a chart type. The Chart Generator includes editing tools that allow you to adjust colors, labels, fonts, axis titles, and legend placement so they match your preferred style.
Jotform supports spreadsheets in CSV, XLS, XLSX, and Google Sheets formats. If you’re using a different format, you can convert it. Chart types available through Jotform include bar, pie, doughnut, and column charts and table. You can try multiple charts to determine which one best fits your data.
Charts generated through Jotform are easily shareable via link, email, social media, or embedded code. It’s perfect for times when you need to convey data to colleagues, vendors, or customers, and it’s suitable for individual or team use.
For added value, you can also use Jotform Presentation Agents. They bring your presentation to life with voice-guided narratives describing the content of your slides. Jotform AI Agents automatically generate scripts using your data, but you can customize each script so it reflects the key points you want to address.
If your audience has a question during the presentation, Jotform’s AI Agents can answer it in real time. They adapt to all types of use cases, including corporate training, educational sessions, and sales demos.
- Key features
- Converts spreadsheet data to charts using an instant upload
- Capable of producing bar charts, pie charts, doughnut charts, column charts, and tables
- Includes editing tools to adjust fonts, legend placement, colors, labels, and other design elements
- Pros
- No learning curve; very easy to use
- Charts shareable via links, email, social media, and embedded code
- Compatible with other Jotform AI tools, such as the Jotform AI Form Generator or Jotform Presentation Agents
- Cons
- Spreadsheet file size limited to 150 KB
- Must convert operational data store (ODS) or IMP spreadsheets to XLS, CSV, or XLSX to use
- Doesn’t support scatter plots, box plots, or Gantt charts
- Pricing
- Free for up to five AI agents and 100 file submissions with Jotform branding. Upgrade to a paid plan to remove branding, extend storage space, and add more AI agents. Paid plans start at $34 per month.
2. Canva: Best for basic graphs and charts
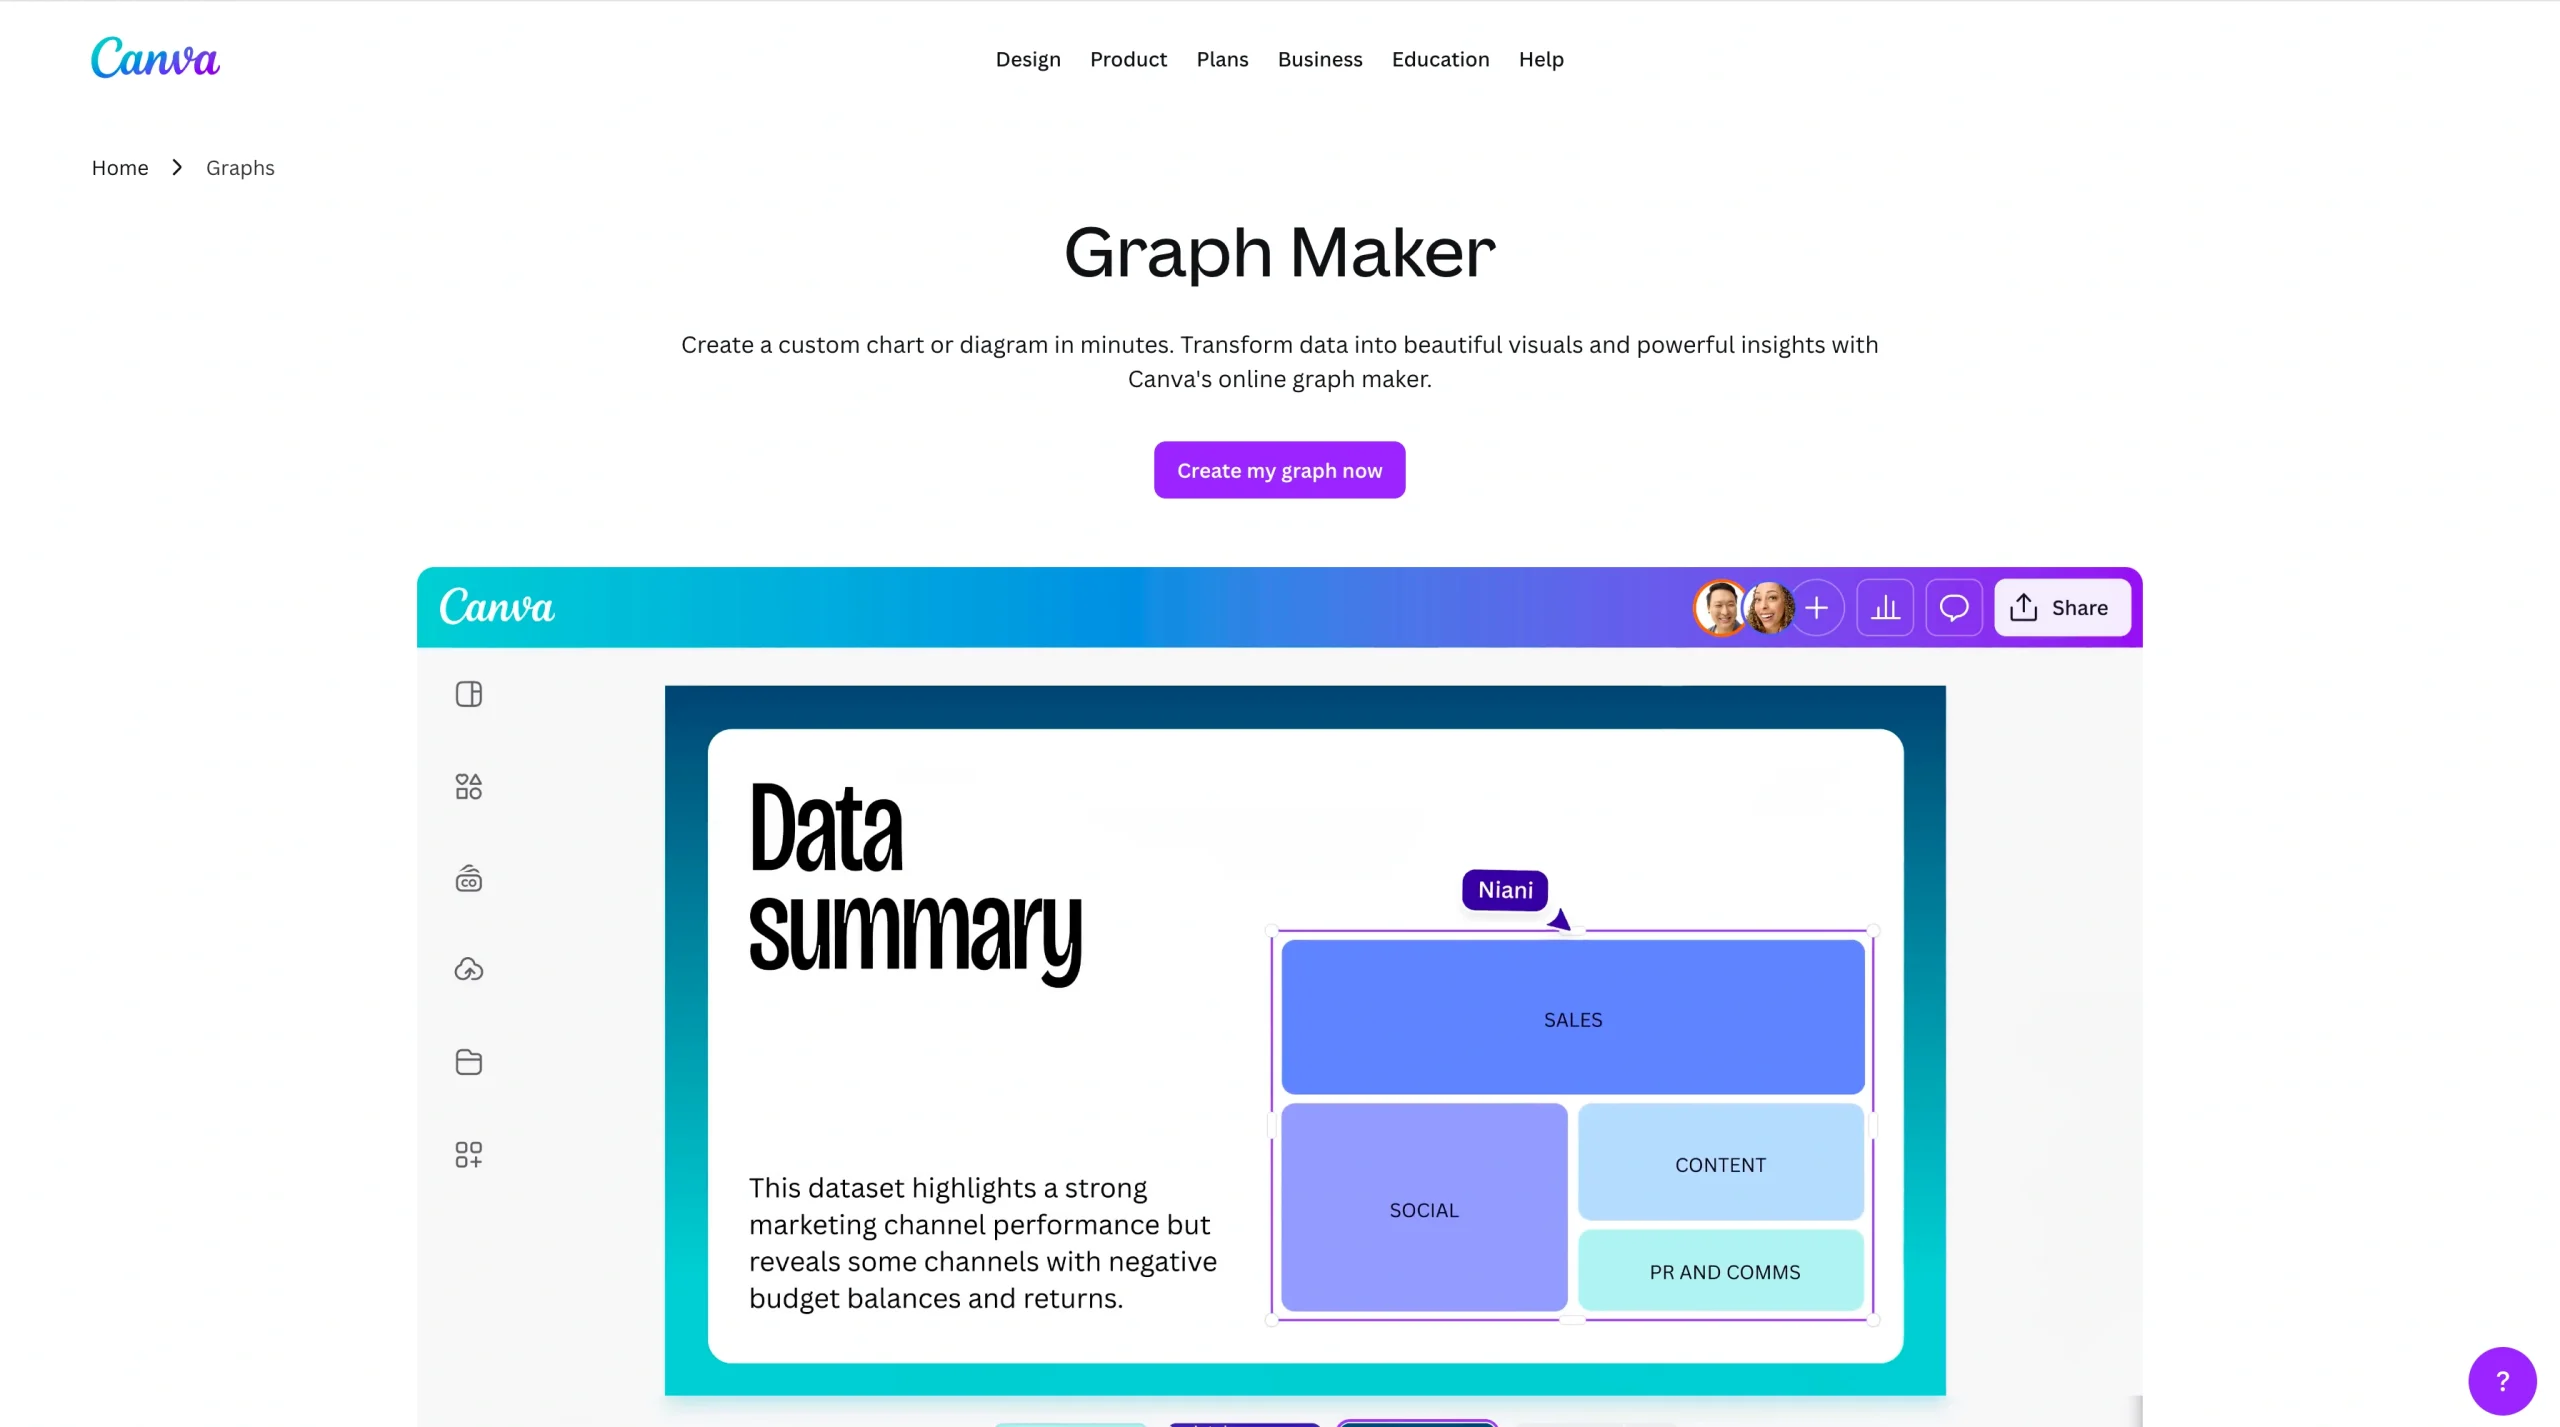
You can use Canva‘s AI graph tools to create simple charts with your data. You can enter data manually or upload it from a spreadsheet file in CSV, XLS, or XLSX formats. After sharing the data, you’ll enter the Canva workspace, where you can choose a chart type, adjust colors and fonts, and add animations.
The graph features available in Canva’s free plan are limited, but upgrading to a paid plan unlocks additional functionality. Two paid features that are particularly useful are Magic Charts and Magic Insights.
Magic Charts updates your chart data in real time. Magic Insights uses AI to uncover insights and key takeaways from each chart. You can use this feature to inspire a presentation or social media post, which is helpful when you’re short on time.
Businesses that plan to use Canva regularly can create a Brand Kit using their logo and colors. The features included in Brand Kit keep charts aligned with your organization’s visual identity. You can also set up a repeat workflow for charts you use regularly.
Canva is suitable for individuals and small businesses, but other tools may be better alternatives for teams working with larger data sets.
- Key features
- Converts manual or uploaded data into a chart format
- Includes editing tools to adjust chart color, fonts, and spacing
- Uses a Brand Kit to visually align with your organization’s logo and colors
- Pros
- Supports multiple chart types, including bar, line, pie, doughnut, area, scatter, histogram, and more
- Works well with other Canva tools, such as presentations and videos
- Adds fun flair to charts and graphs with animation tool
- Cons
- Does not offer AI features, including Magic Charts and Magic Insights, on the free plan
- Limits files to 100 MB, 500 rows, and 52 columns
- Does not support Google Sheets
- Pricing
- Free for basic features and a single Brand Kit with three colors
- Paid plans that include AI tools start at $15 per month for individuals.
3. Microsoft Copilot in Excel: Best for getting quick insights
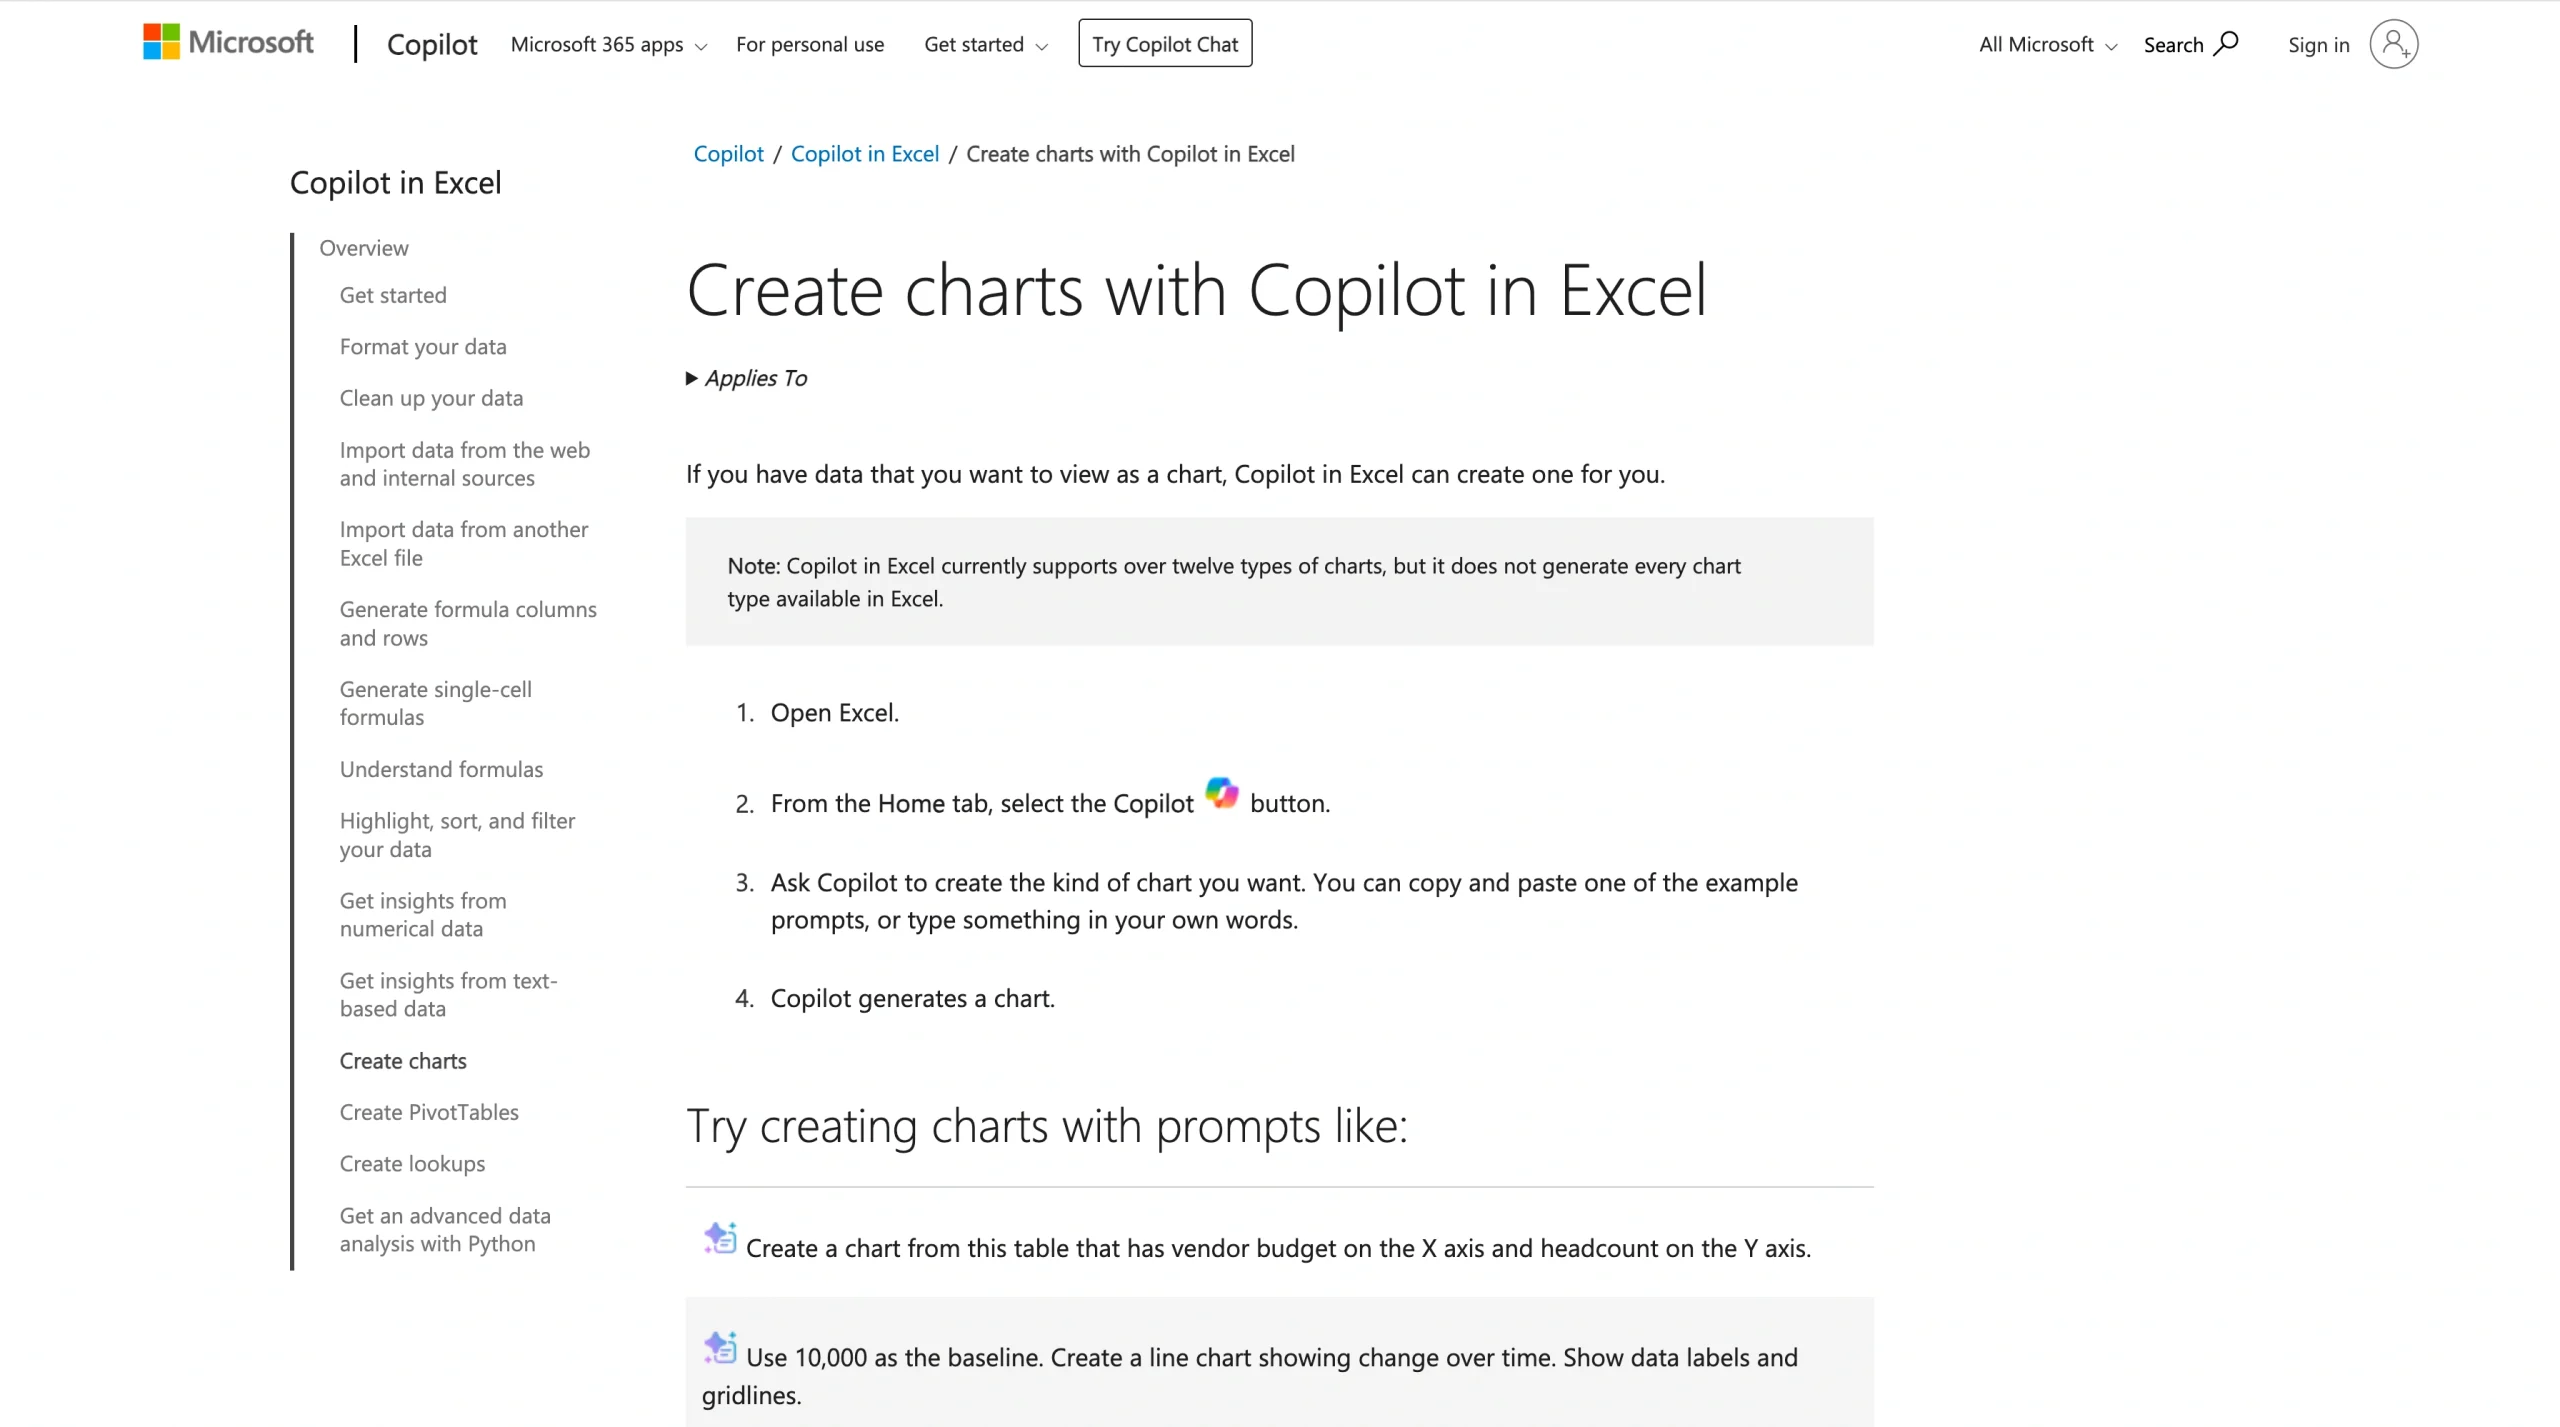
Microsoft Copilot is included with all Microsoft 365 plans. Copilot is Microsoft’s AI tool, and when you use it with Excel, it can create basic charts for you. To get started, you’ll need to open a spreadsheet that contains your data in Excel. Navigate to the Copilot tool and input a prompt, such as “Create a chart using the data in this sheet.” Copilot will create the chart and insert it into a separate tab.
By default, charts generated by Copilot are in a picture format. This prevents you from further customizing the chart’s colors, fonts, legend, and titles. However, there is a way to get around it: Simply tell Copilot that you need the chart in an editable format. This will prompt Copilot to create an entirely new Excel file for you, and you can manually adjust the appearance of the graph to match your taste.
With Copilot, the more specific your prompts, the better the outcome. Detailing which columns you want to include, which colors to use, and other aspects can improve your results.
If you already have a Microsoft 365 plan and are comfortable using Excel’s graphing tools, then Copilot may work for you. However, infrequent Excel users may find them cumbersome. Copilot is suitable for individual and business use.
- Key features
- Creates graphs within your spreadsheet, eliminating the need for uploads
- Is driven by your prompts; the more specific the prompt, the better the results
- Highlights key insights from chart data
- Pros
- Is included with every Microsoft 365 plan; no extra subscription required
- Can fully customize charts using detailed prompts
- Selects the best chart type for your data (unless you identify a type of chart to use)
- Cons
- Potentially tiresome manual customization of graphs in Excel
- Defaults to a non-editable picture of your graph
- Creates AI graphs slowly, especially for large data sets
- Pricing
- Individual plans start at $9.99 per month and business plans start at $12.50 per month.
4. Datawrapper: Best for news and media charts
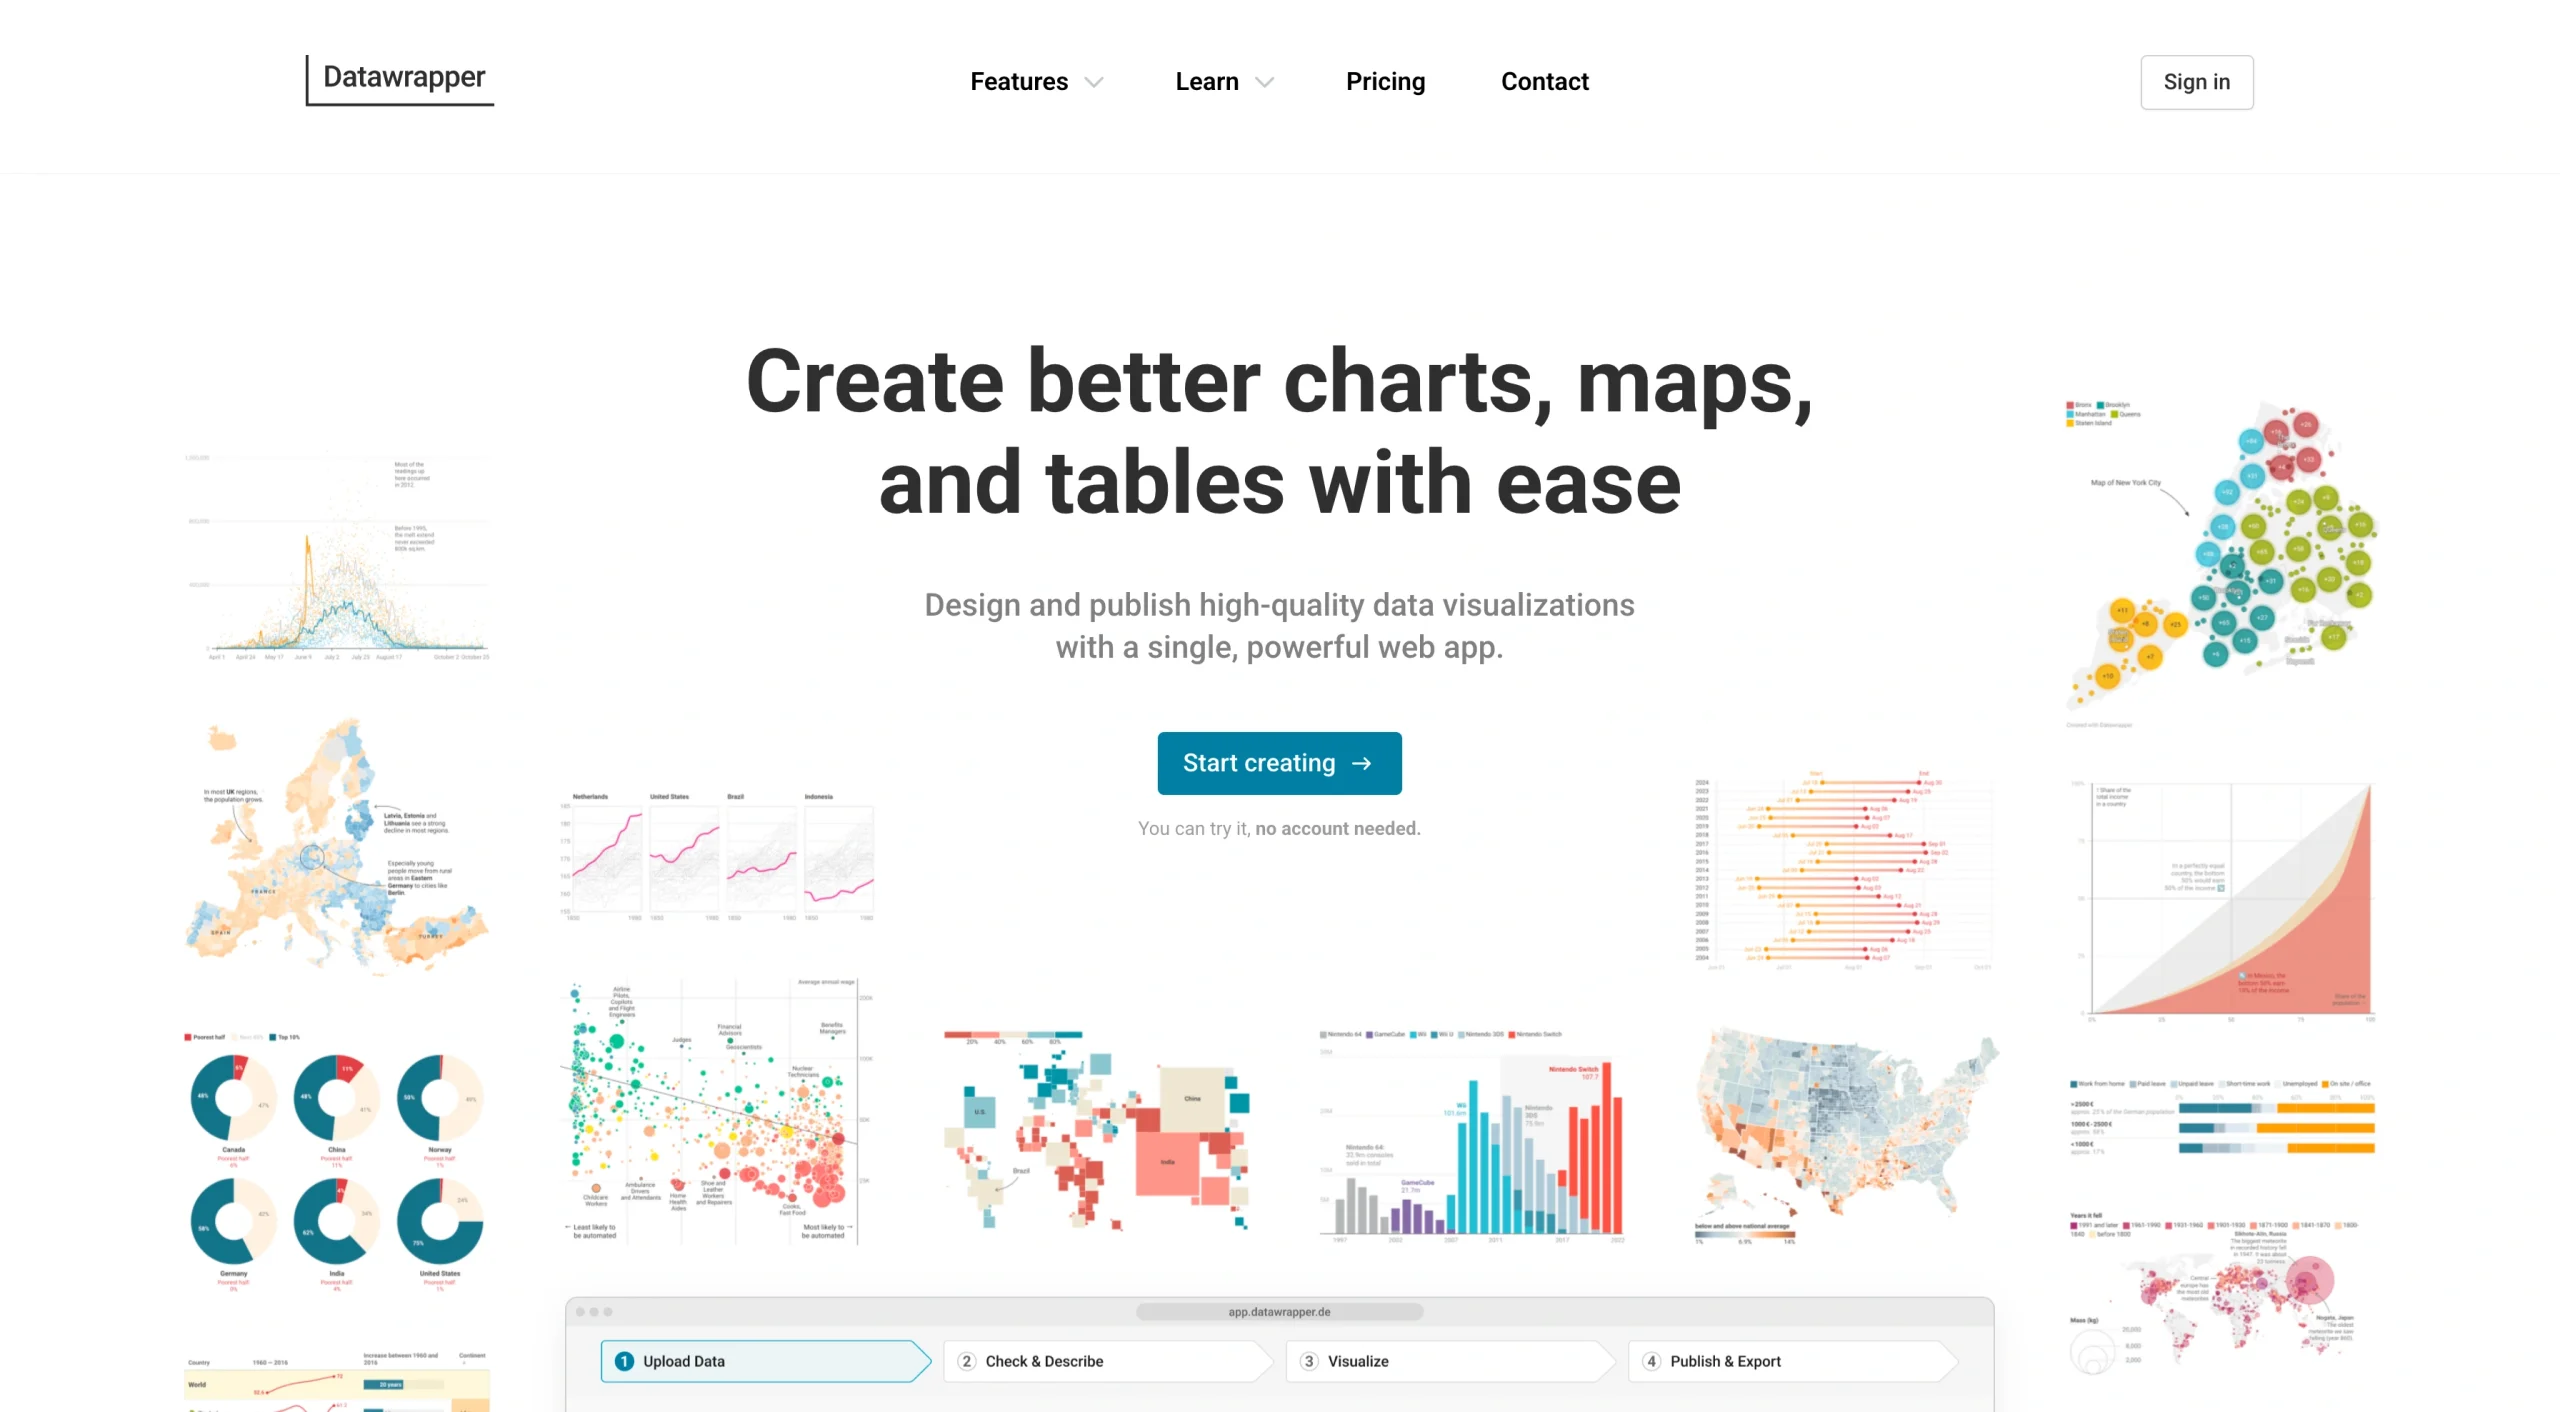
Datawrapper is widely used by media companies such as The New York Times and Thomson Reuters to create professional graphs. While it caters to enterprise organizations, its chart-making tools are surprisingly easy to use. There isn’t much of a learning curve; anyone can create a graph within minutes.
Datawrapper’s free plan supports data uploads from XLS and CSV files. You can also copy and paste a data table or link to a Google Sheet. The process follows four steps: adding data, confirming its accuracy, customizing the output, and publishing the chart.
Unlike other tools, Datawrapper offers minimal customization options with its free plan. You can’t select a specific font or use fancy color schemes,,but it offers a broad range of graphs and its templates are clear and concise. It offers a few unique features, such as a colorblind check and dark mode. These tools adjust the look of your graph and support accessibility.
Datawrapper is excellent for creating publication-ready professional graphs. Its paid plans are expensive, but they introduce additional customization features that allow you to tailor your visualizations to your organization. They also remove the Datawrapper branding and provide additional export options. Enterprises that produce many visualizations for public audiences (such as universities, government agencies, and media) will find it to be a useful tool.
- Key features
- Creates bar charts, line graphs, area charts, scatter plots, doughnut charts, pie charts, tables, and more
- Builds graphs with a professional appearance suitable for publishing
- Supports PNG exports and embedded code in free plan; scalable vector graphics (SVG) and PDF exports allowed in paid plan
- Pros
- Has no limit on data file size
- Includes annotation tools to attribute data to an original source
- Offers several template styles
- Cons
- Minimal customizations on the free plan
- No AI features available
- No extrapolation of data insights
- Pricing
- Free plan lets you create and publish charts with minimal customizations and Datawrapper branding
- Paid plans start at $599 per month and include 10 user licenses.
5. Tableau: Best for advanced visualizations using complex data
If you work with extensive amounts of data, Tableau may be the solution for you. It creates all types of data visualizations, including advanced types such as geospatial maps and treemaps. You can connect data to Tableau from multiple sources, including data warehouses and cloud applications. This allows you to identify insights that may not be apparent from a single spreadsheet.
Tableau’s interface is user-friendly and powerful, so much so that its endless features may overwhelm users who need only basic chart and graph support.
Users of Tableau tend to be midsize and enterprise businesses with heavy data analysis requirements. While monthly subscription costs are reasonable, you must also pay for a separate license to use the product. This can significantly increase your costs, especially if you have only a handful of Tableau users on your staff.
- Key features
- Creates all types of charts, including line, area, and pie charts, plus histograms
- Summarizes key insights from data using AI features
- Connects multiple data sources for instant chart creation
- Pros
- Supports drill-down interactions, allowing you to view data behind the chart
- Contains many customization features for chart colors, fonts, spacing, and more
- Creates dashboard visualizations of multiple charts
- Cons
- Has a steep learning curve, especially if you plan to connect multiple data sources
- Requires a separate monthly license to use
- Is unsuitable for casual users working with basic data
- Pricing
- Standard plan starts at $15 per month per user, plus a $75 per month license fee. Upgrading to Tableau Enterprise provides advanced data analysis and security features and starts at $35 per month, plus a license fee.
How to choose the right AI chart maker for your needs
The best AI tools are moving past simple chart generation in favor of automated data storytelling. Some solutions can derive automatic insights from your data, saving you time and effort when interpreting large data sets. Other tools (like Jotform AI Presentation Agents) can create entire scripts and narrate presentations using AI-generated voices.
This means that AI chart generators are evolving to the point that they can produce visuals and reports without manual effort. Busy professionals will no longer have to spend hours or days analyzing rows and rows of data.
Among the best AI chart makers, Jotform AI Chart Generator remains the go-to solution for business owners and professionals seeking a no-code, user-friendly tool. It takes the work out of chart creation and generates picture-perfect graphs you can easily customize. Combining Jotform’s other tools, like AI Presentation Agents, allows you to create instant, reusable presentations that are useful for sales demos, training, and more.
Ultimately, choosing the best data visualization tools for your use case depends on where you store your data and how you plan to share your charts. Other solutions might be a better fit if you have large amounts of data or want to connect your data visualizations to a data warehouse.
FAQs
Jotform AI tools rank among the best solutions for making charts. They support data uploads from multiple sources and can export graphs for easy sharing. Jotform’s AI features allow you to create entire presentations using your charts and AI-generated scripts, which can save time on repetitive tasks such as sales demos.
ChatGPT can create charts and graphs using its advanced Data Analysis feature. Supported charts include bar, line, and pie charts; histograms; heat maps; and more. It also supports limited customization, such as adjusting graph colors and axis labels. However, the chart creation feature is available only to paid ChatGPT subscribers on the Go, Plus, or Enterprise plans.
Tableau stands out for its analysis tools, especially for users on the Tableau Next plan. This solution employs agentic analytics to uncover insights across all your data sources. For those with basic chart analysis needs, Microsoft Copilot and Datawrapper can summarize key insights.
This article is for business professionals, marketers, educators, data analysts, and small business owners who need to turn raw data into clear visual charts without advanced technical skills or design experience.


")


")


 increases productivity for your small business")


")


Send Comment: