If seeing is believing, creating buy-in for a novel idea requires more than just a persuasive pitch and rosy promises.
Anyone who invests their time, money, or effort into your ideas will want to see the figures that back up your claims.
After all, they need to be convinced that you’ll make good on your promises.
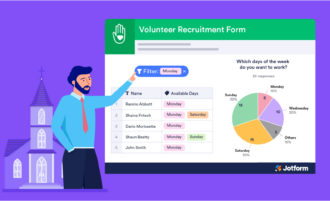
Jotform Report Builder can help you win over decision-makers and stakeholders by turning data from online forms into customizable and shareable reports.
Once people fill out and submit your online forms, Jotform Report Builder allows you to turn that information into attractive presentations within a matter of minutes.
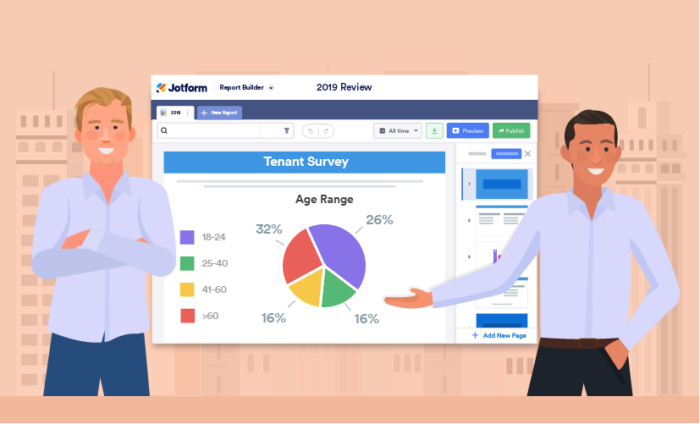
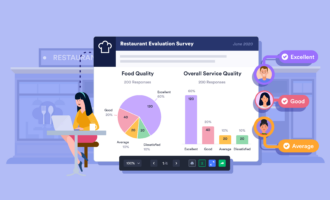
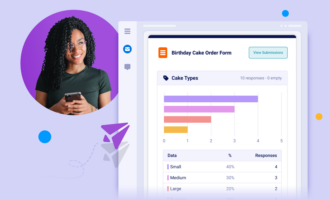
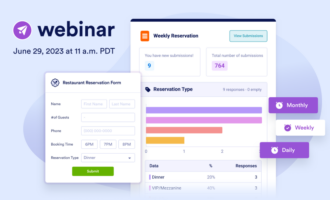
Jotform Report Builder’s design tools enable you to use a variety of different graphs or charts, add elements that clarify your data, and control the overall look and feel of your presentation.
It’s also easy to share your polished presentation as a dedicated link in a personalized email or to embed it on a website. You can even control who can view your report, what they can do with it, and how long they can access it.
This well-oiled workflow eliminates hours of unnecessary manual work and reduces your dependence on other software to get the job done.
User spotlight: How a property manager uses Jotform Report Builder

Jeffrey Froom and James Huff are tackling a big problem.
Their property management and development company, Live Easy, is addressing a pressing need for safe, affordable rental housing in South Africa by acquiring land or existing buildings and converting them into residential complexes.
These repurposed properties include apartments with en suite bathrooms and kitchenettes that are an average of 15 square meters (161 square feet), as well as modern amenities, such as workspaces, gyms, laundromats, sports courts, gardens, and play areas.
Live Easy is geared toward renters who make 3,500 to 15,000 South African rand (about $206 to $882 USD) every month and can set aside an average of 2,450 rand ($143 USD) for rent each month.


According to its website, Live Easy seeks to “transition those people currently living in undesirable conditions into a safe, secure, and well-managed housing environment.”

Live Easy relies on Jotform to collect information from prospective and current tenants at the company’s 10 residential properties in Germiston, Johannesburg, and Pretoria.
Online forms allow Live Easy to take action quickly and respond promptly.
Back-office staff, for instance, receive a notification email once someone fills out a housing application form on Live Easy’s website. This allows them to quickly pull up any submitted information and run a credit check on applicants.
“In South Africa, we’re finding that not a lot of people have things online,” Froom says. “If you walk into a building and want to apply for a unit, you have to write out your name, surname, and other information on paper. That paper gets taken to an office where they’ll do the credit check, and the paper comes back for tenants to sign.”
At practically every stage in the process, from the time they apply and qualify for a unit until they eventually decide to leave, tenants share information with Live Easy through Jotform’s contact forms, lease agreements, membership registration forms, and other forms.
“We’re using all of Jotform’s tools to capture information,” Froom says. “Instead of printing out papers, people can just sign forms online, and all of the information is there for us.”
But since that data was imported into a spreadsheet program, analyzing demographic data for marketing purposes and sharing statistics on tenants and housing applicants with investors used to take hours.
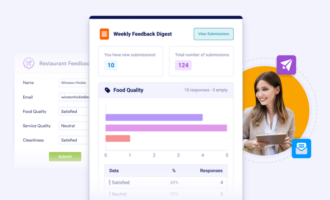
Jotform Report Builder can now streamline the data visualization process by quickly turning submitted form information into clear reports that yield practical insights.
These reports can either be generated automatically — with one or two charts on each page — or built from scratch.
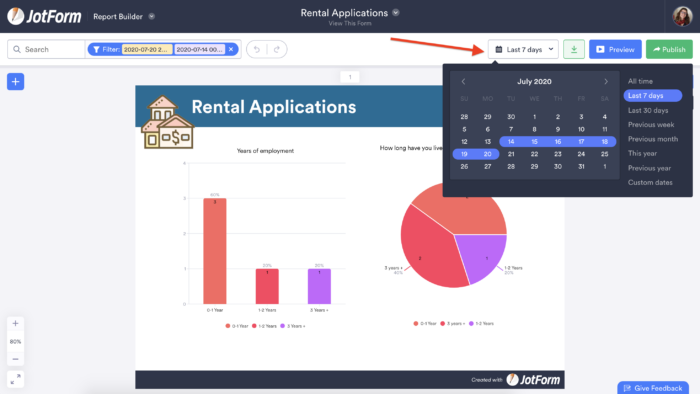
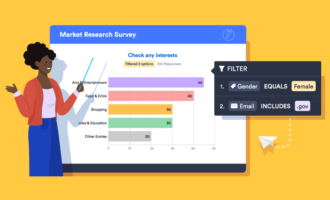
Rather than wading through rows of data in a spreadsheet program, with Jotform Report Builder, you can easily narrow down the information that’s reflected in graphs or charts, based on when online forms were submitted.
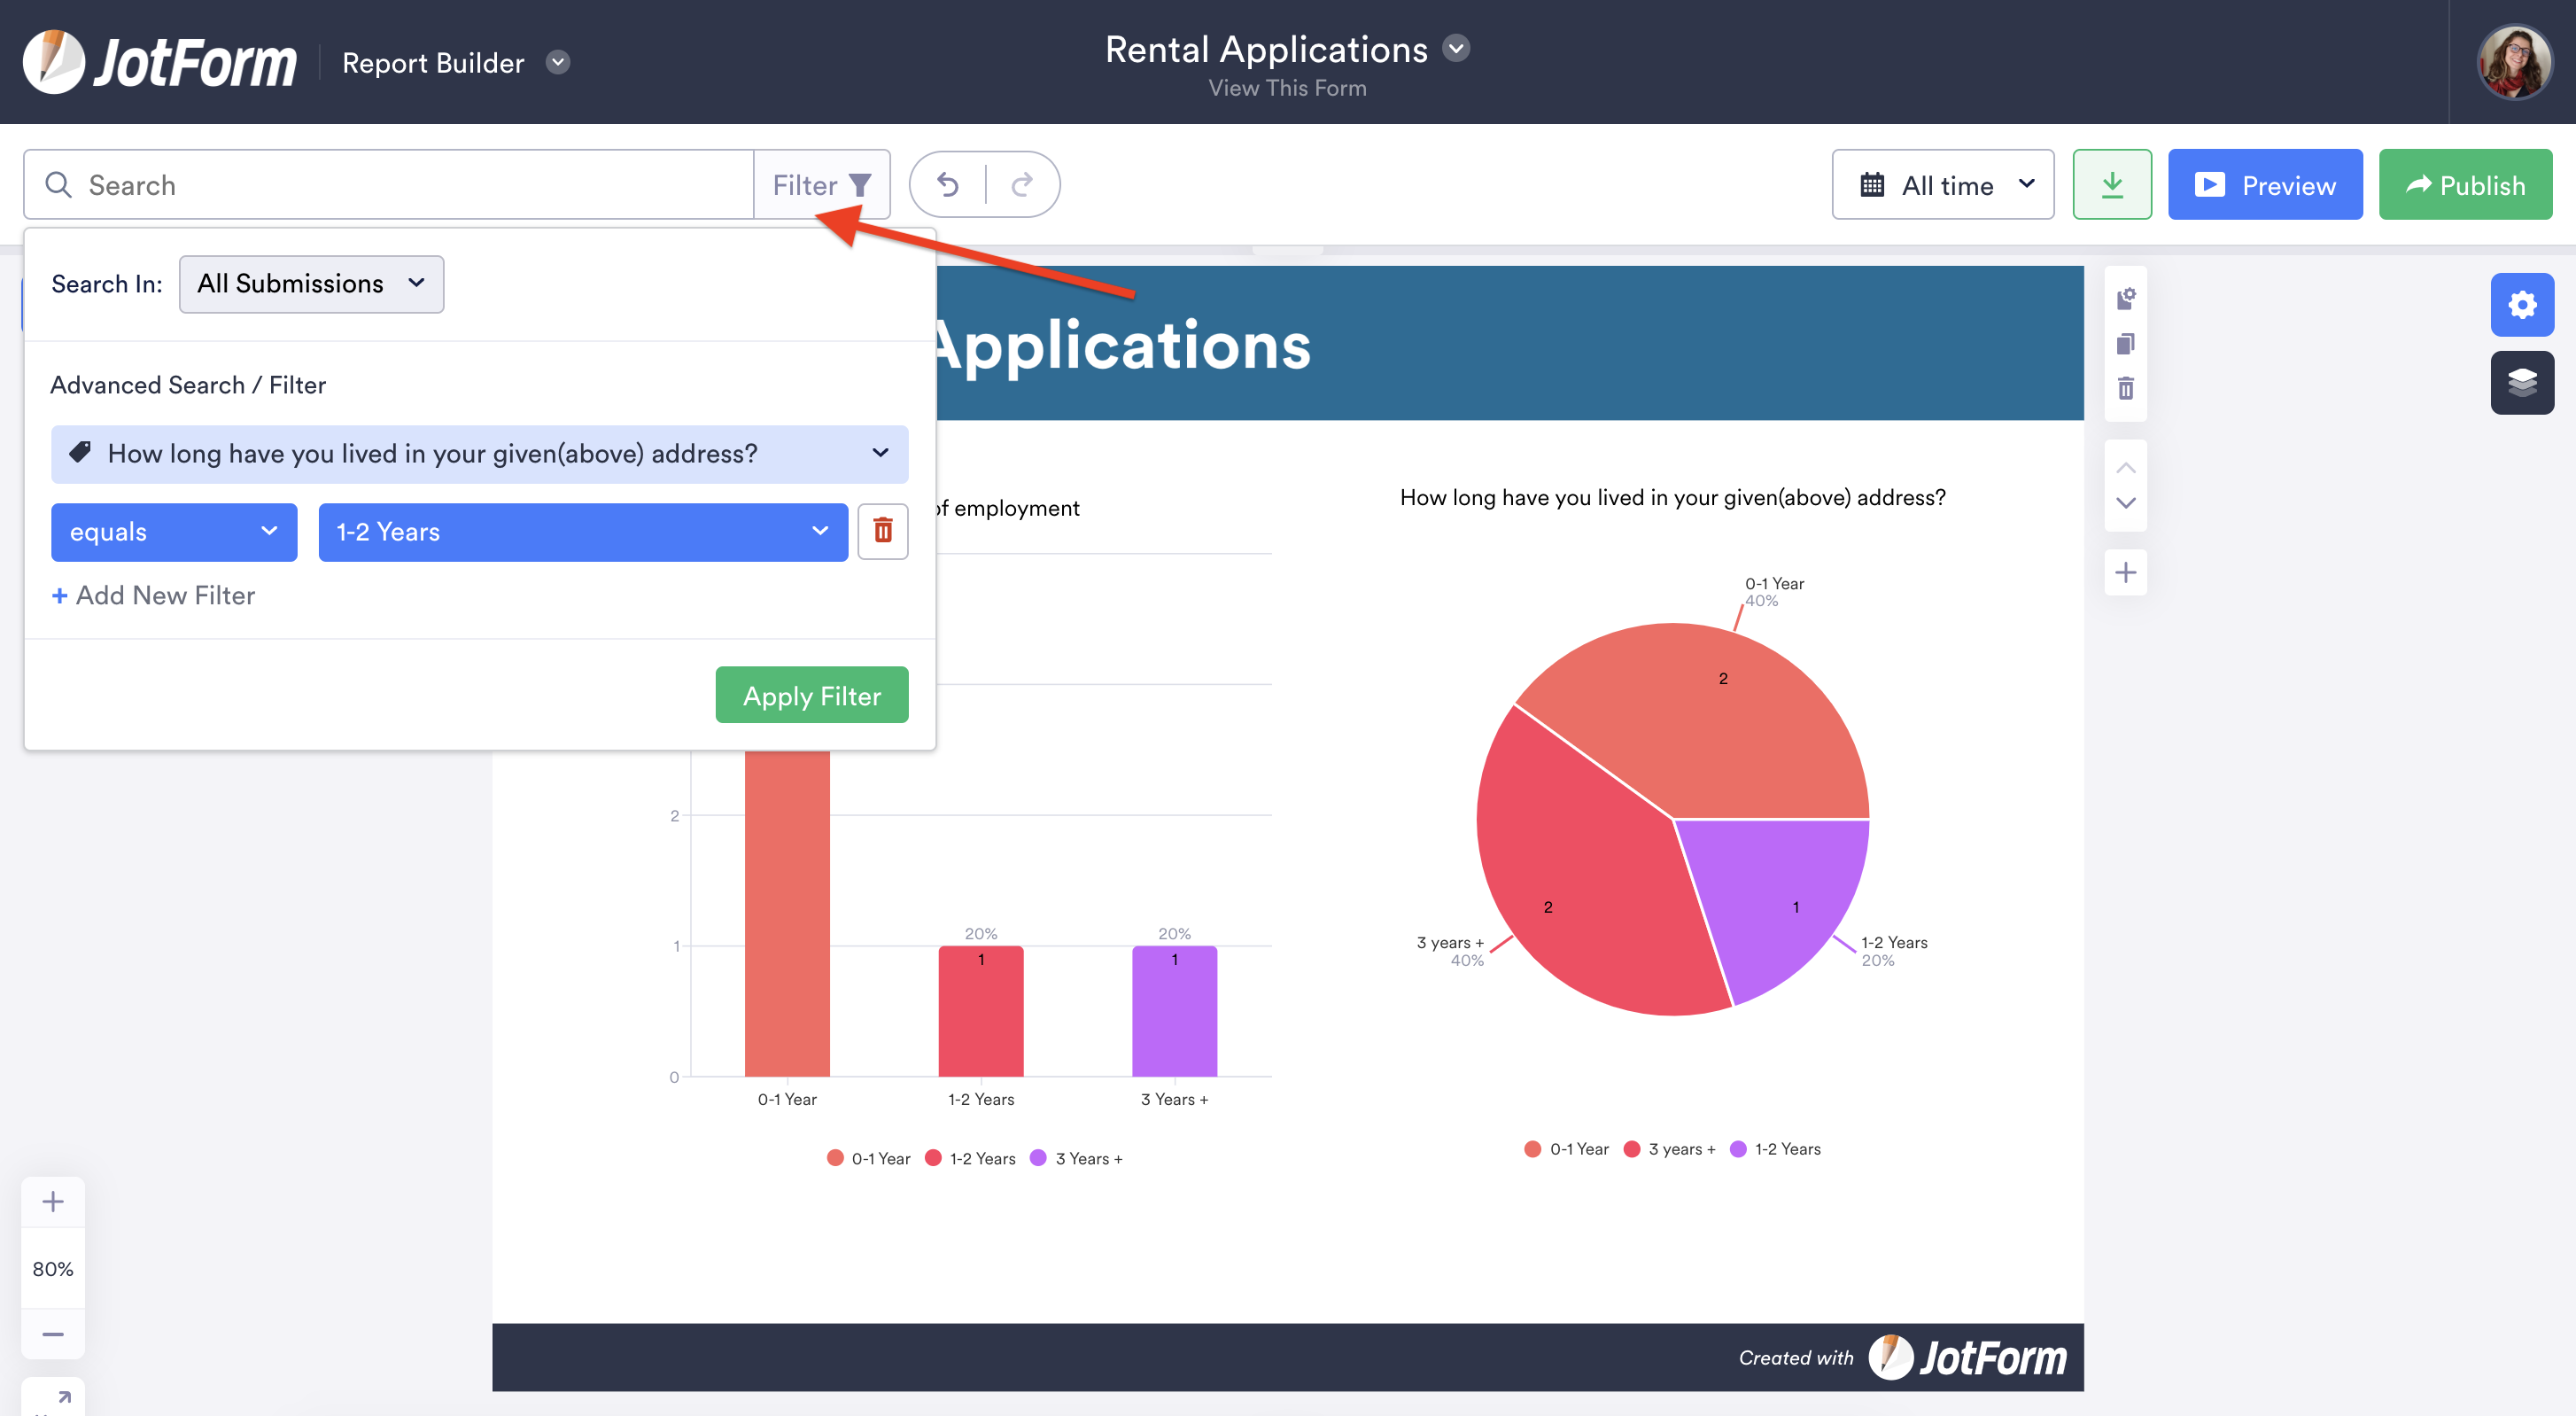
You can narrow the information displayed in a report even further by limiting your analysis to specific data points, such as location, age ranges, company departments, or other listed answers to questions.
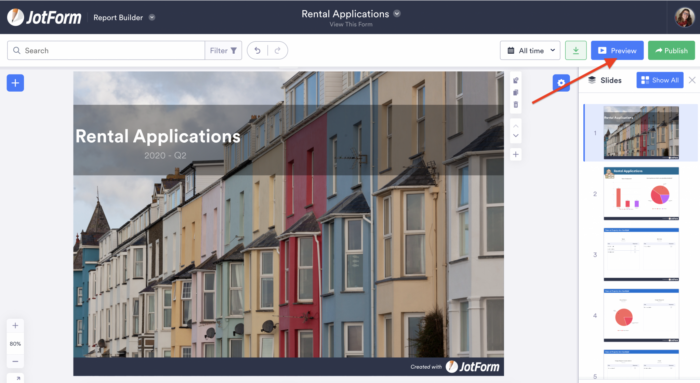
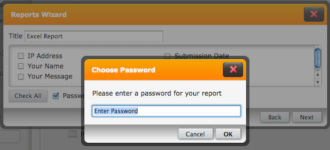
After you’ve constructed your professional-looking report, Jotform Report Builder allows you to review the final product, save it as a PDF, or print it from preview mode.
With these new report generation capabilities, Jotform can help Froom track the progress of Live Easy’s initiatives, keep investors in the loop, and drum up additional support.
Jotform Report Builder can even help Froom create targeted marketing campaigns by making it easier to analyze the key demographics of tenants in each building, such as where they work, where they previously lived, and how long they’ve lived in the same place.
“For me, it’s going to be an analytical tool,” Froom says.
Conclusion
Getting people on board with an idea often requires you to create realistic value propositions and back them up with hard numbers.
But analyzing, visualizing, and sharing data can be a painstaking process that takes valuable time away from other urgent tasks.
Jotform can help you reclaim a good chunk of your day by quickly turning submitted information from online forms into reports that will turn heads.
With the design tools, sharing options, and privacy settings that you need to maintain control over your report at all times, Jotform Report Builder is a comprehensive solution that can turn a daunting sea of data into graphic elements that are easy to follow.
If you haven’t done so by now, give Jotform Report Builder a try today! See how Jotform is helping millions of people all over the world do more with their data and cut through the clutter that clouds their message.


Send Comment:
1 Comment:
August 13, 2020
Pourquoi vous n'ajouter d'autres langues comme le fracais dans vos formes et vos messages?