
Reports are essential for everything from keeping your stakeholders up to date to analyzing the success of your current business ventures and strategically planning your next efforts. Using report generation software makes it easier to gather data and produce the quality reports you need to support your business.
What is report generation?
Report generation refers to the process of using a tool to generate or collect the data that you’ll include in a report. Many businesses use report generation to collect and condense data into a document that makes it easy to review productivity, profits, losses, and other important details.
Report generation is helpful in many ways. It prevents you from having to manually create reports, which saves significant time and lets you focus on other business processes that truly require your attention.
When you use a report generator, you also remove the potential for human error from the process, making your data more accurate.
Using a report generator saves a lot of time. If you manually prepare reports, you’re often constrained to producing reports quarterly or monthly. With report generation, you can create reports more frequently.
Using technology to streamline the process means that you could potentially create reports monthly or even weekly. These more frequent reports make it easier to keep close tabs on the status of your business, letting you quickly identify issues and make informed decisions to help support your company.
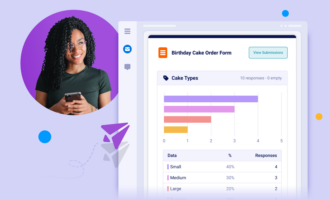
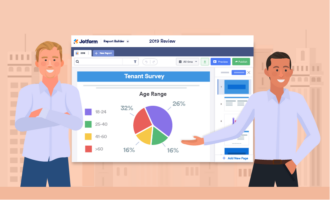
Report generators also make it easy to quickly present the same information in multiple formats. You can easily filter and process data into charts, graphs, tables, and more, making it simpler to review that data.
What is report generation software?
Reporting tools and software gather data from multiple sources and then produce tables, charts, and other types of presentations. The software makes the information easier to understand without requiring human intervention to process and format it.
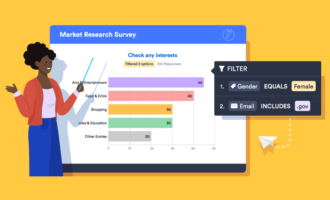
A quality report generation tool will be able to pull from multiple data sources, including databases and spreadsheets. It can process that data into file formats like Excel, CSV, and PDF, so you don’t have to worry about converting the data into your desired format.
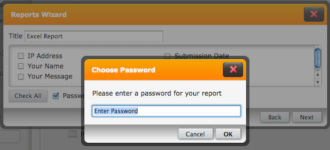
Quality generation tools also give you control over who can access your data. This feature is particularly important when it comes to maintaining data privacy and protecting your business information. An ideal tool will give you the ability to set permissions not only for all of the data but also for individual reports or even specific cells.
You can choose from many different report generation tools, like Hive, Tableau, Google Data Studio, and ProWorkflow. These tools are available at different price points, and some are even free to use. When you’re choosing the right tool for your needs, it’s important to select a tool that supports the type of reports you produce most often.
What are your automation options?
As you explore different report generation tools, you’ll find that some offer full automatic generation, while others offer semiautomatic generation. Both options have their advantages.
Full automatic generation tools typically have templates that you can use to build your report. You can edit the templates to suit your needs and then drag data into the template cells where you want it to appear. This method is quick, but it can limit the overall report design.
Semiautomatic generation gives you more customization options, letting you truly tailor the report to your needs. It does require a bit more work than full automatic generation, but the results you get are often well worth the extra effort.
To create a semiautomatic generation report, you’ll need to design that new report and configure and specify your data sources. You’ll also need to format the report and then ultimately review, save, and publish it.
What are the different types of reports you can generate?
Before you choose a report generation tool, it’s important to determine the types of reports you’ll need to create. We’ve included some of the most common data-driven report types below that you would be most likely to create with a report generation tool.
Periodic reports
Periodic reports are the most common type of report. They’re generated at consistent intervals, such as yearly, monthly, or quarterly. Because the reports are scheduled and reflect the same time frames, they’re useful for comparing the performance of your business across these time periods.
You can use periodic reports to track different performance elements. For example, you can generate social media reports and marketing analytics reports periodically so you can quickly see the performance of your marketing campaigns.
Analytical reports
Analytical reports are highly detailed, data-driven documents that allow you to analyze information like your business transactions and revenue.
Marketing dashboards
Marketing dashboard reports provide a look into your real-time marketing efforts. They’re a quick glance at your current strategies, including your marketing spend, your active channels, and your marketing campaigns.
Internal reports
Internal reports are company reports that help keep teams informed about certain topics and important updates or announcements. You may send them to your entire organization to keep all of your staff aware of updates and news as well as to share performance metrics and important data.
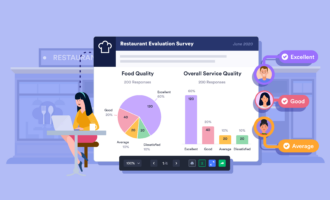
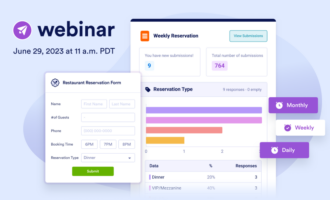
Visual reports
You can present nearly any report in a visual form. Visual data reports make it easier to interpret data clearly and quickly. With visual reports, people don’t have to sort through rows of spreadsheet data, as visual reports make the significance of the data readily apparent.
With a tool like Jotform Report Builder, you can easily convert data into visual reports. You can organize data submissions in the ways that best reveal insights, whether that’s with charts, graphs, or other visual media. These visual reports are ideal for sharing with your teams, your whole company, and with stakeholders.
What are some best practices for creating reports?
As you create reports, following certain best practices can help ensure that you get maximum value out of each document and the effort that went into it.
Ensure consistency
Reports are valuable because they let you measure the data from one time period against the data from a previous time period. You can most easily accomplish this when your reports are consistent.
Think about how you can stay consistent in the measurements you use, the time periods you measure, and even the location in the report where you present the information. The more consistency you can provide, the easier it will be to compare the reports to each other.
Incorporate your branding
Look for ways to incorporate your branding into every report, especially if you’ll be releasing them to the public or to your stakeholders. You can accomplish this by adding your logo to your report headers and by including your branding colors in section headers.
If you’re creating a visual report, you might have the opportunity to add photos of your products, social media posts, and other elements for an extra personalized touch.
Keep your design clean
Reports can easily become too cluttered, which makes them overwhelming and difficult to read. Focus on a clean design with plenty of white space. If you’re printing your reports, it’s important to opt for a large font that’s easy to read. Use dark colors against a white or light-colored background, and resist the temptation to incorporate graphics or logos into the background, which can make the information more difficult to read.
Set milestones
It can be difficult to determine successes and measure your data if you don’t have anything to compare it to. Milestones create benchmarks that can help you recognize when you’re succeeding and when you need to improve your organization’s performance.
Work with your team to establish milestones for the data you’re including in your report. Be sure to include those milestones in every report so it’s easier to measure all of the information you’re presenting.
Stick to the point
When you’re working with a large amount of data, it can be tempting to include everything in a report. That’s not necessary, and it can be counterproductive if you make the report overwhelming to digest. Instead, think about the report’s purpose and audience, and include only the data that’s most relevant.
While initially designing a report can be more time-consuming, report generation software can help you streamline the process. Once you’ve created a report template, you can use that template for all of your future reports.
Of course, that means it’s important to put in the extra time and effort to get the template right from the start, so don’t hesitate to incorporate teammates and supervisors in the design process to ensure you create a report design that will serve your business well.
Photo by Andrea Piacquadio


Send Comment: