The Admin Console is home to a lot of information, including data and data analytics on your AI Agents. Here, you can view information on the Performance and Conversations, among other things.
AI Agents Analytics
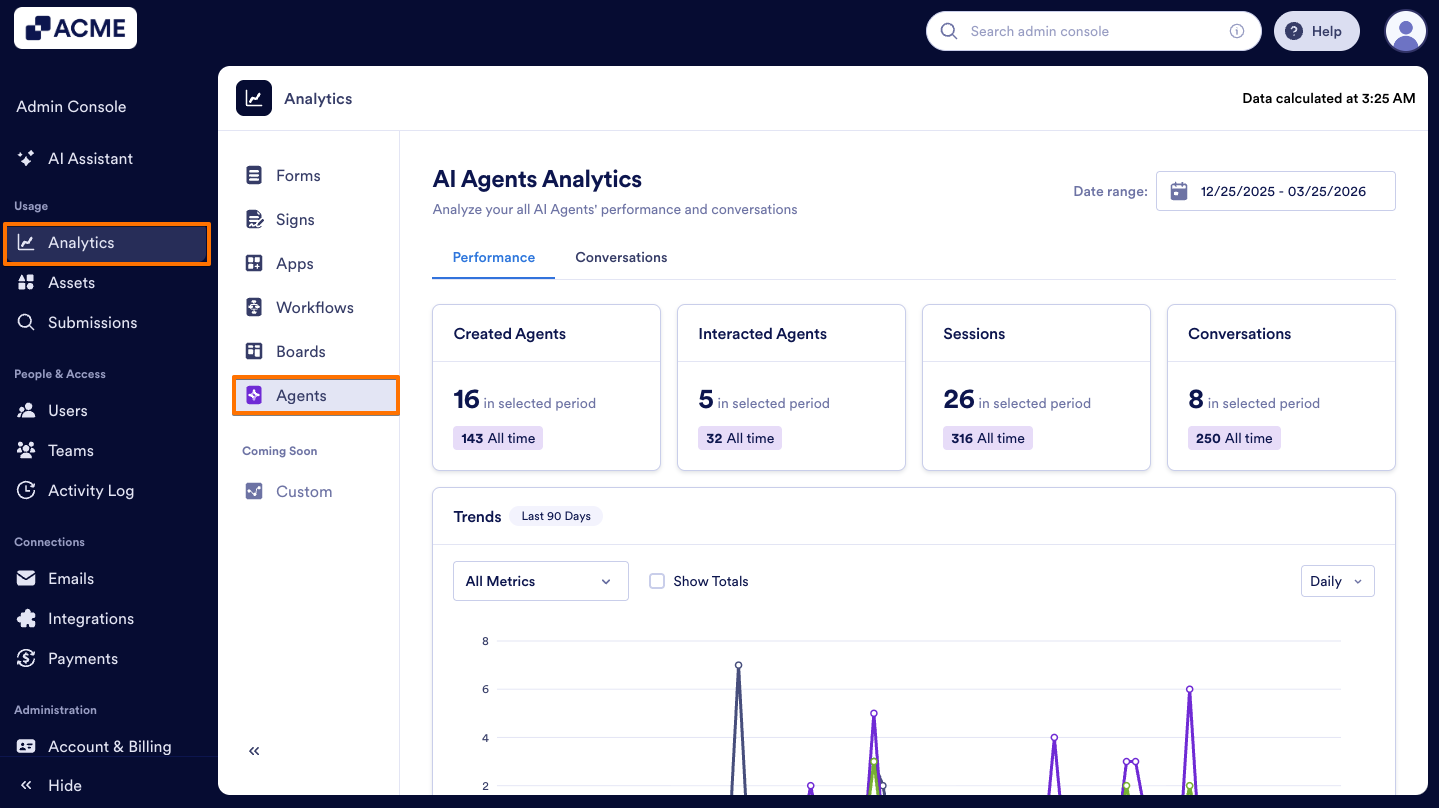
Let’s walk through how to reach the AI Agents Analytics page.
- In the Admin Console, click on Analytics on the left-hand side of the page.
- Next, click on Agents to open AI Agents Analytics data.
Note
Data in the Analytics tab updates every 5 minutes.
Performance Tab
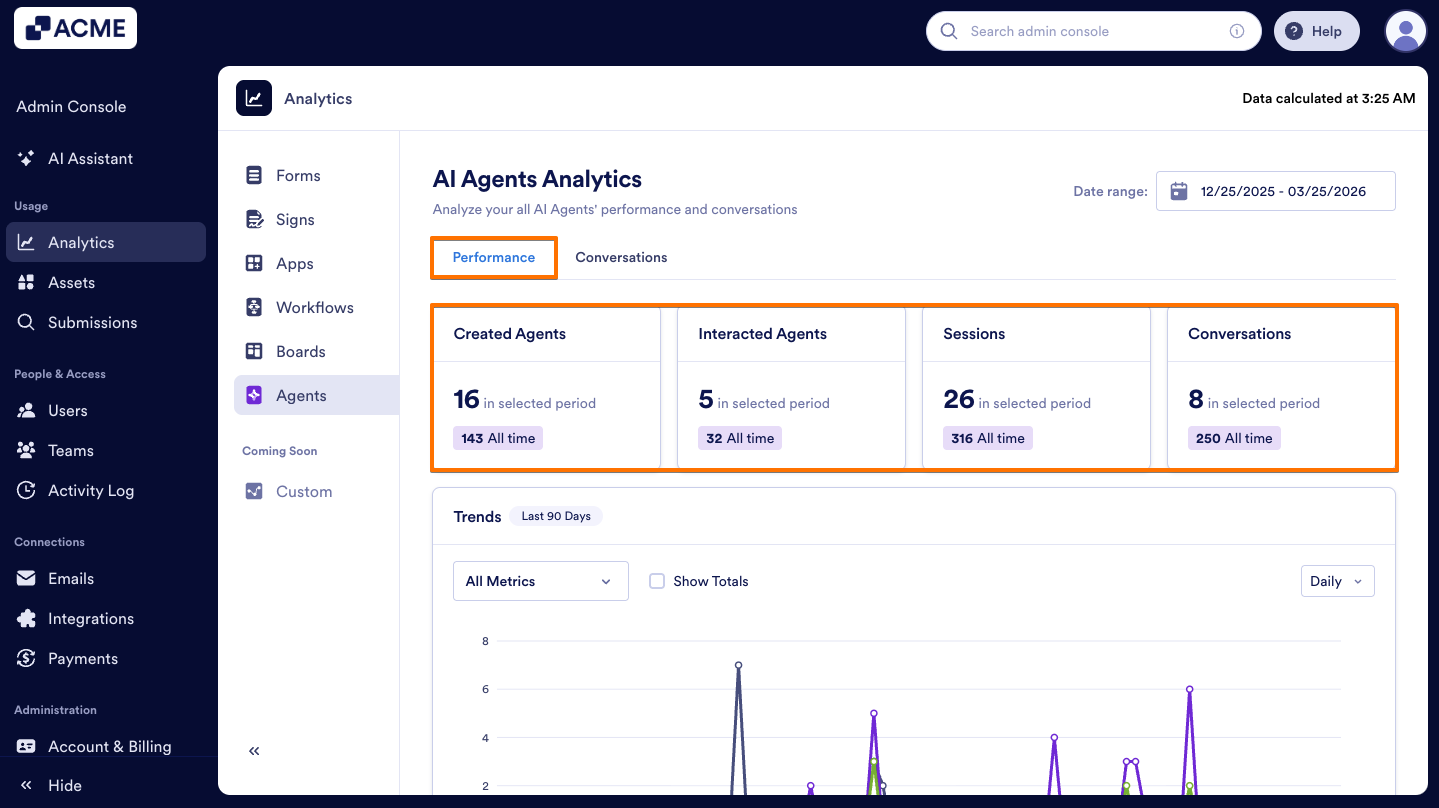
The Performance Tab focuses on overall agent activity and completion trends across your organization.
Performance Tab Metrics:
- Created Agents: The total number of agents created in the organization within the selected date range.
- Interacted Agents: The total number of distinct agents users sent messages to within the selected date range.
- Sessions: The total number of sessions started when users open a page with an AI agent, even without sending a message.
- Conversations: The total number of conversations that begin when users send a message to an agent.
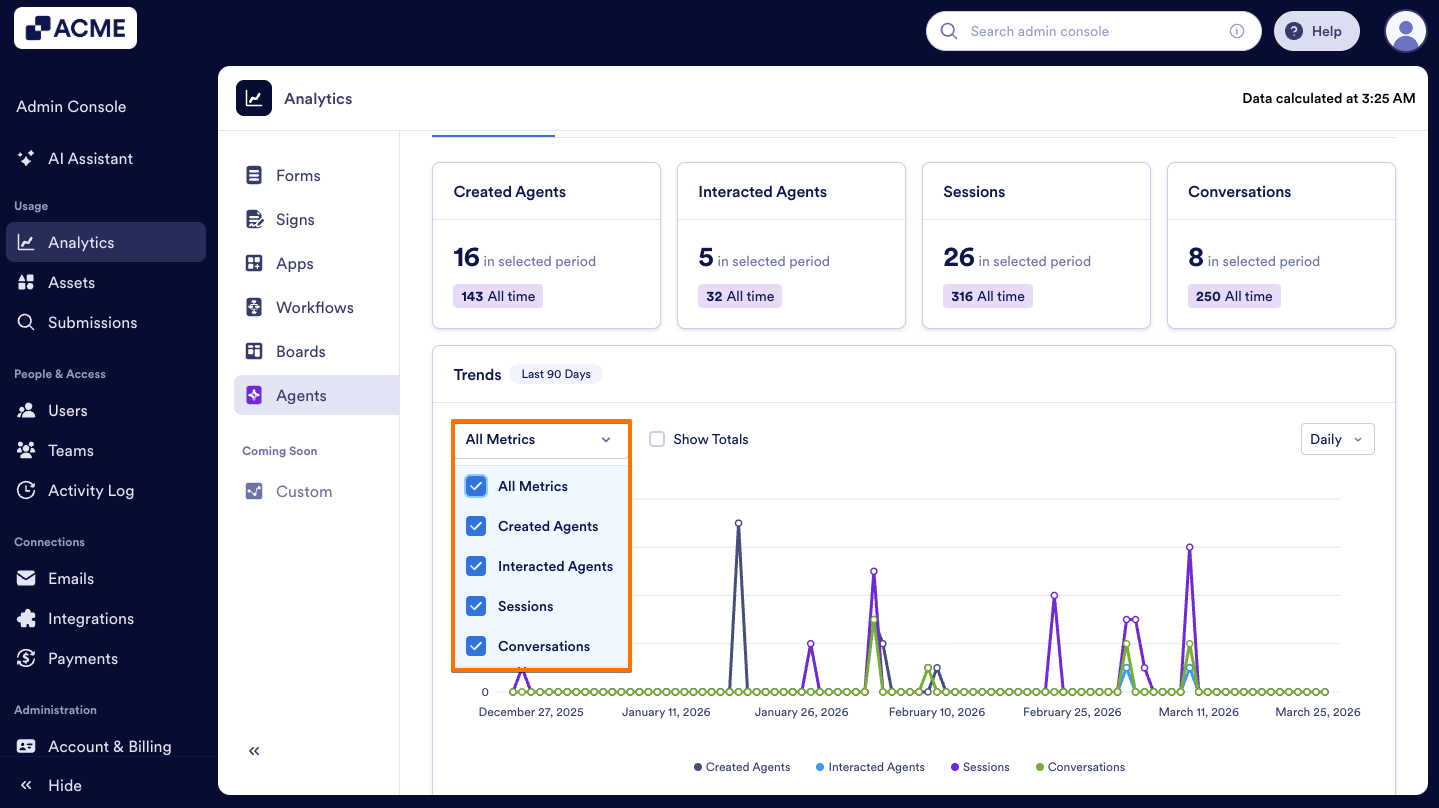
Trends Chart
There is a line chart under the Performance tab that visualizes the metrics given in the cards above. As an admin you can track your organization’s AI Agent performances through the selected date range. You can decide which metrics to include or exclude from the metrics above and change the date format from daily or weekly. Here's how:
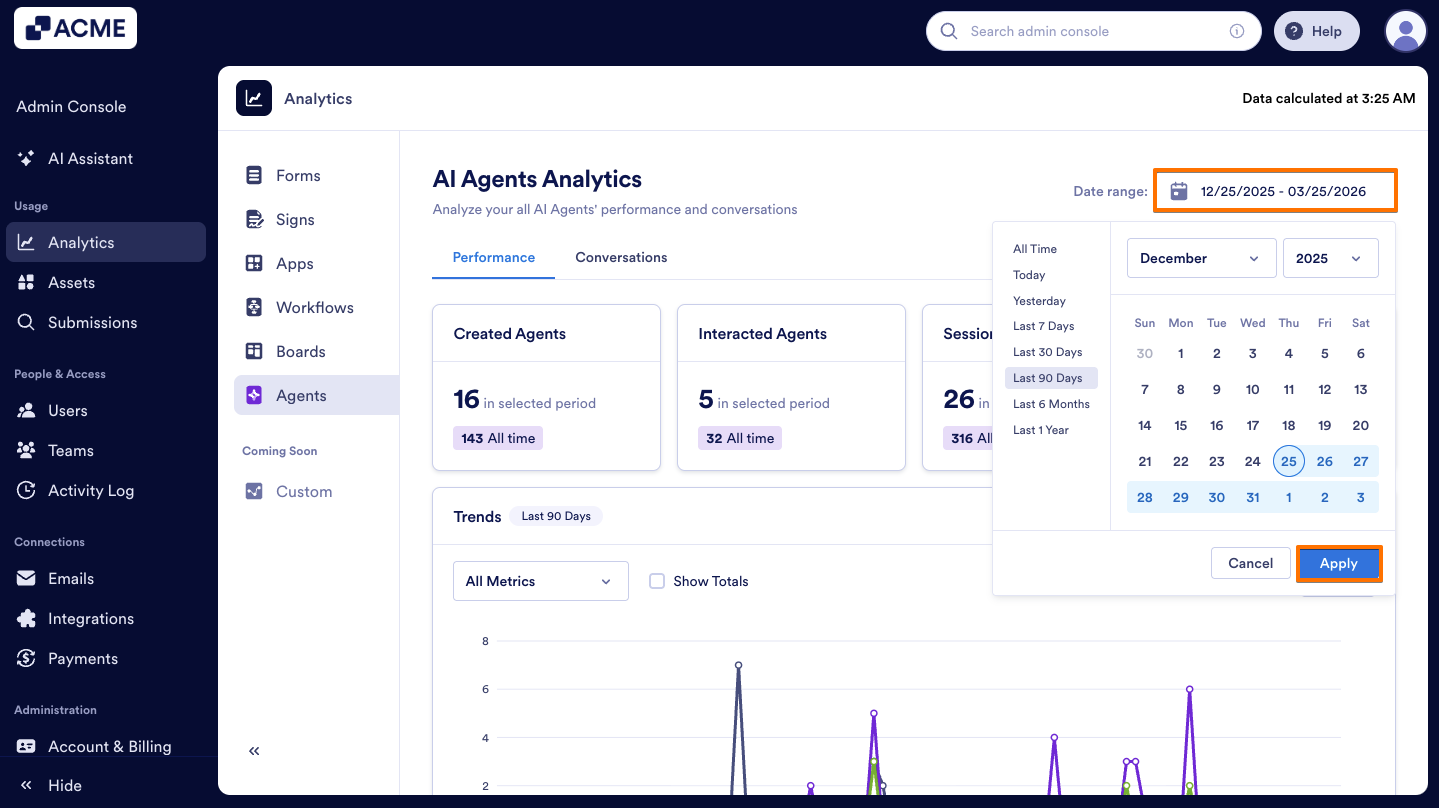
- In the Performance tab, click the Date Range selector in the upper-right corner, choose your desired range, and then click Apply.
- Next, from the Dropdown menu, choose the metrics to include (created agents, interacted agents, sessions, and conversations).
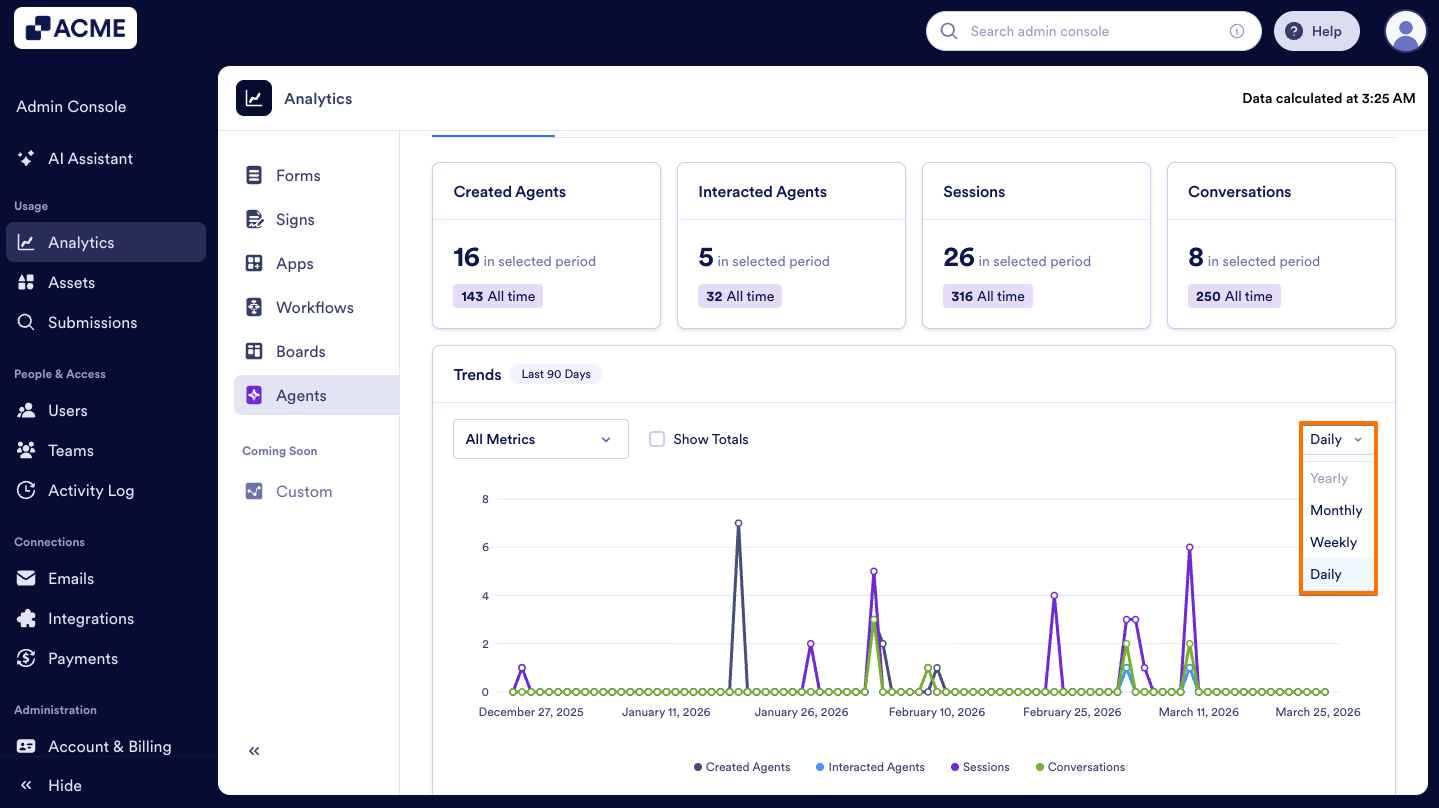
- Finally, set the view to Daily, Weekly, Monthly, or Yearly.
Note
When the date range is selected in the Performance tab, the selection will be applied to the Conversations tab metrics.
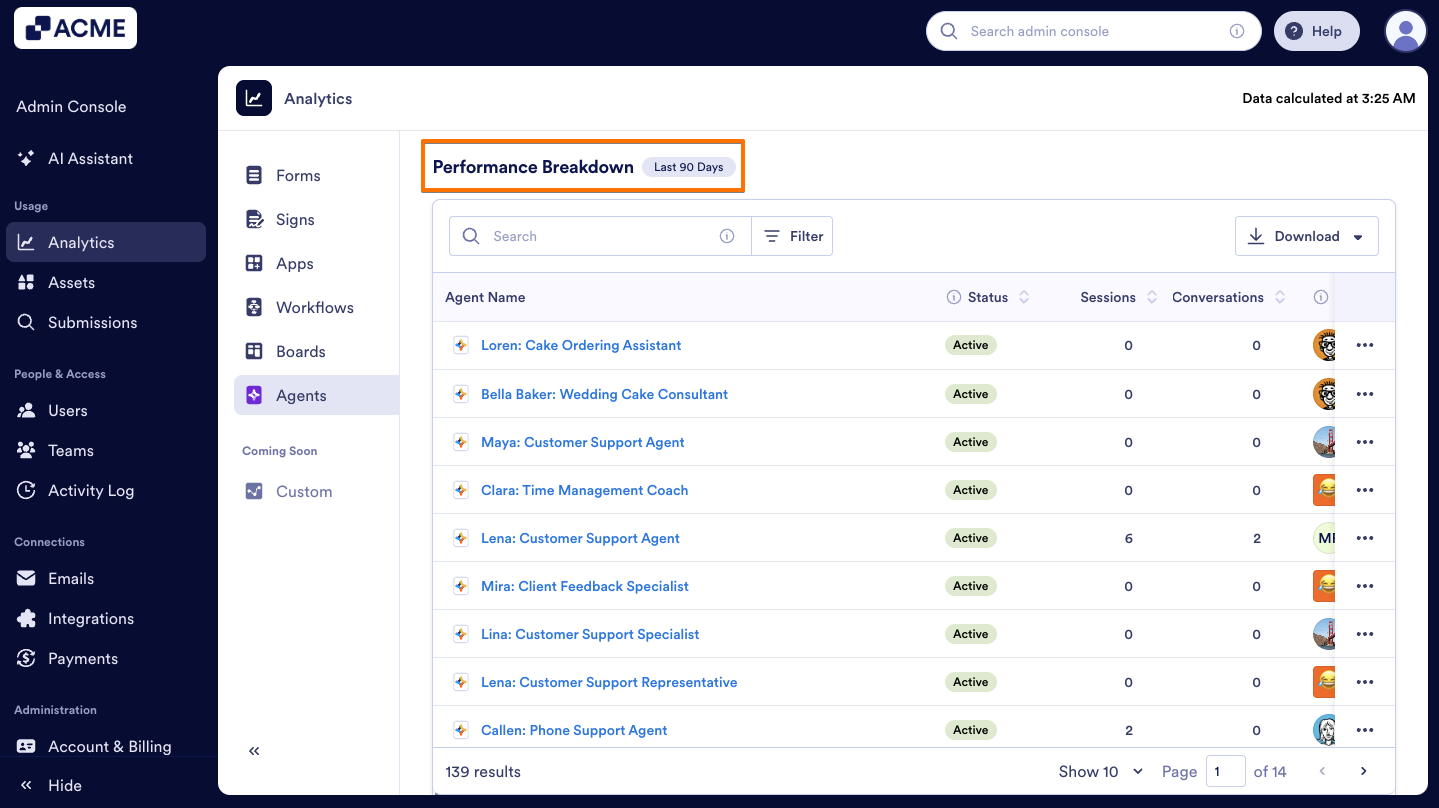
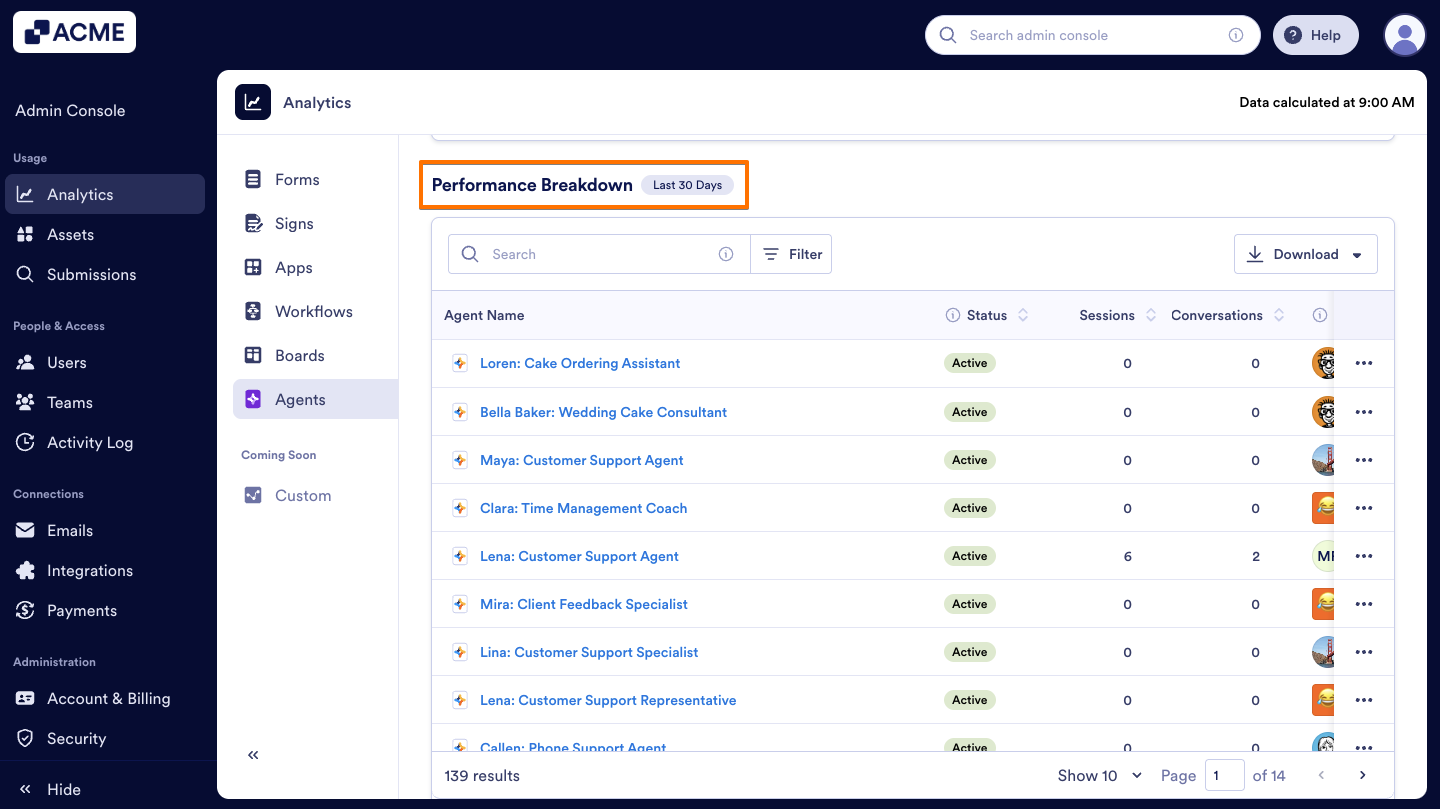
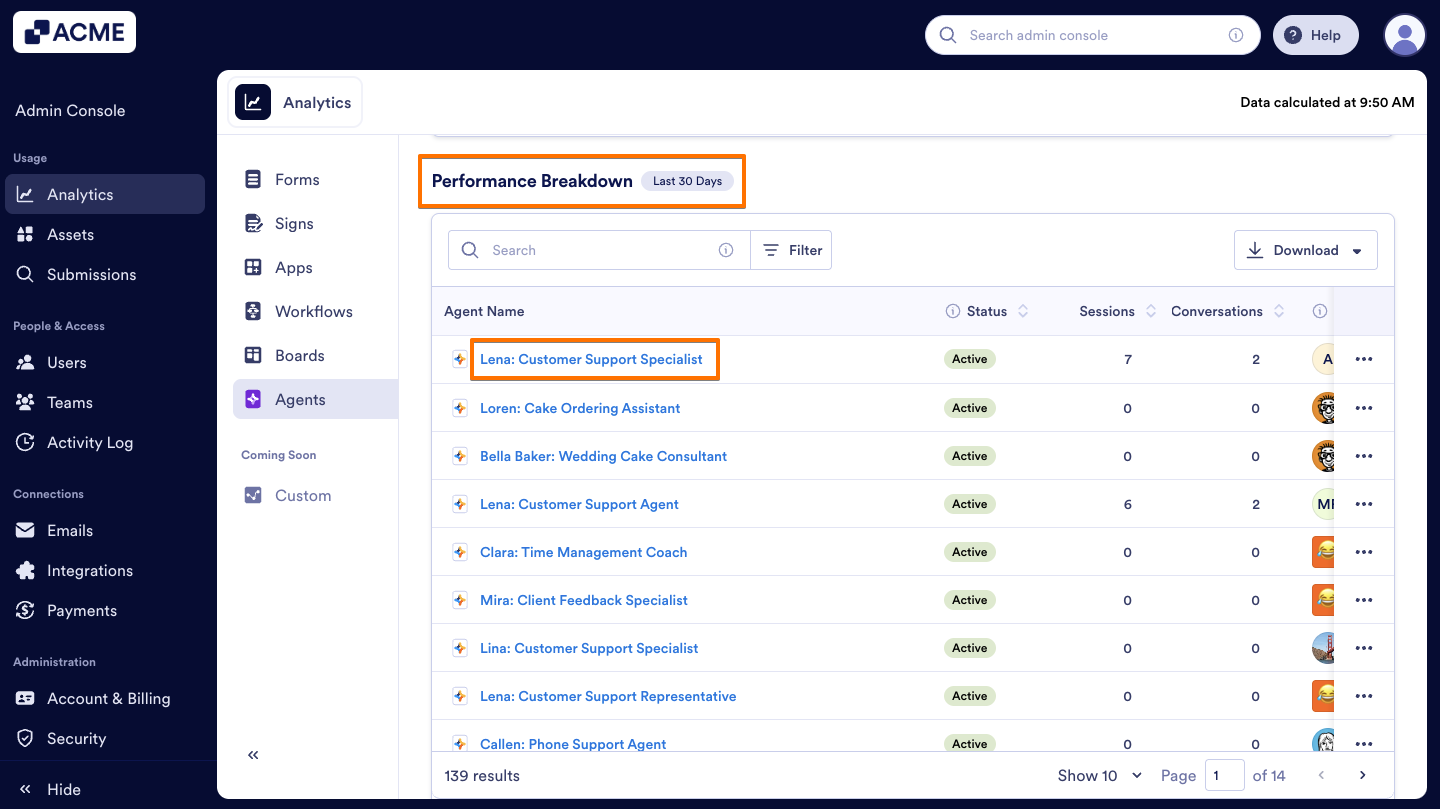
Performance Breakdown
In the Performance Breakdown section, you will see the distribution of all Agents created across the organization based on the selected date range. The list shows each Agent name, Status, the number of Conversations and Sessions, and the Agent Owner. Let’s walk through the steps:
- On the AI Agents Analytics page, in the Performance tab, scroll down to the Performance Breakdown list to view all agents.

- To View Analytics or Preview a single agent, click on the Three dots icon next to the agent you want to access and select the option.

Filter AI Agents
In the Performance Breakdown section, you can filter AI agents to view details such as Status, Sessions, Conversations, and Owner. Here’s how:
- On the AI Agents Analytics page, while in the Performance tab, scroll down to the Performance Breakdown section.

- On the right side of the Search bar, click on Filter.
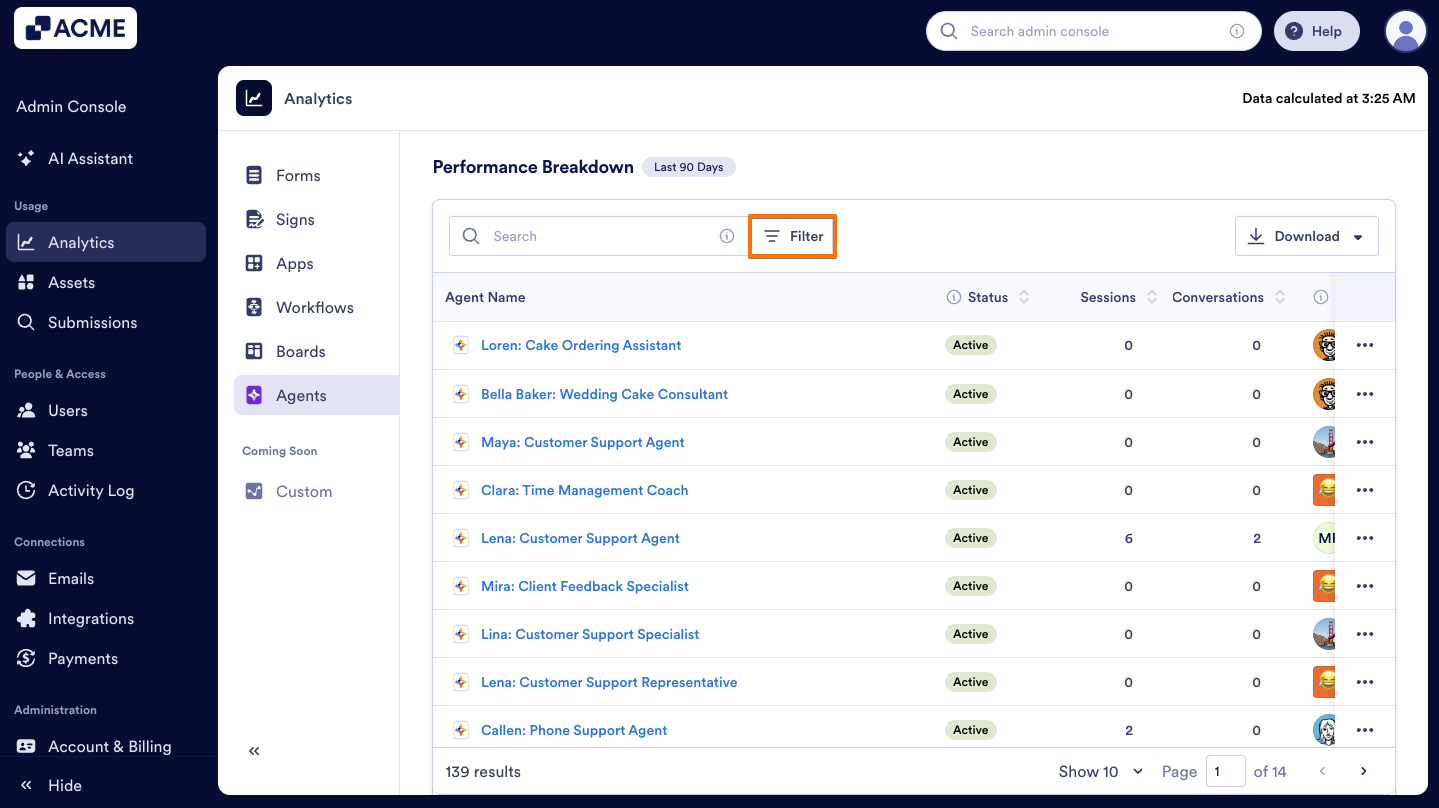
- Select the Asset Owner or the Agent’s Status based on your needs.

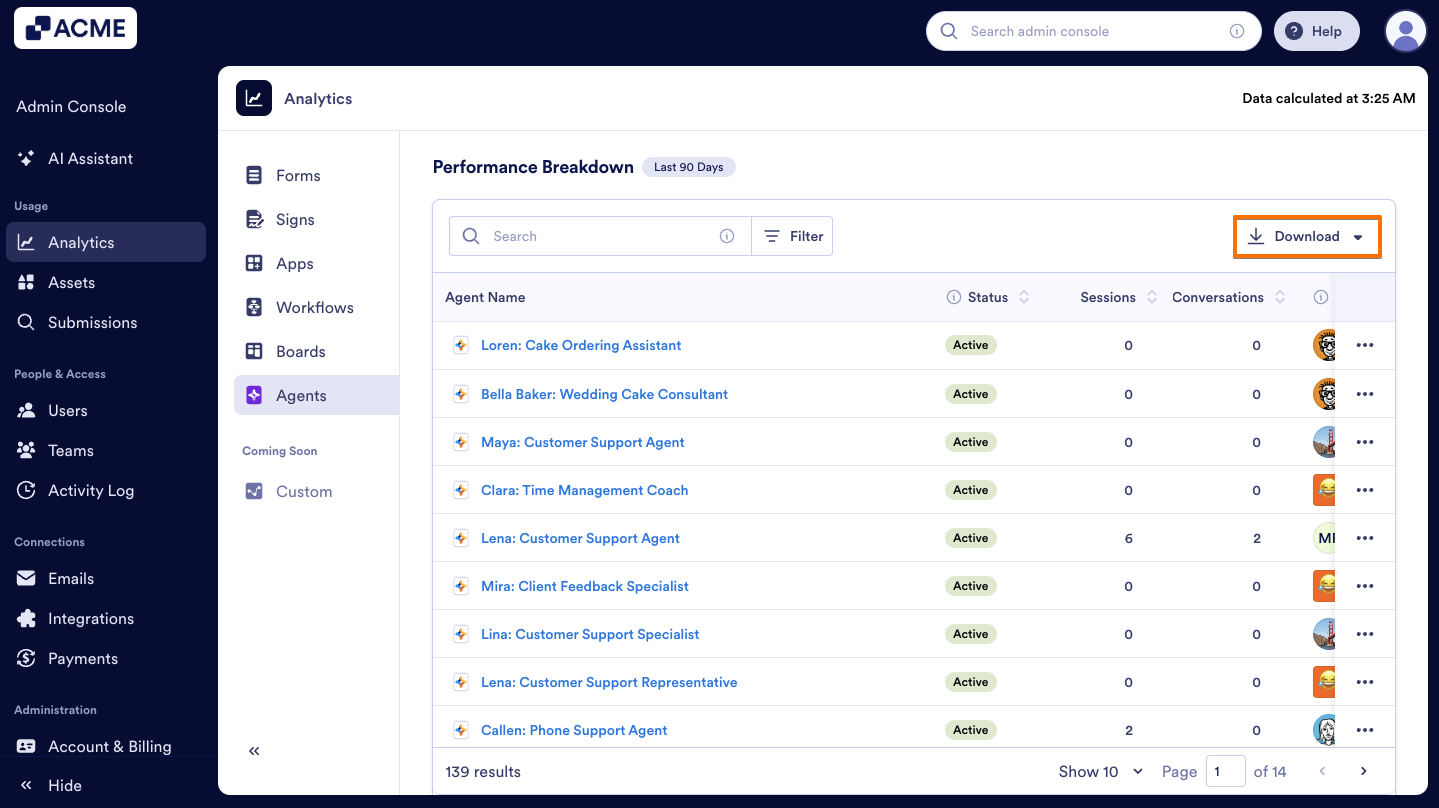
Download AI Agent Data
In the Performance Breakdown section, you can also download AI Agent data, that includes the Agent ID, Agent Name, the number of sessions among other things:
- On the AI Agents Analytics page, while in the Performance tab, scroll down to the Performance Breakdown section.
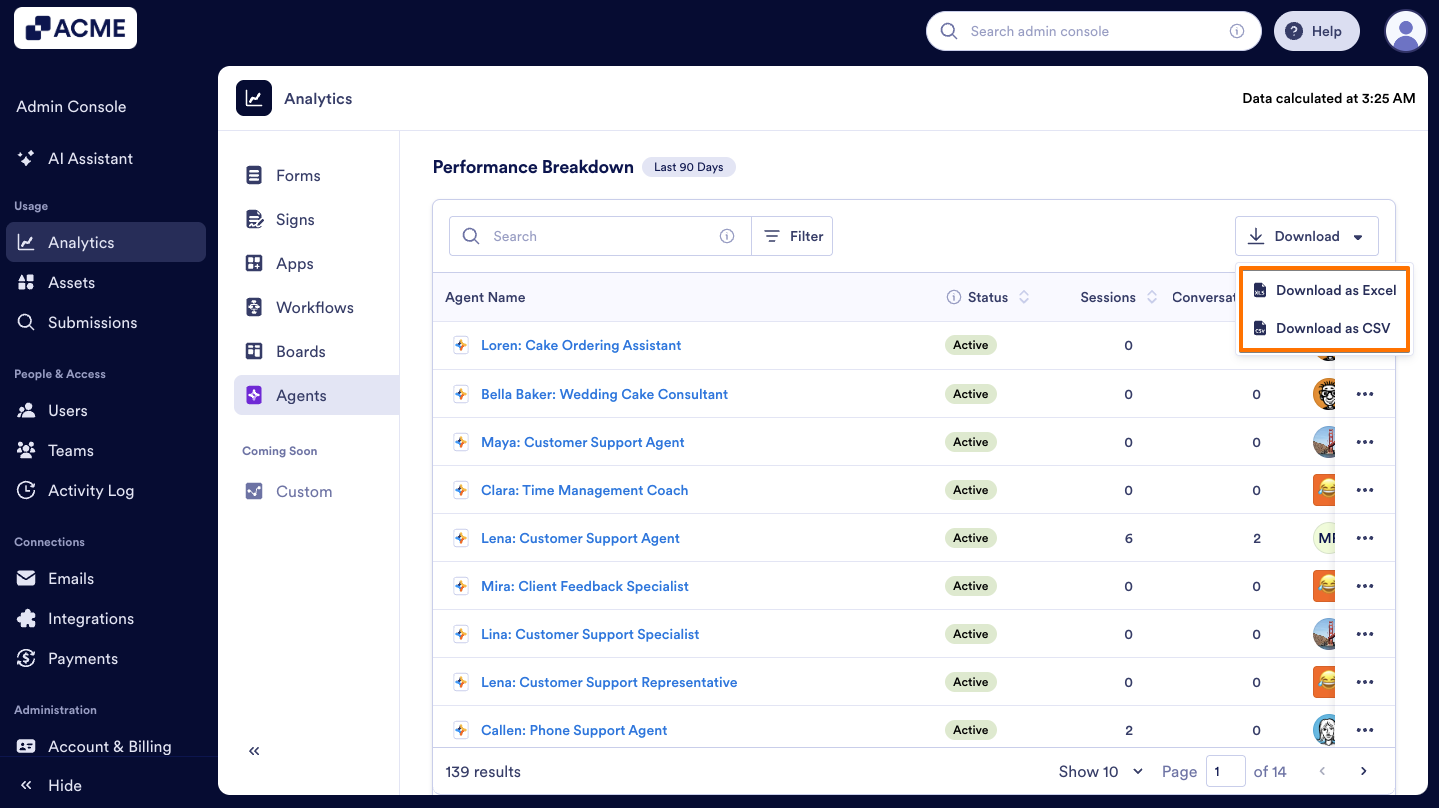
- On the upper right side of the list, click on Download.
- Select the download type, either Excel or CSV.
Conversations Tab
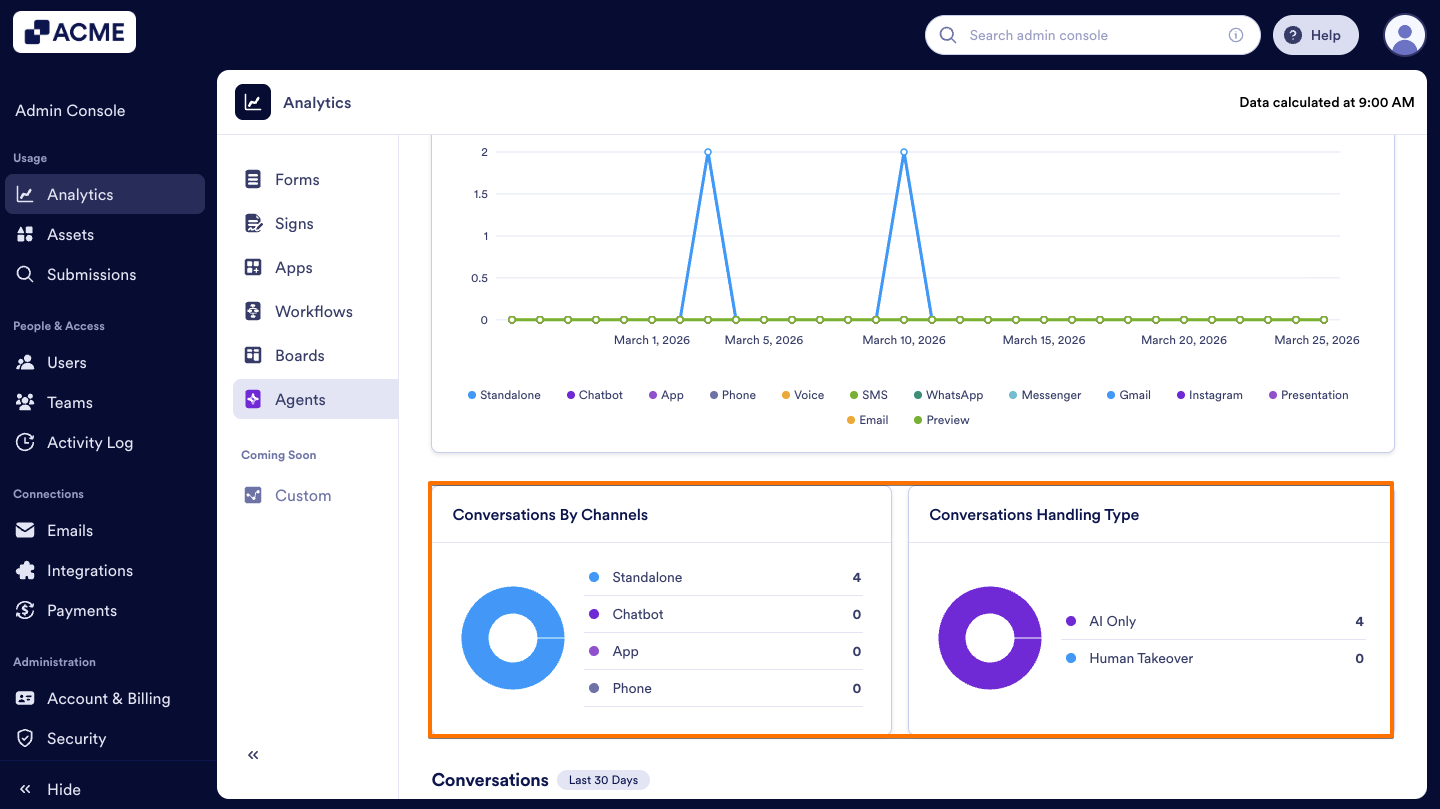
The Conversations Tab provides insights into how and which channels your conversations are handled.
Conversations Tab Metrics:
- Conversations by Channels: The distribution of conversations based on the different channels where they were initiated such as chatbot, presentation, Gmail, standalone etc.
- Conversations Handling Type: The distribution of conversations according to whether they were handled entirely by AI or involved a human takeover.
Let’s walk through the steps together:
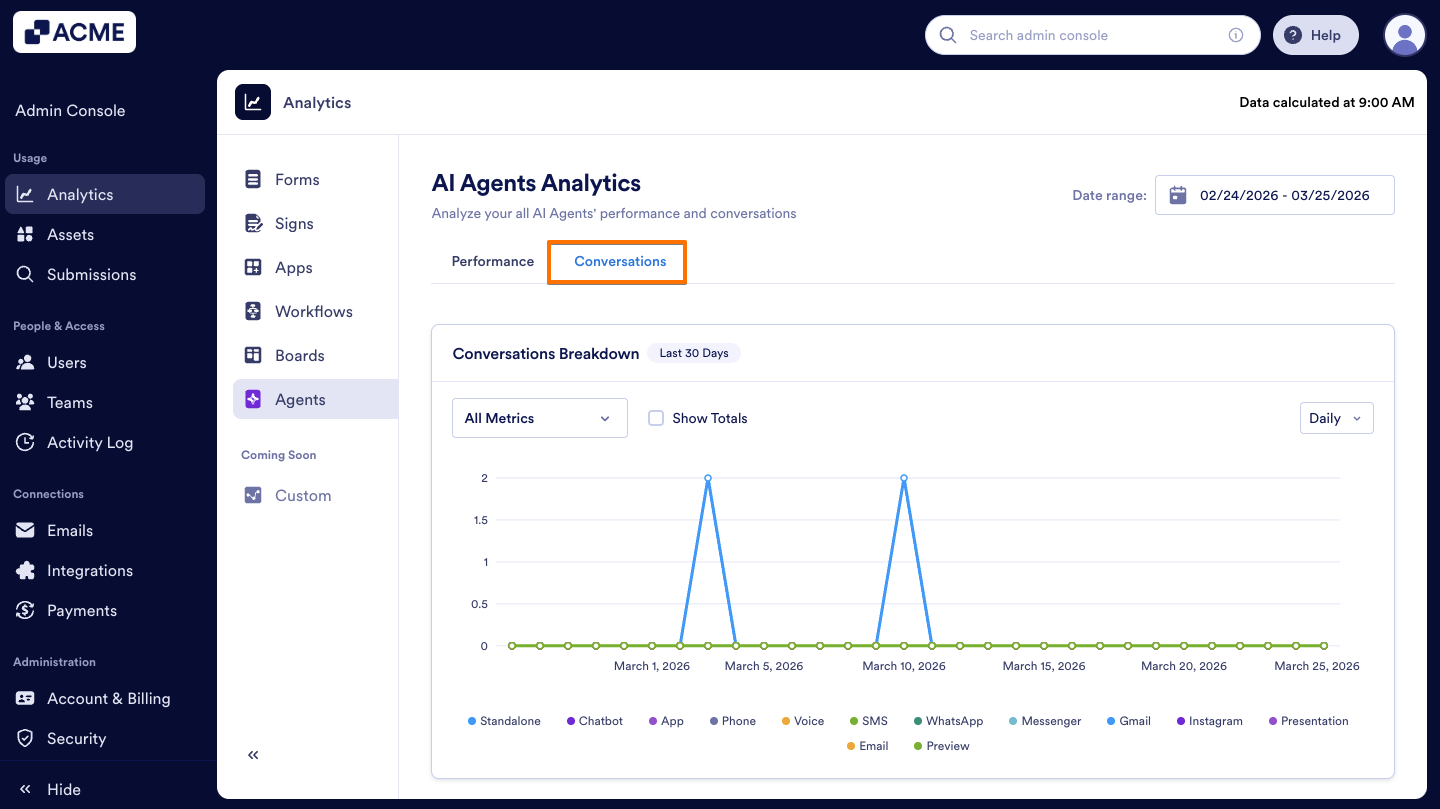
- On the AI Agent Analytics page, click on the Conversations tab.
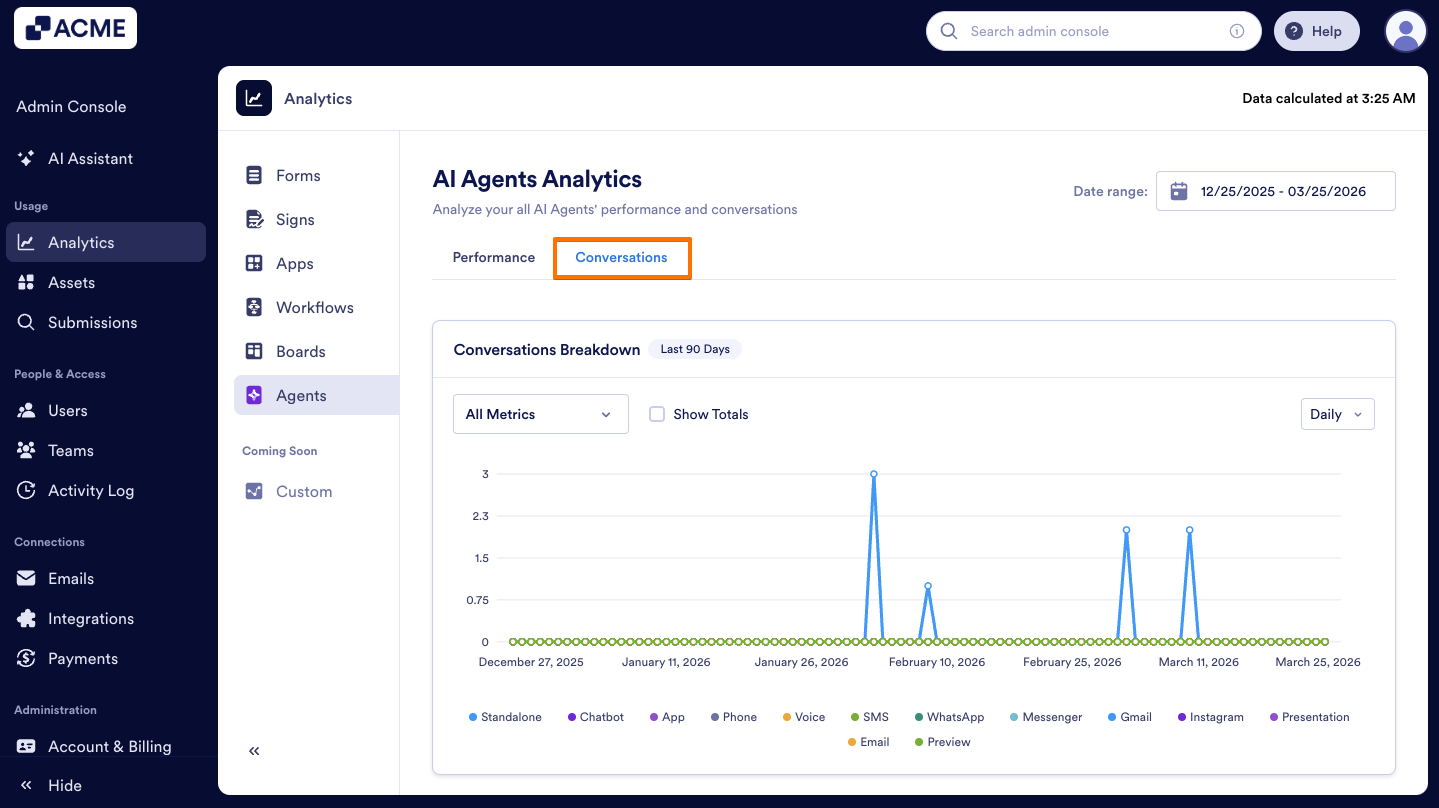
- Then, you will see a line chart that displays the number of conversations received within the selected date range, broken down by channel distribution.
- Additionally, under the line chart section, you will see the distribution of agent conversations displayed within each card according to the conversation metrics mentioned above.
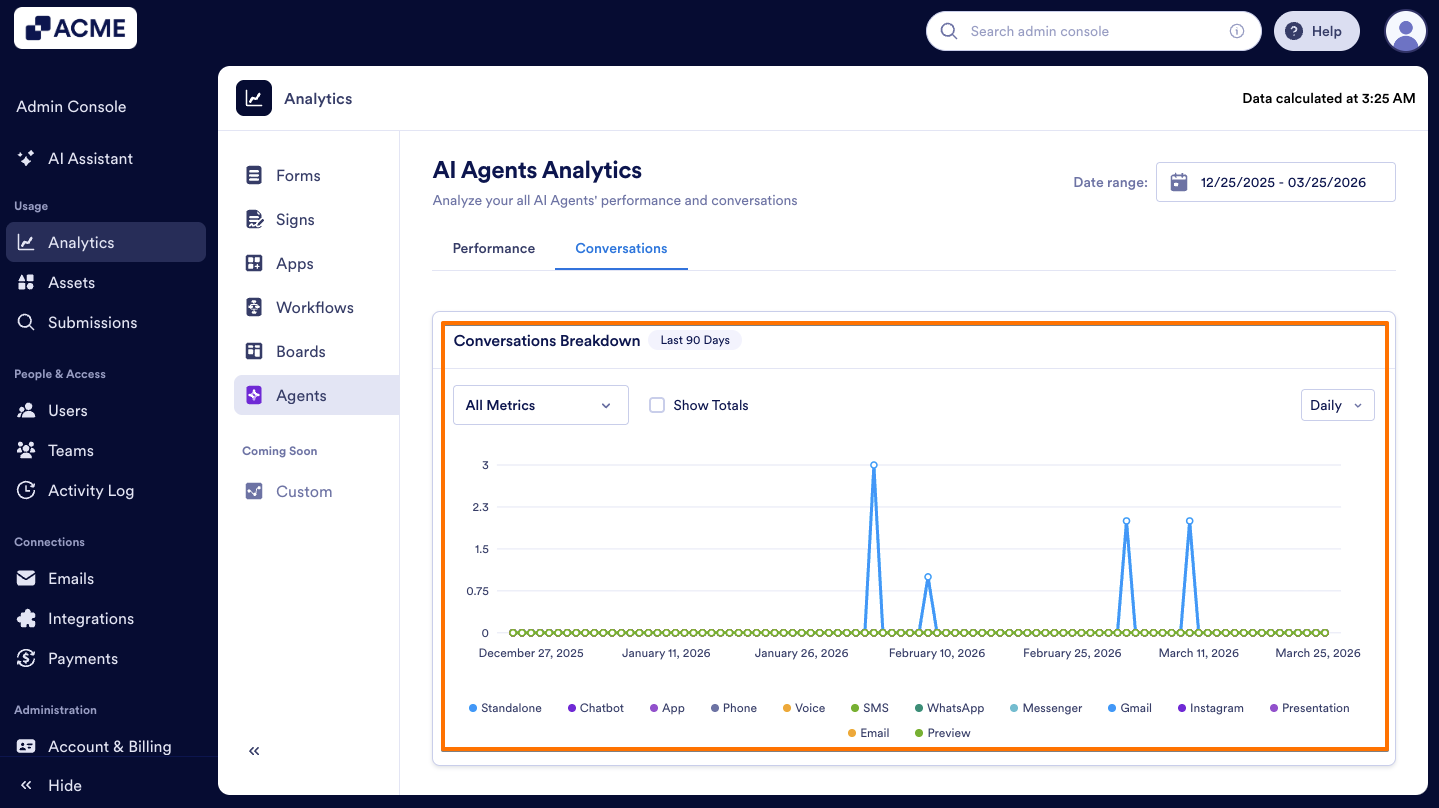
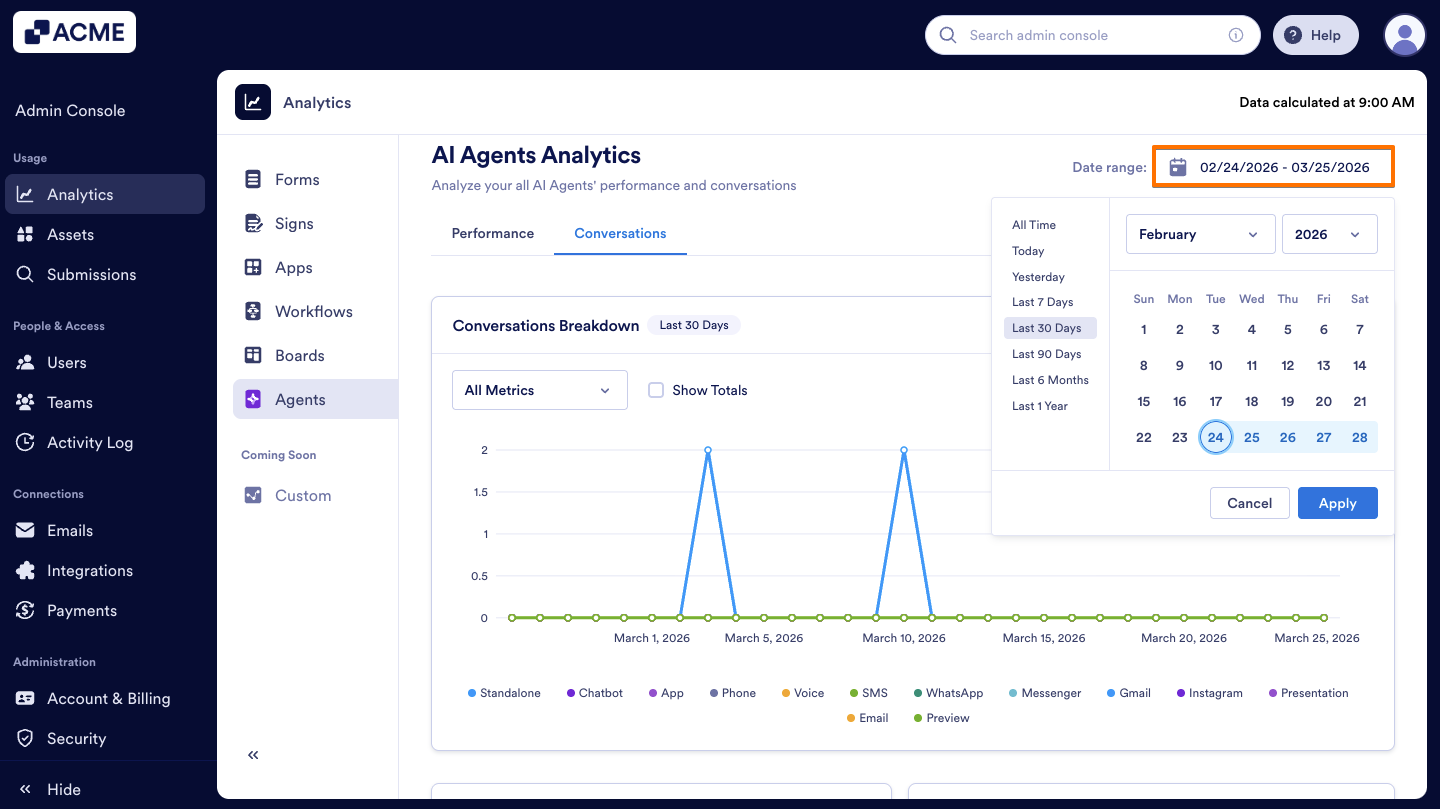
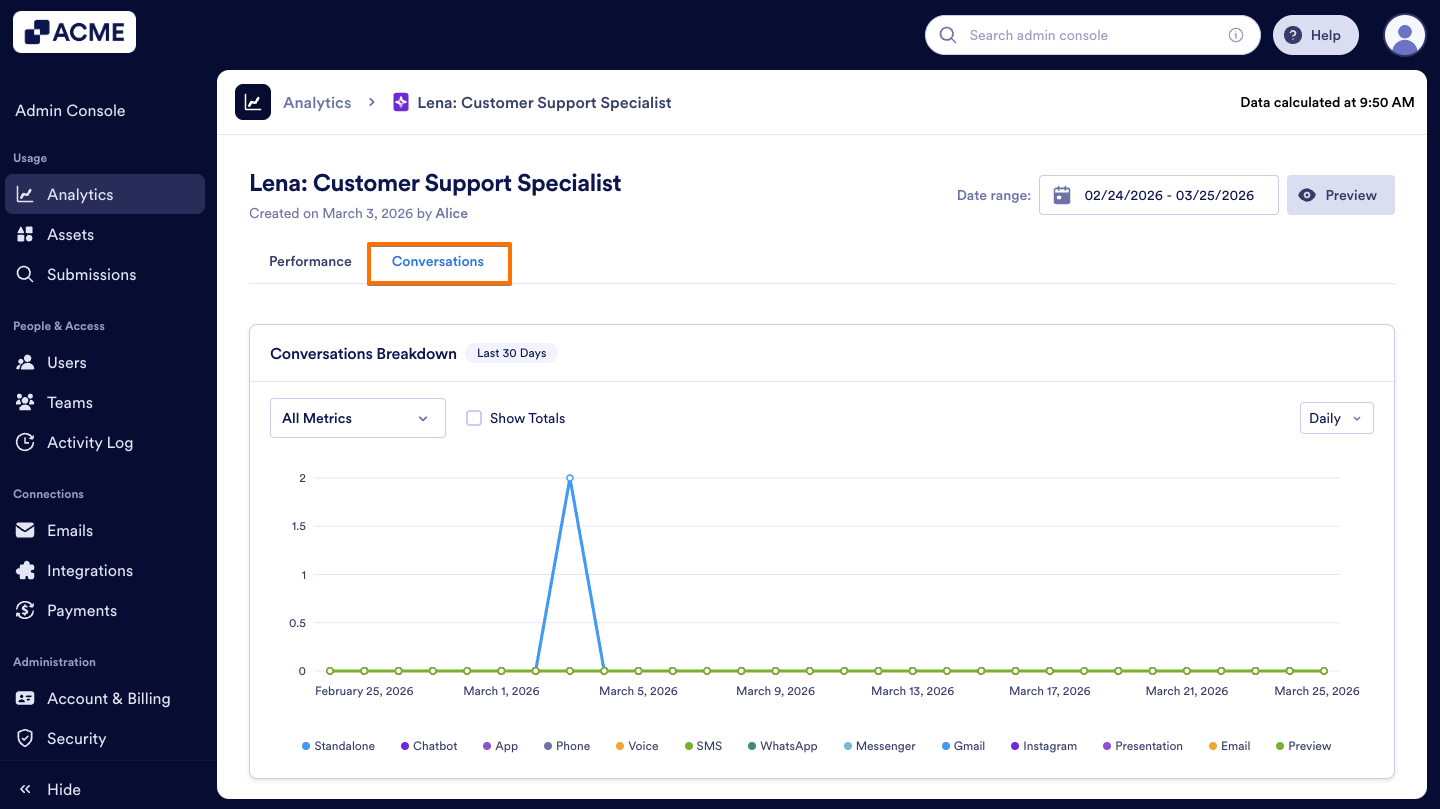
Conversations Breakdown Chart
The Conversations Breakdown Chart is a line chart that visualizes the number of conversations across different channels over a selected time period. The chart allows you to track conversation activity trends over time, compare metrics across multiple channels simultaneously, adjust the date granularity between daily, weekly, monthly, and yearly views, and include or exclude specific metrics using the dropdown menu or checkboxes. You can decide which metrics to include or exclude from the metrics too. Here's how:
- In the Conversations tab, on the upper right side of the page, click on the Date Range to select it.
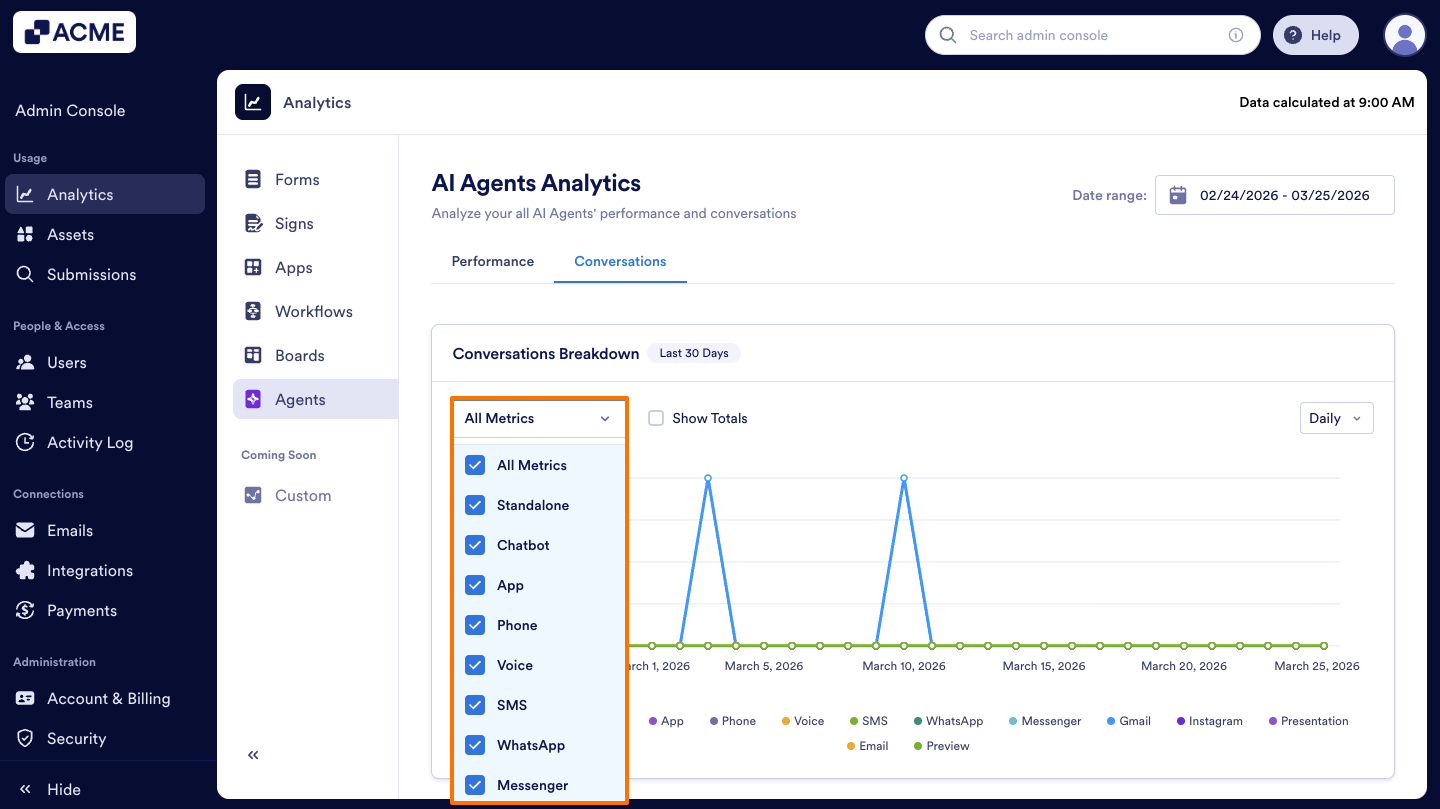
- Next, from the Dropdown menu, choose the metrics to include.
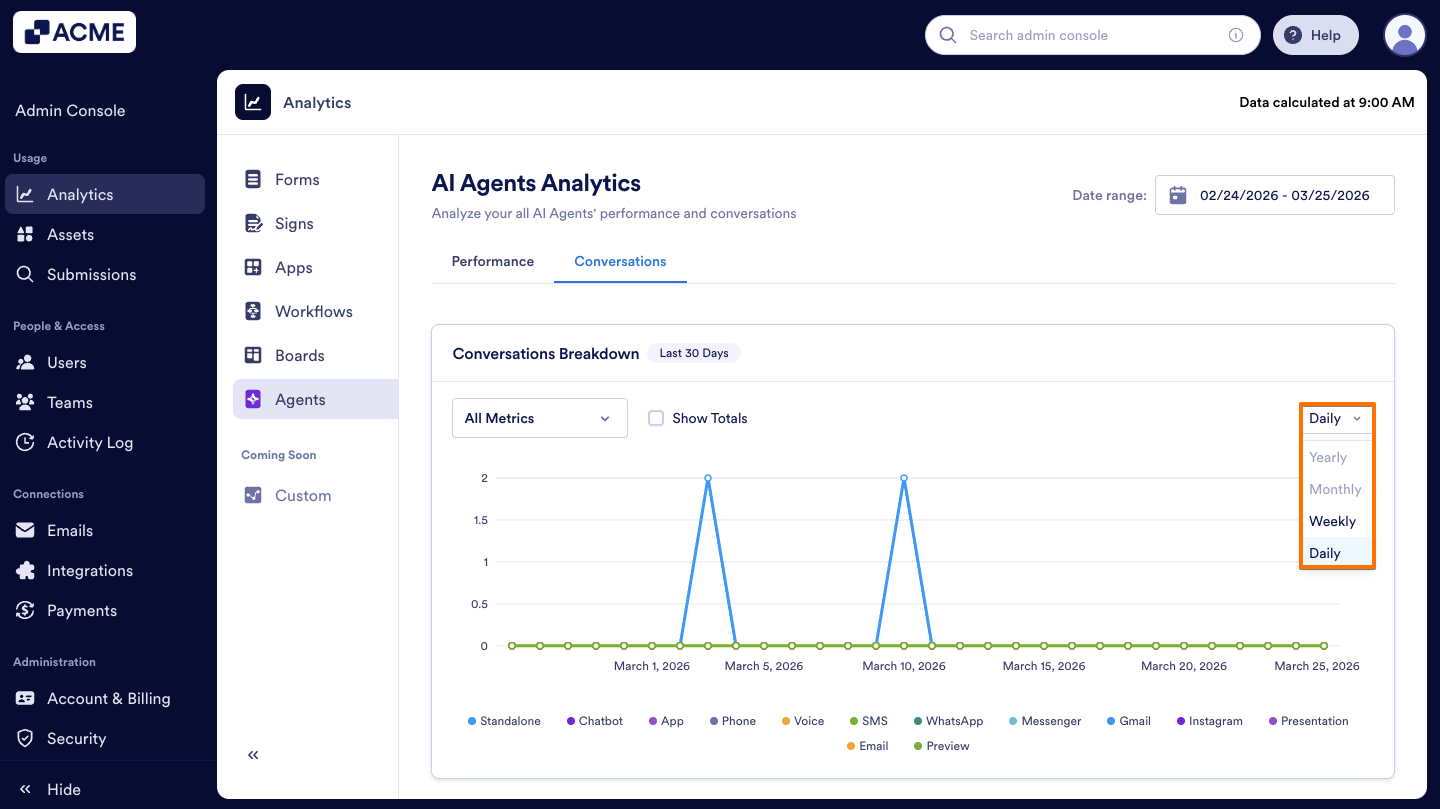
- Finally, set the view to Daily, Weekly, Monthly, or Yearly.
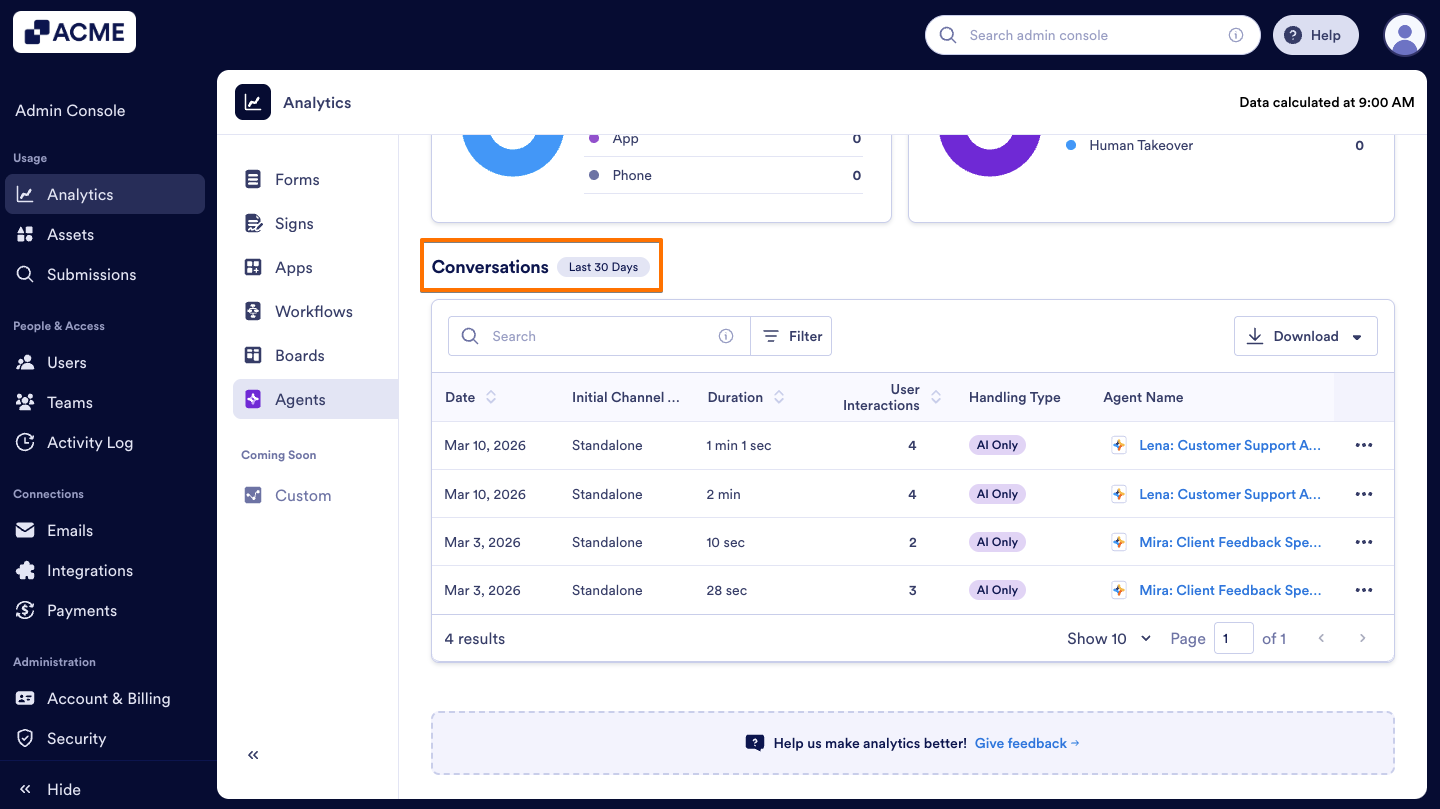
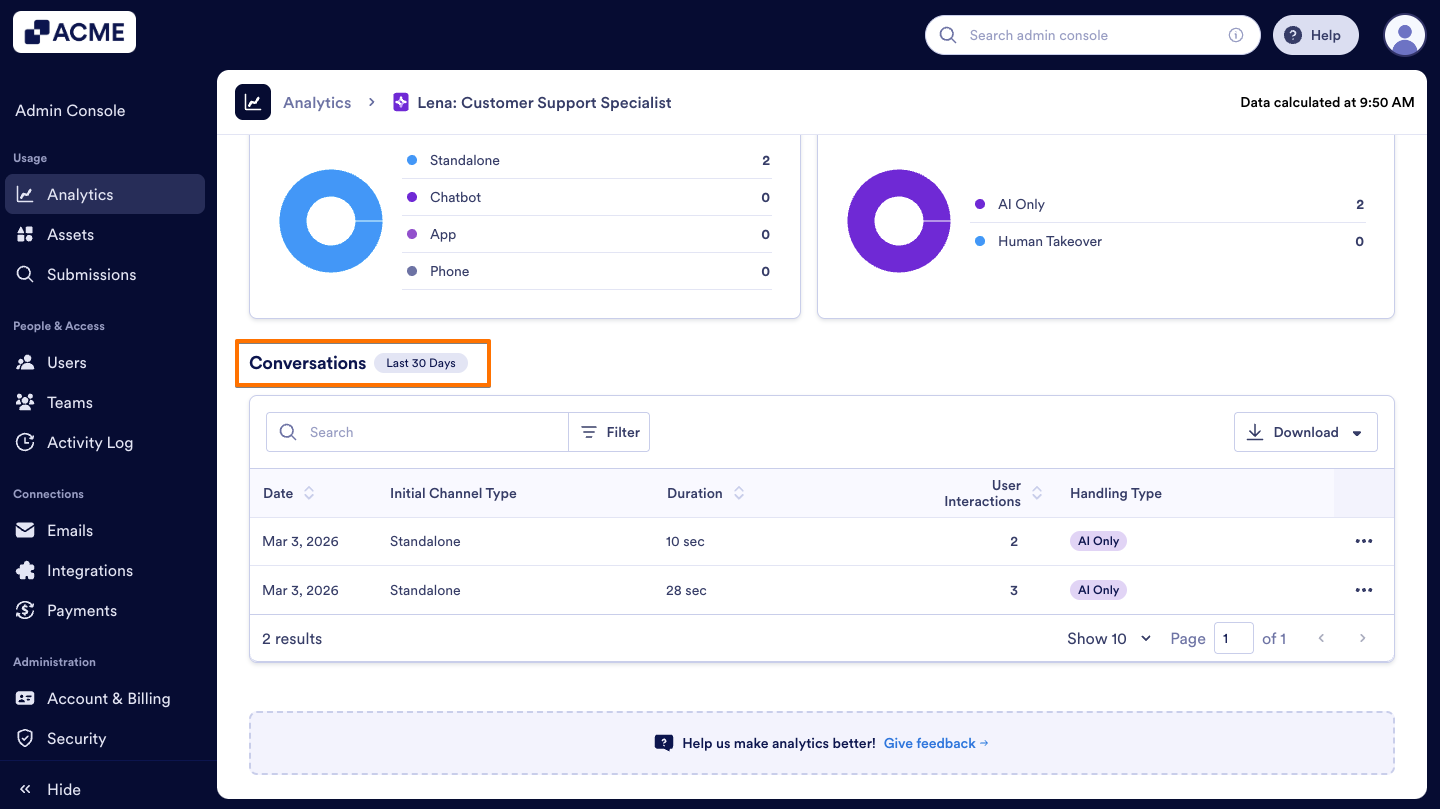
Conversations List
Under the Conversation tab, you can view a detailed list of conversations, including the date, initial channel type, duration, total user interactions, handling type (AI only or Human Takeover), and agent name.
Let’s walk through this process together:
- In the AI Agent Analytics page, click on Conversations.
- Scroll down to the Conversations Table to see the list of conversations.
Tip
You can also preview the corresponding agent’s Conversations by clicking the Three dots menu next to a conversation.
Download Conversation Data
You can also download Conversation data, which includes the Date, Channel, Duration, and other things:
- In the AI Agents Analytics page, select the Conversations tab.

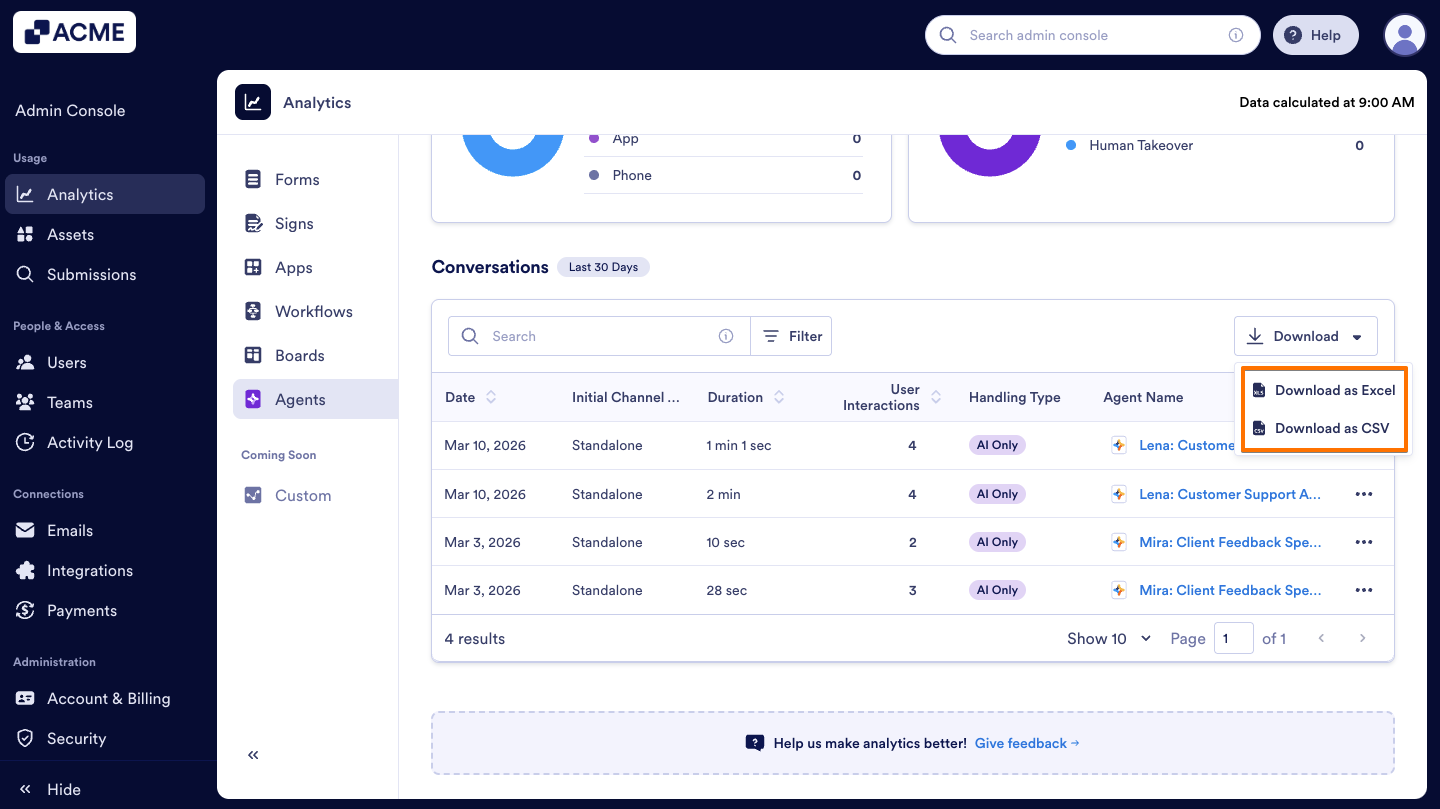
- Scroll down to Conversations and click on Download.
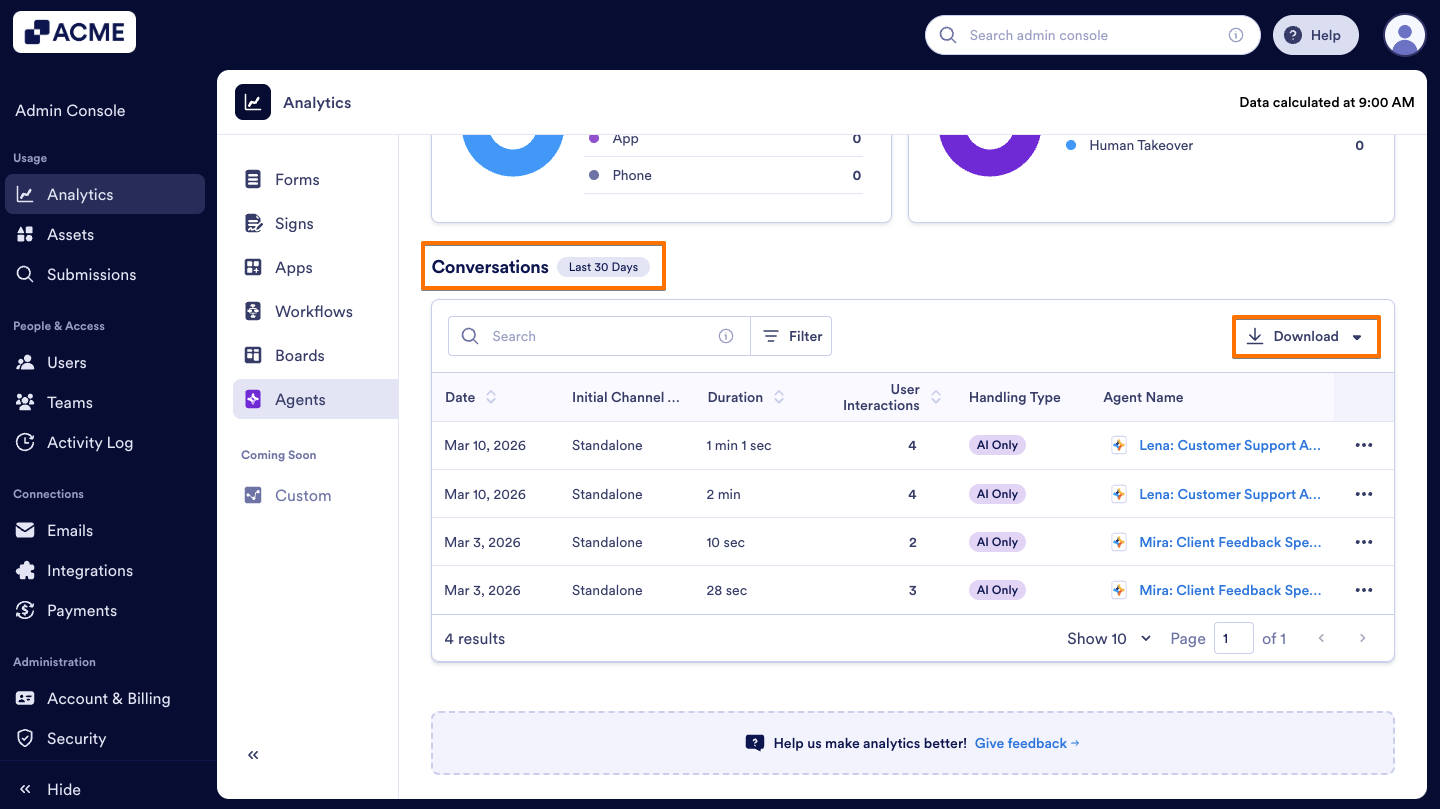
- Then, select how you’d like the file to be downloaded as Excel or CSV.
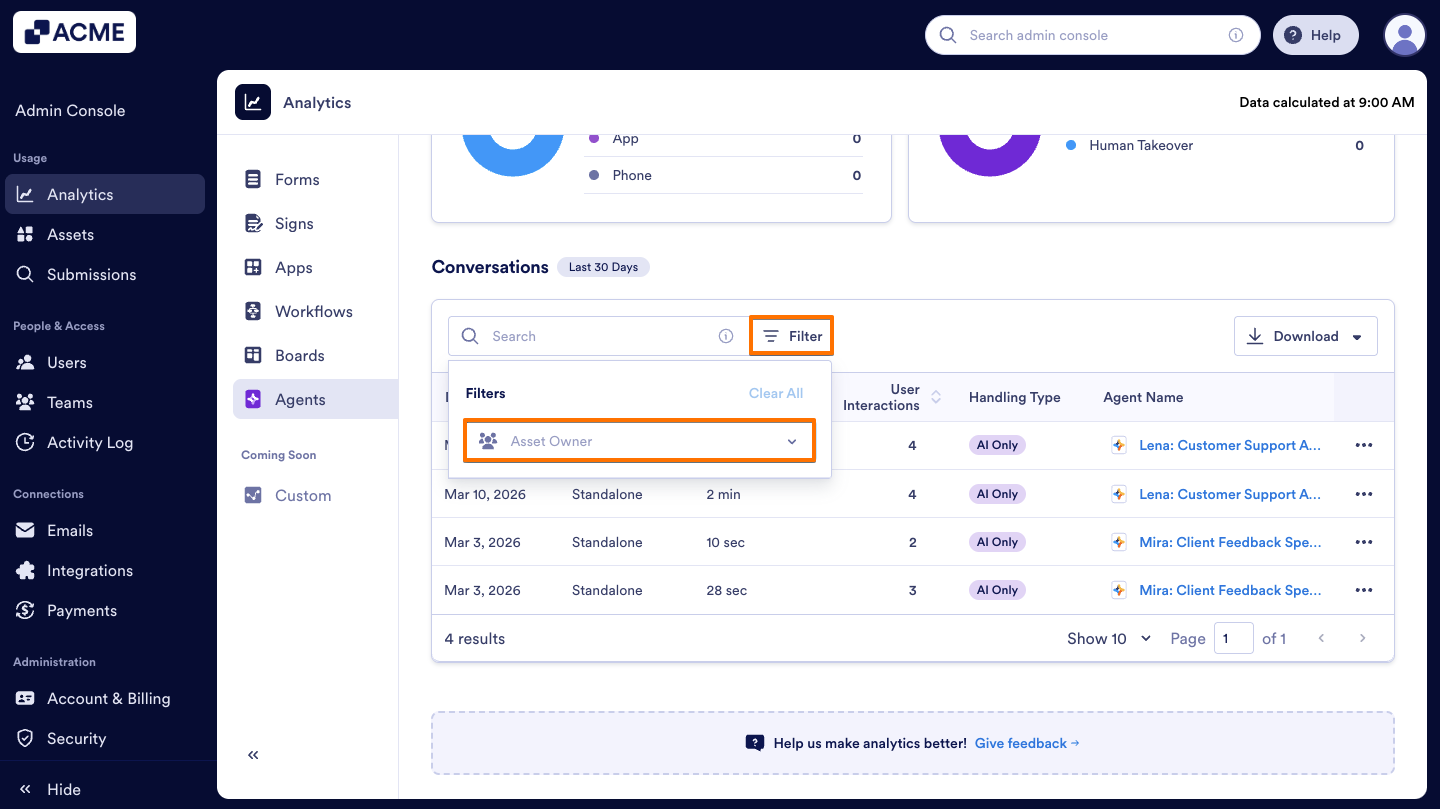
Filter Conversations
In the Conversations list section, you can narrow down the results by filtering conversations based on their owner. Let me show you how:
- In the AI Agent Analytics page, click on the Conversations tab.

- Scroll down to the Conversations section and click on Filter located on the right side of the Search bar.
- In the Dropdown menu, select the Asset Owner.
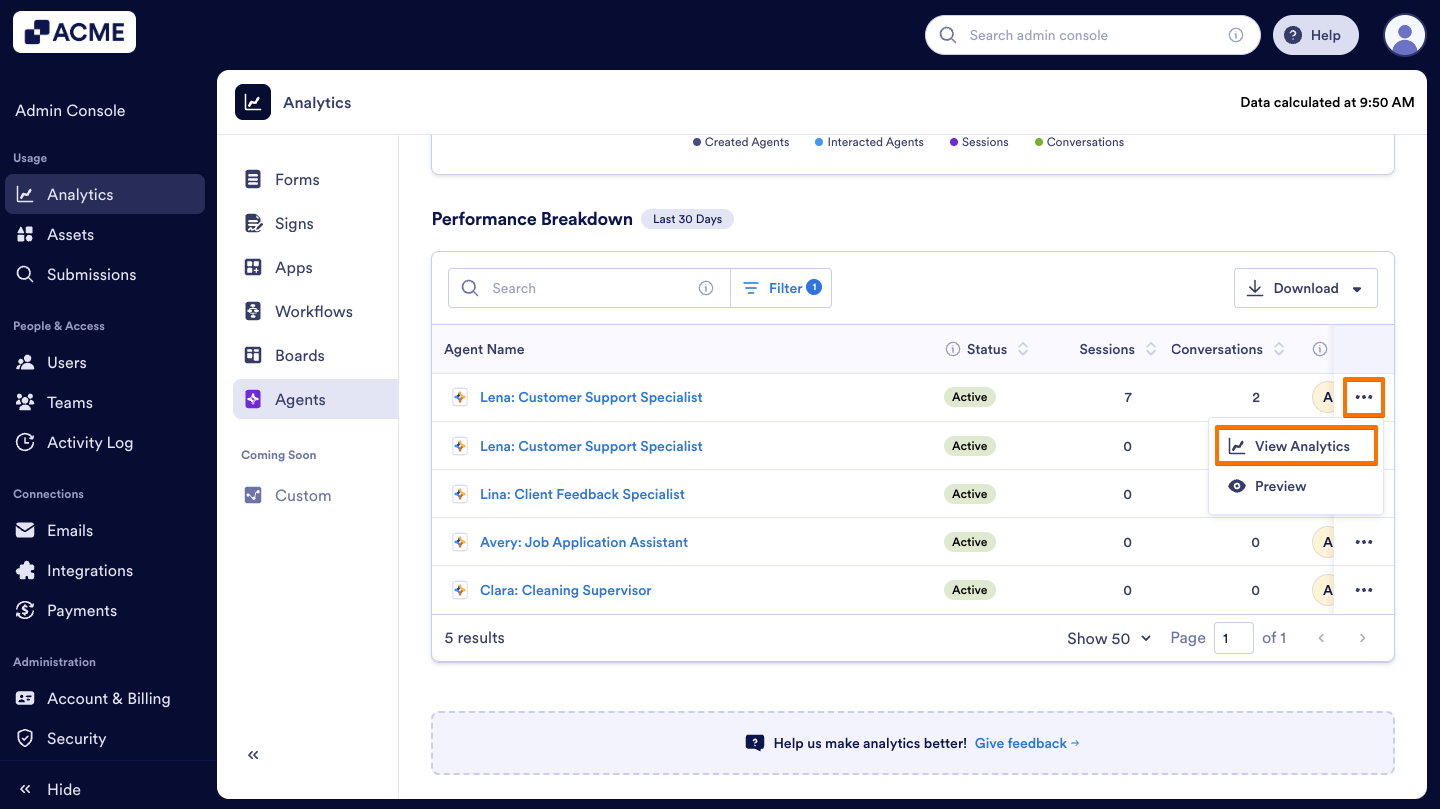
View Analytics for a Single AI Agent
You can also view the data for a specific AI Agent in the Analytics tab. Let’s walk through the steps together:
- In the Performance tab, scroll to the bottom of the page to the Performance Breakdown section.
- In the Performance Breakdown section, click on the Three dots icon next to the AI Agent you’d like to view analytics for.
- Then, click on View Analytics.
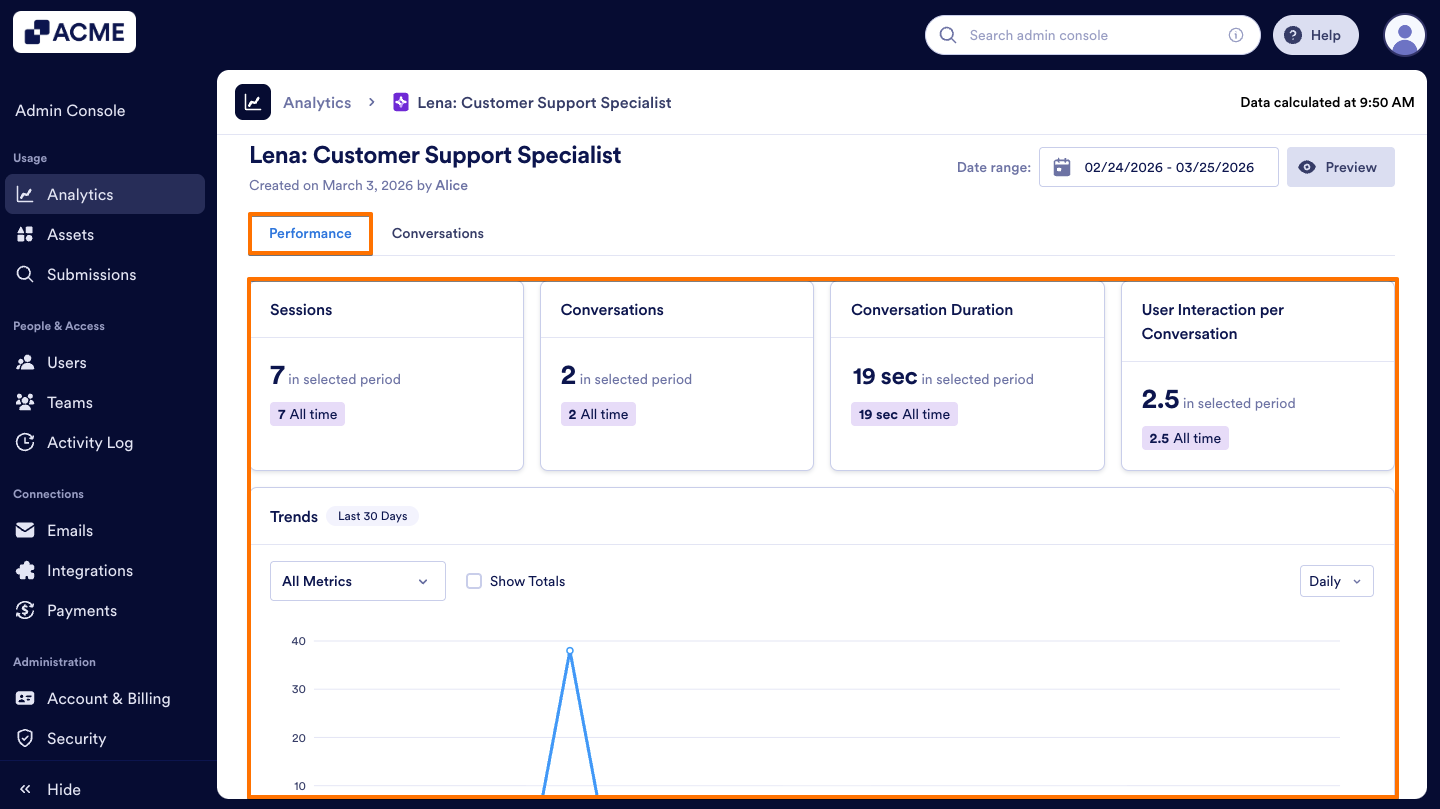
- Next, under a single agent’s Performance tab, you will see cards displaying Sessions, Conversations, average Conversation Duration, and User Interaction per Conversation, along with a Trends chart visualizing these metrics.
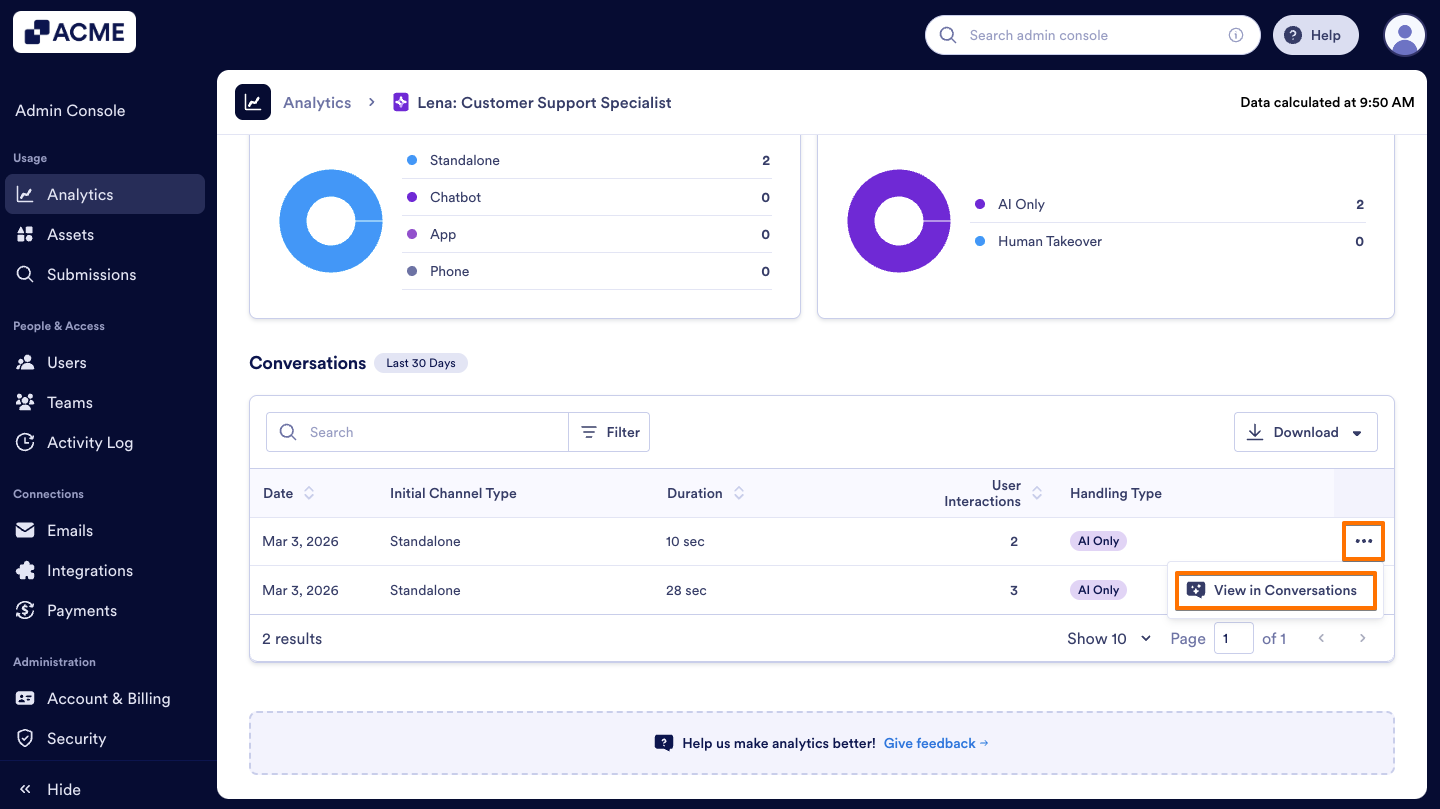
View Conversations For a Single Agent
Under the Single Agent’s Conversation tab, you can view conversation details of each Agent, such as channel distribution of each conversation for the selected agent and conversation handling type via AI only or human takeover. Let’s walk through this process together:
- In the AI Agent Analytics page, under the Performance tab, scroll down to the Performance Breakdown section.
- Click on one of the AI Agent’s name to open its own analytics page.
- Select the Conversations tab.
- Scroll down to the Conversation list at the bottom.
- On the right side of the conversation you want to view, click on the Three dots icon and select View in Conversations to open that specific conversation.

Send Comment: