The Admin Console provides access to detailed data and analytics on your Apps. As an admin, you can track both Performance and Traffic through dedicated tabs. Each section gives you specific metrics and visualizations to help monitor app usage and overall engagement across your organization.

App Analytics
Note
Data in the Analytics tab updates every 5 minutes.
Let’s walk through how to reach the App Analytics page:
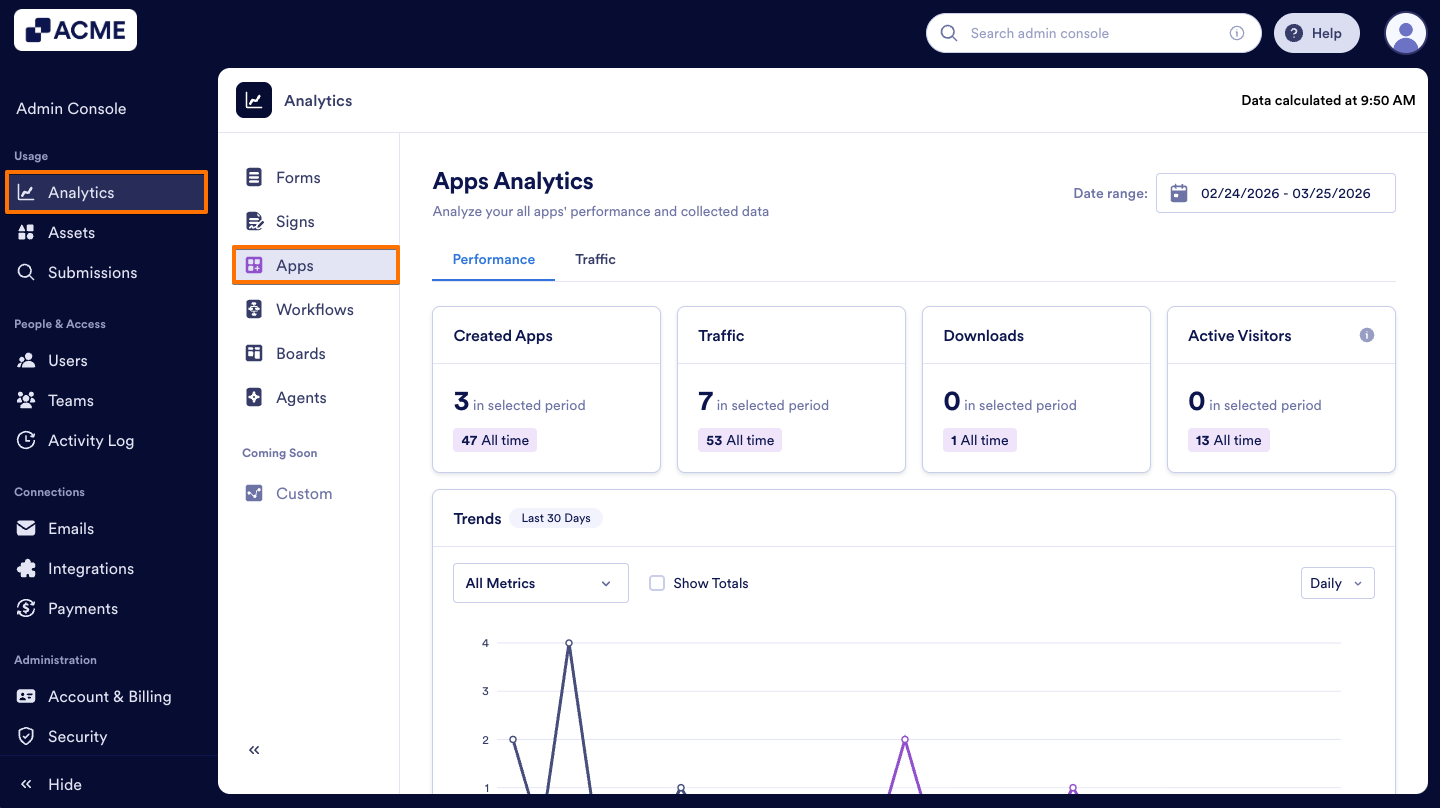
- In the Admin Console, click on Analytics on the left-hand side of the page.
- Next, click on Apps to open App Analytics data.
Performance Tab
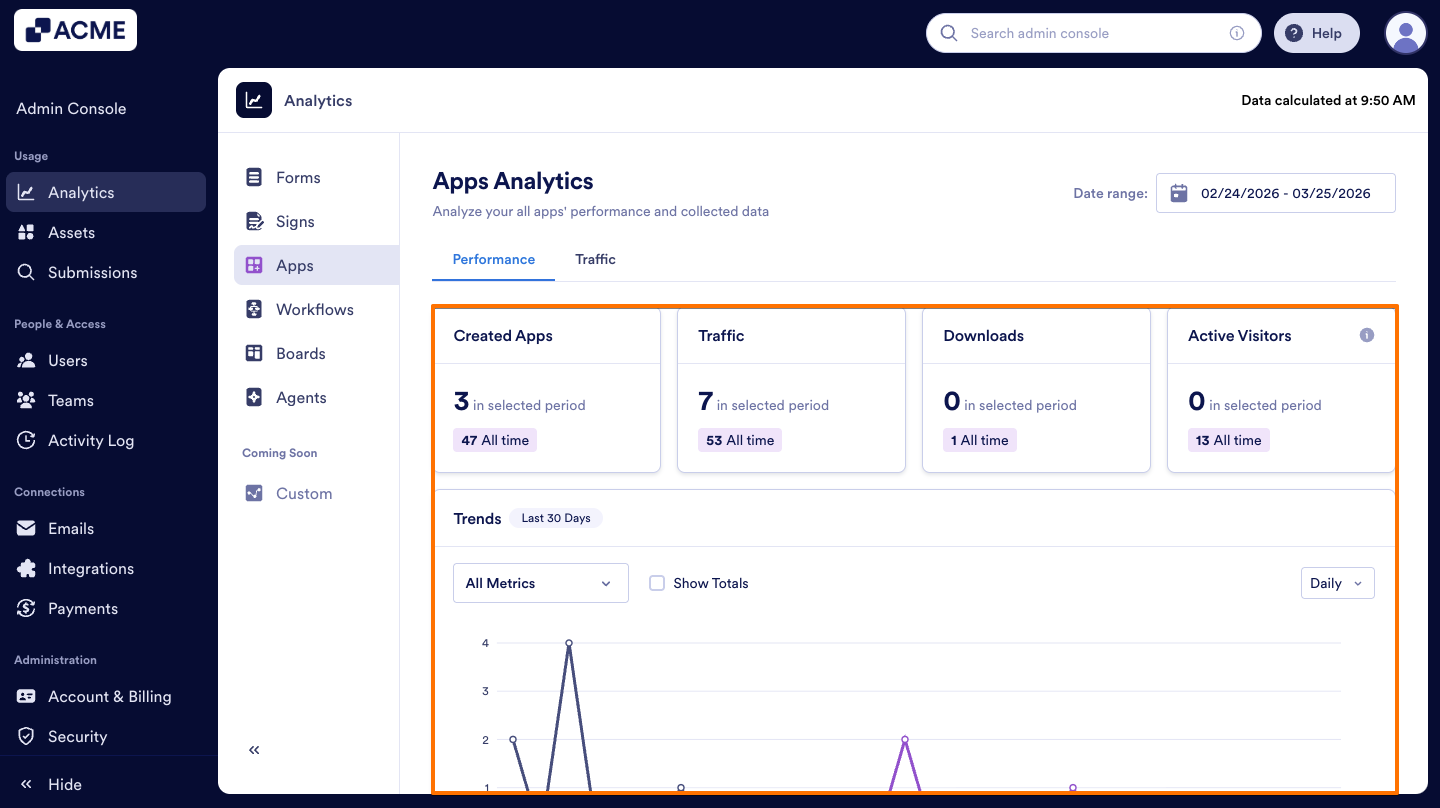
The Performance Tab focuses on overall app activity across your organization.
Performance Tab Metrics:
- Created Apps: The total number of apps created in your organization in a selected date range.
- Traffic: The total number of views apps received inside and outside your organization in a selected date range.
- Downloads: The total number of downloads to your organization’s apps in a selected date range.
- Active Visitors: The total number of active app users—those who performed at least one action within the apps in your organization in a selected date range.
Let’s walk through how to reach the Performance tab:
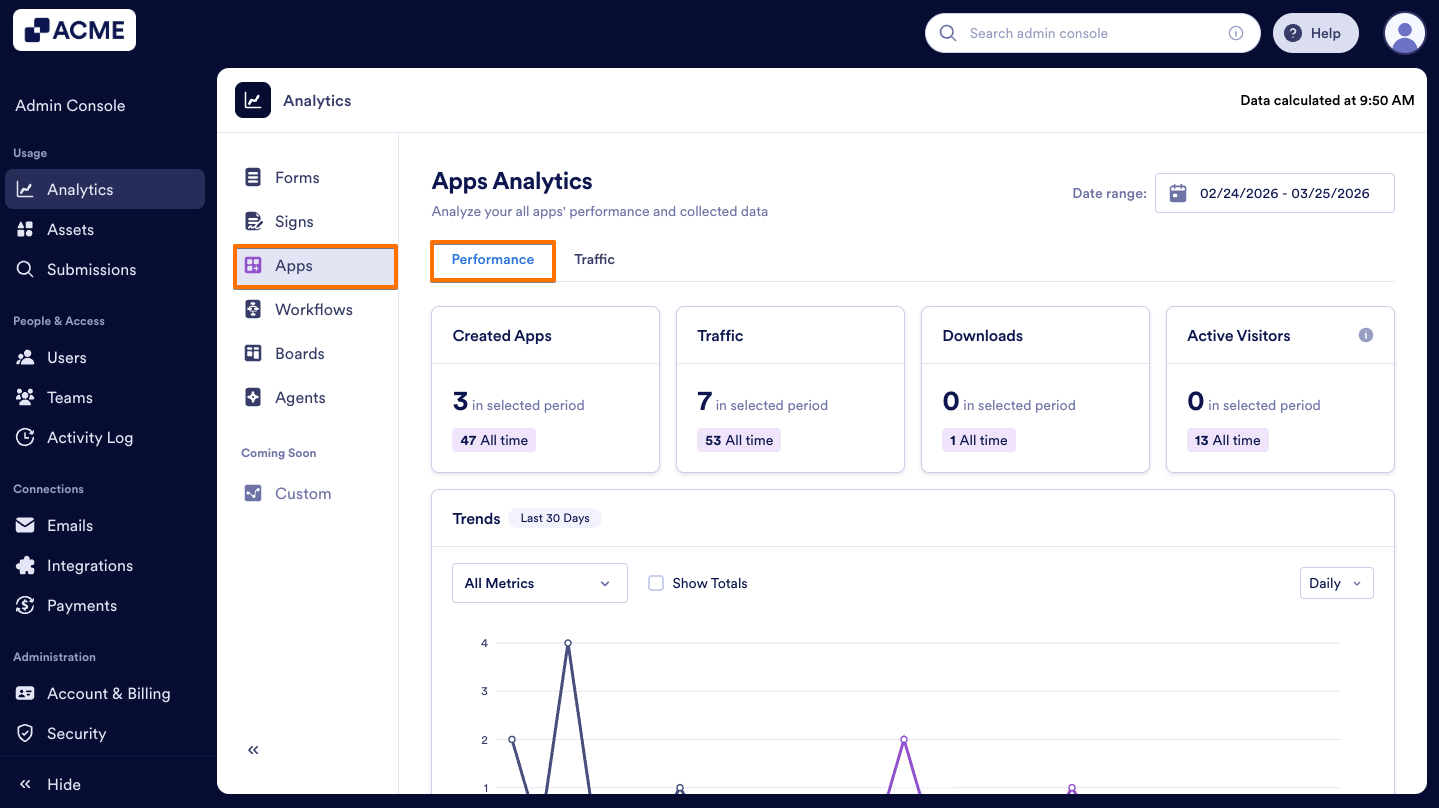
- On the App Analytics page, select the Performance tab to view the performance of all apps.
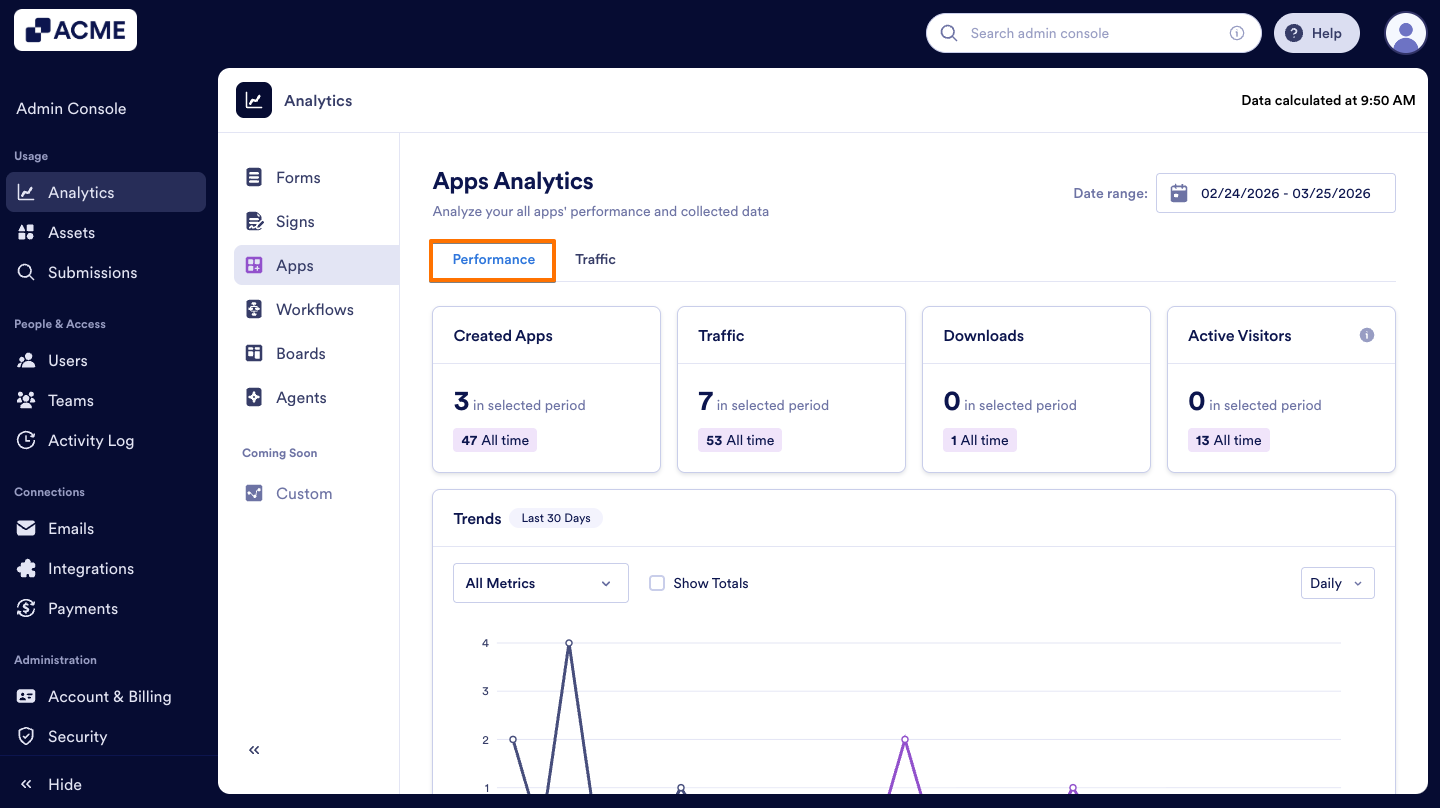
- Then, you will see the Apps Analytics dashboard displaying key metrics mentioned above.
- Additionally, under the Trends section, you can view the pie charts to see the distributions of App Types and Push Notifications.
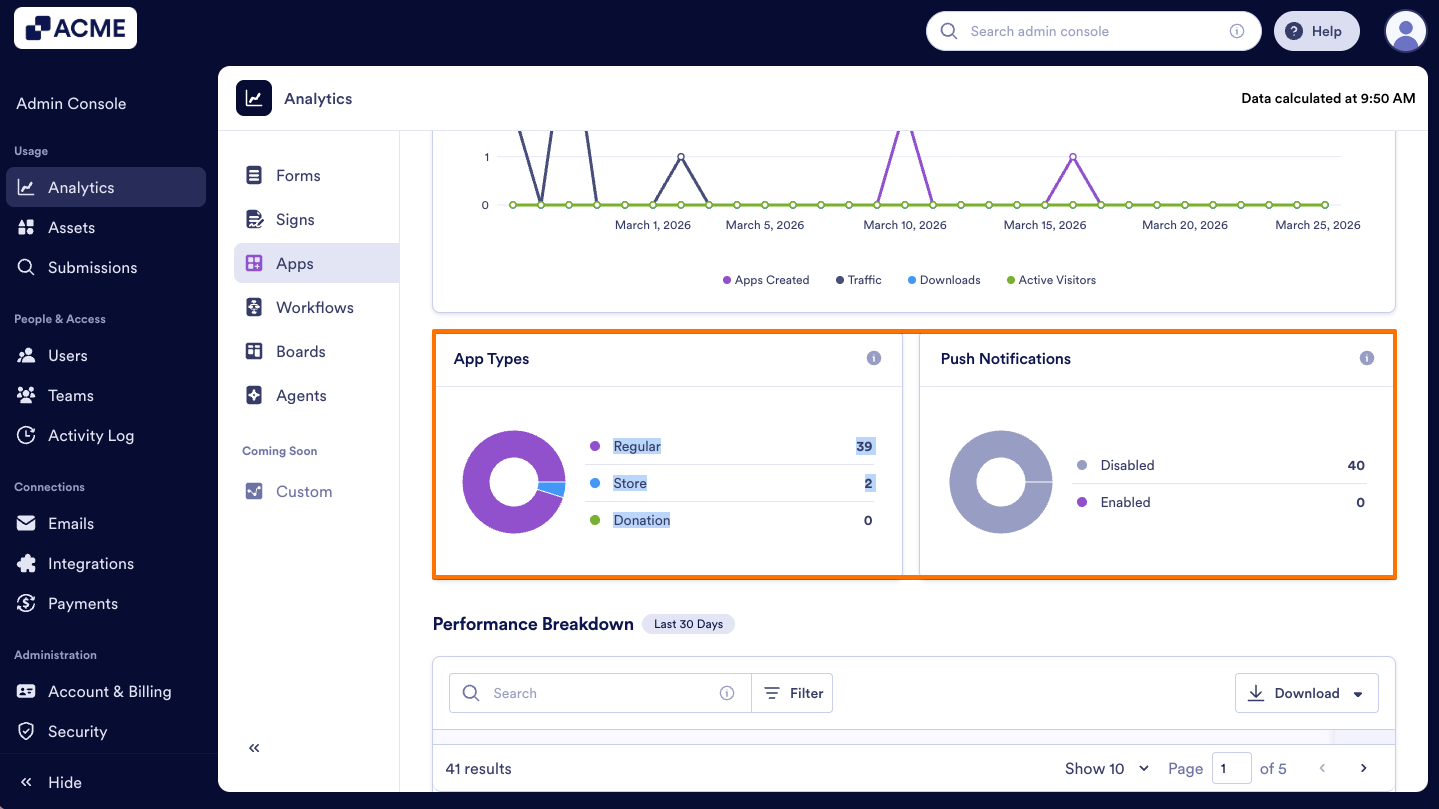
- Apps Types: The pie chart under the Trends Chart that shows the number of different types of Apps created in your organization. In the App Types chart, you can view the distribution of the number of apps by App types selected when creating each app in the App Builder.
- Push Notifications: The second pie chart under the Trends shows the number of apps with enabled and disabled push notifications from the app settings.
Trends Chart:
There is a Trends chart available under the Performance metrics that visualizes the metrics given in the cards above. This line chart visualizes the metrics above and helps you track your organization’s apps performance across a selected date range. You can also decide which metrics to include or exclude and adjust the chart view by daily, weekly, monthly, and yearly intervals. Let me show you how:
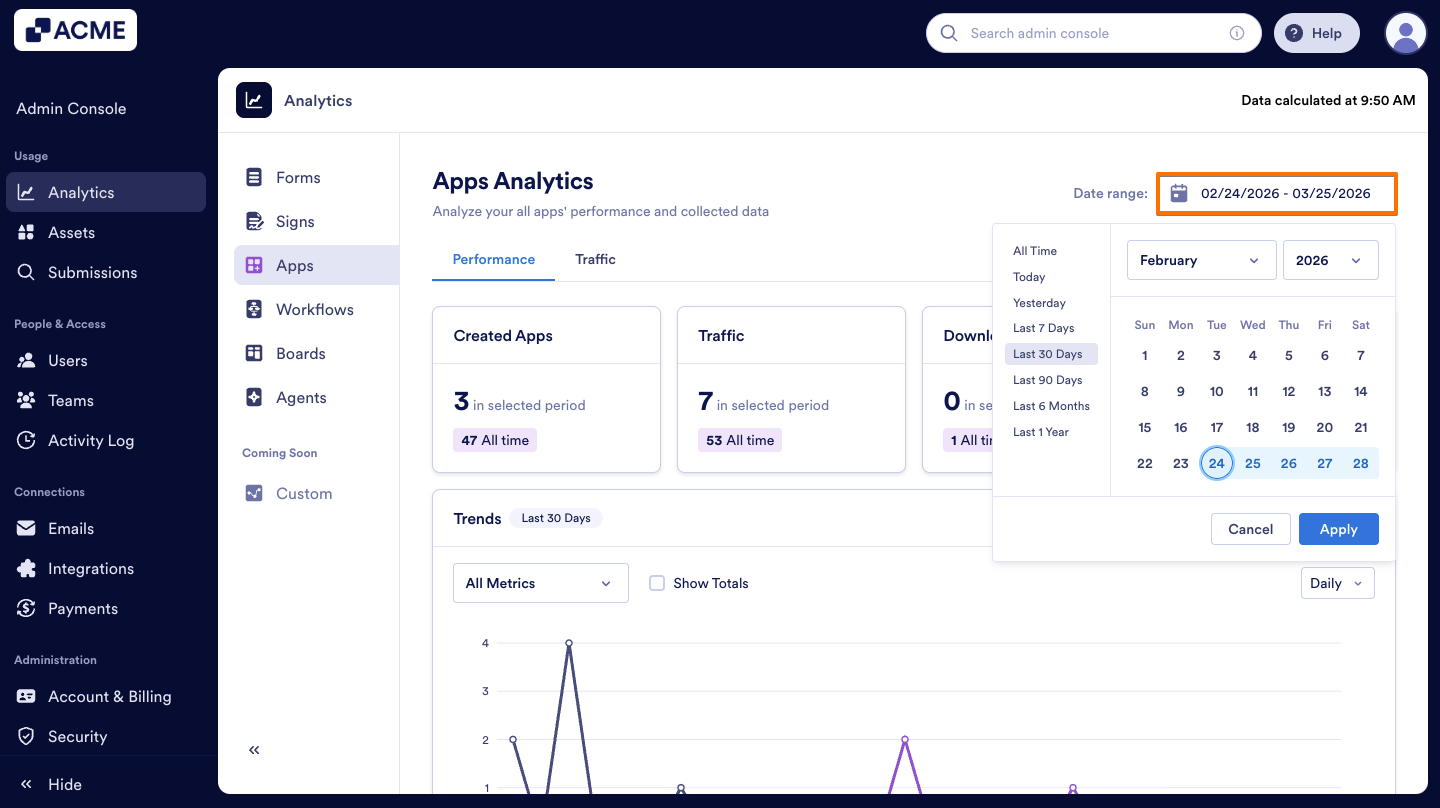
- In the Performance tab, on the upper-right side of the page, click on Date Range selector to select the date.
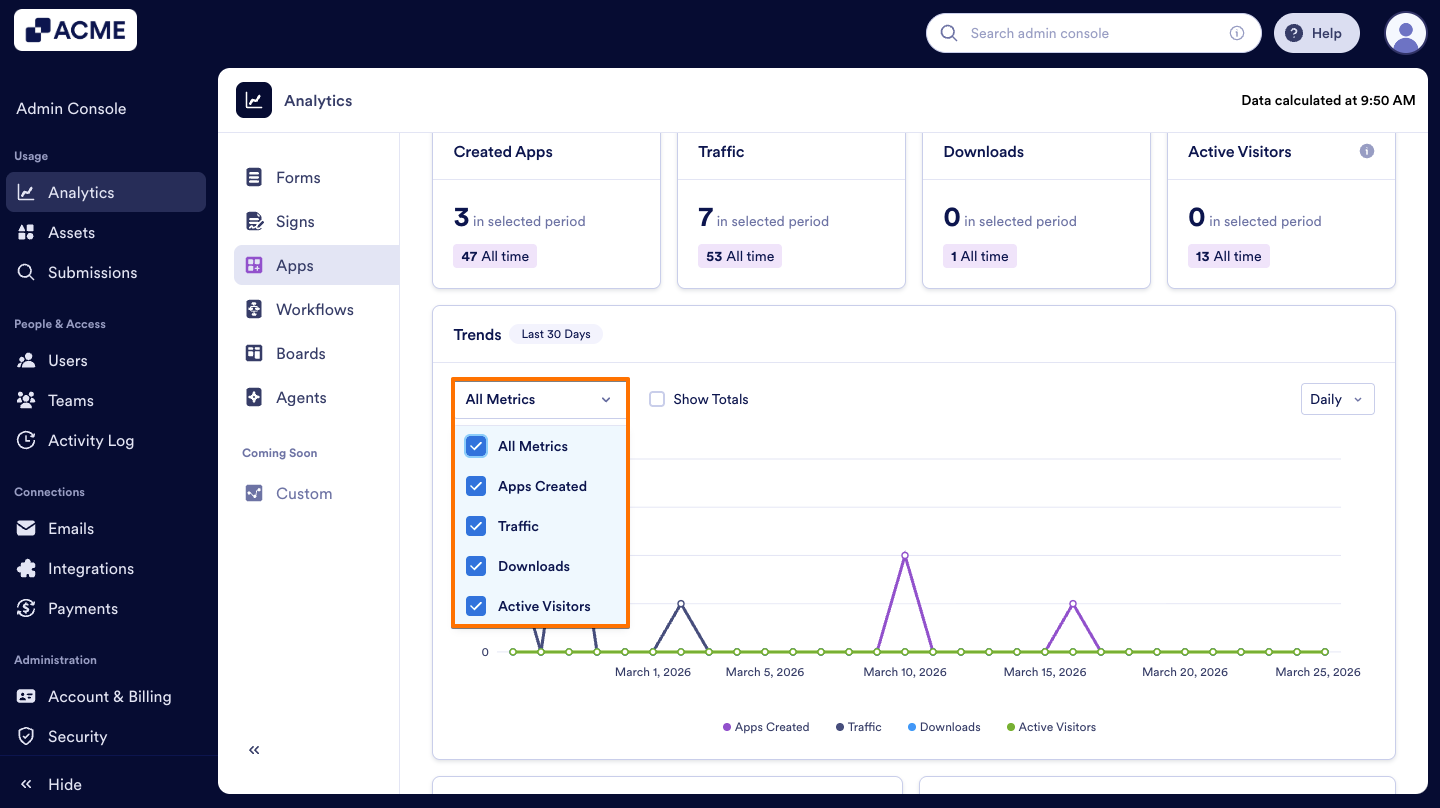
- Next, from the Dropdown menu, choose the metrics to include (e.g., apps created, downloads, traffic, active users).
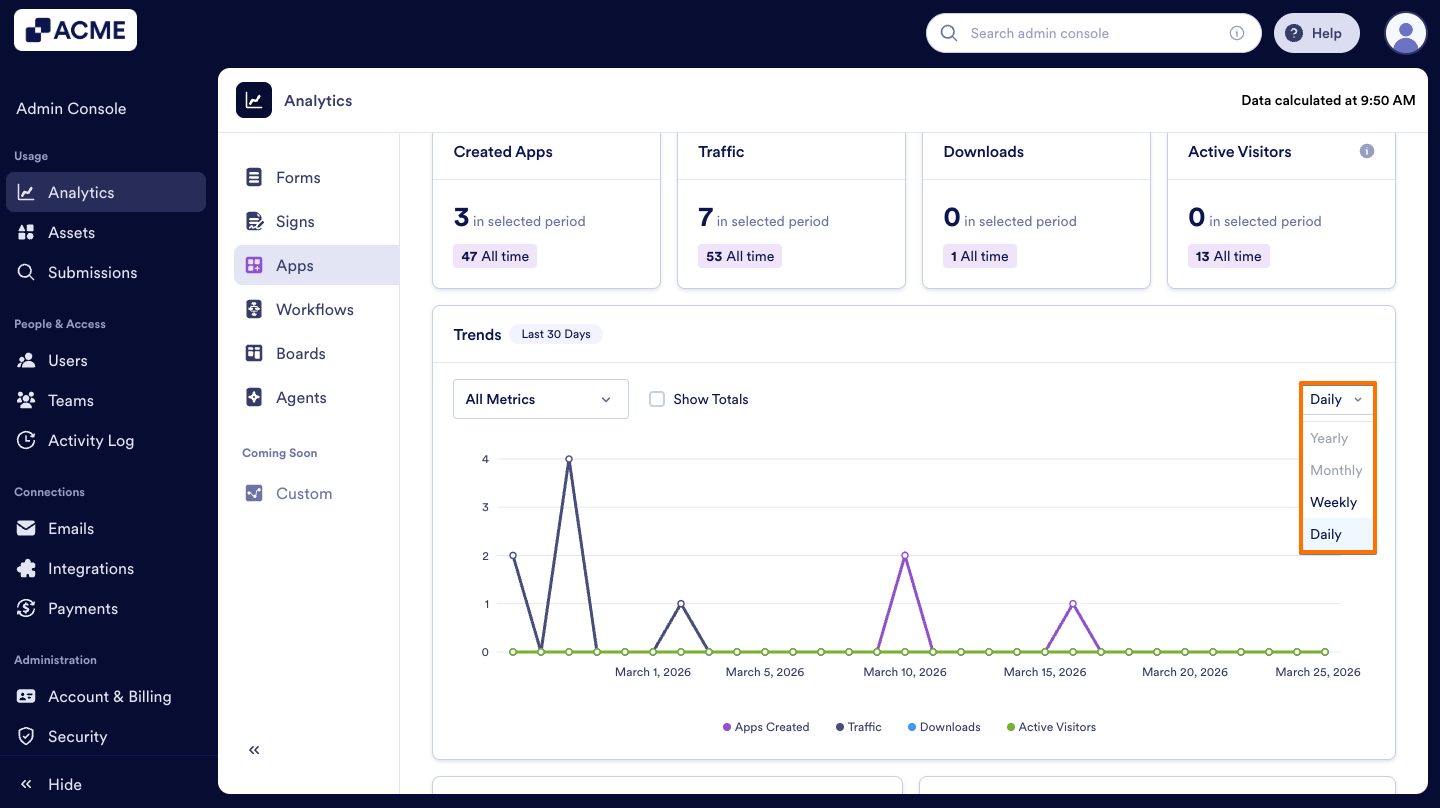
- Finally, set the view to Daily, Weekly, Monthly, or Yearly.
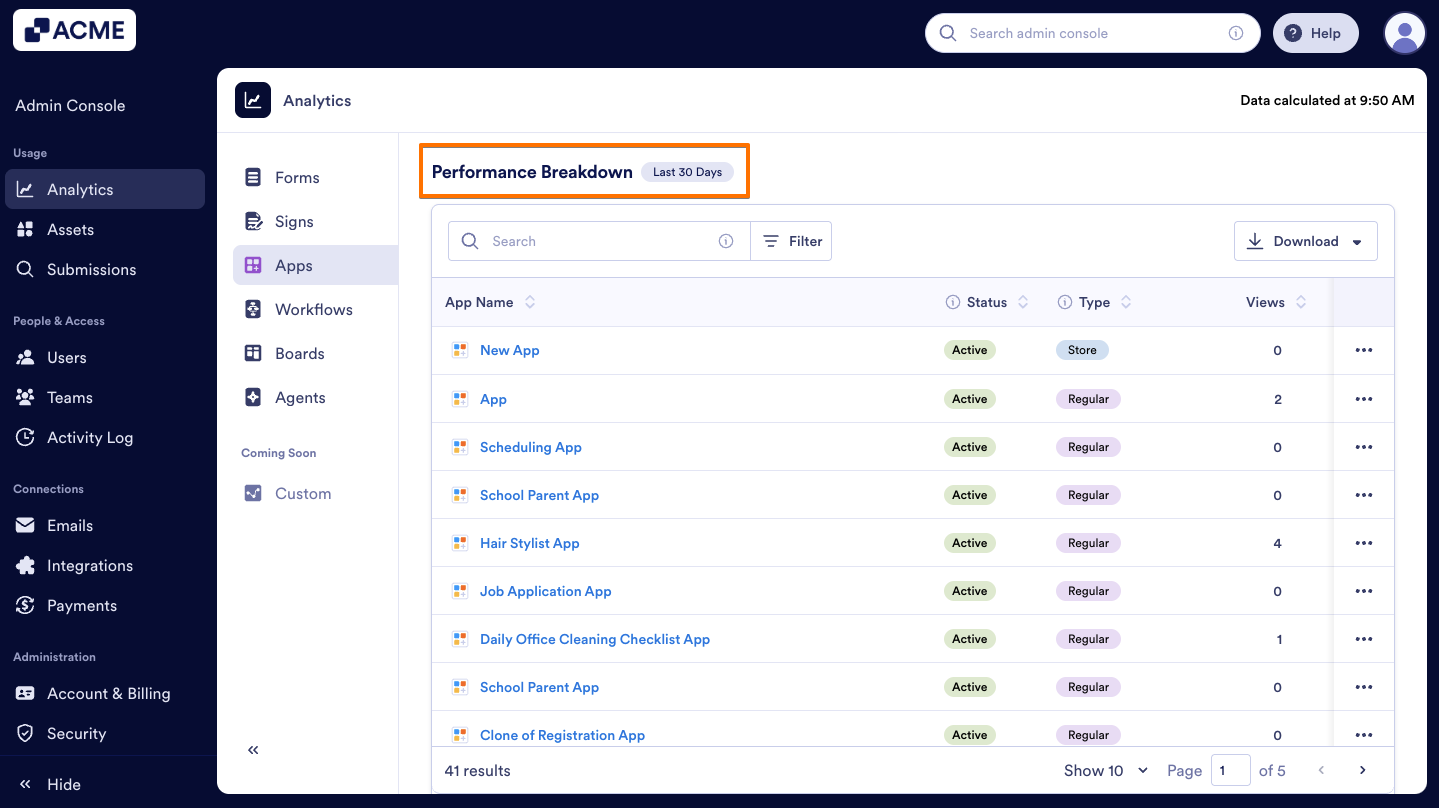
Performance Breakdown
In this section, you will see the distribution of all apps created across the organization based on the selected date range. The list shows each app’s name, type (regular, store, donation), how many views it received, downloads, engagement rate (the percentage of app visitors who took at least one action out of all visitors), notifications (how many push notifications are sent via a single app), and the app owner. Let’s walk through the steps together:
- In the Admin Console, select Apps from the Analytics section.
- Next, click on the Performance tab.
- Finally, scroll down to the Performance Breakdown list to see all Apps.

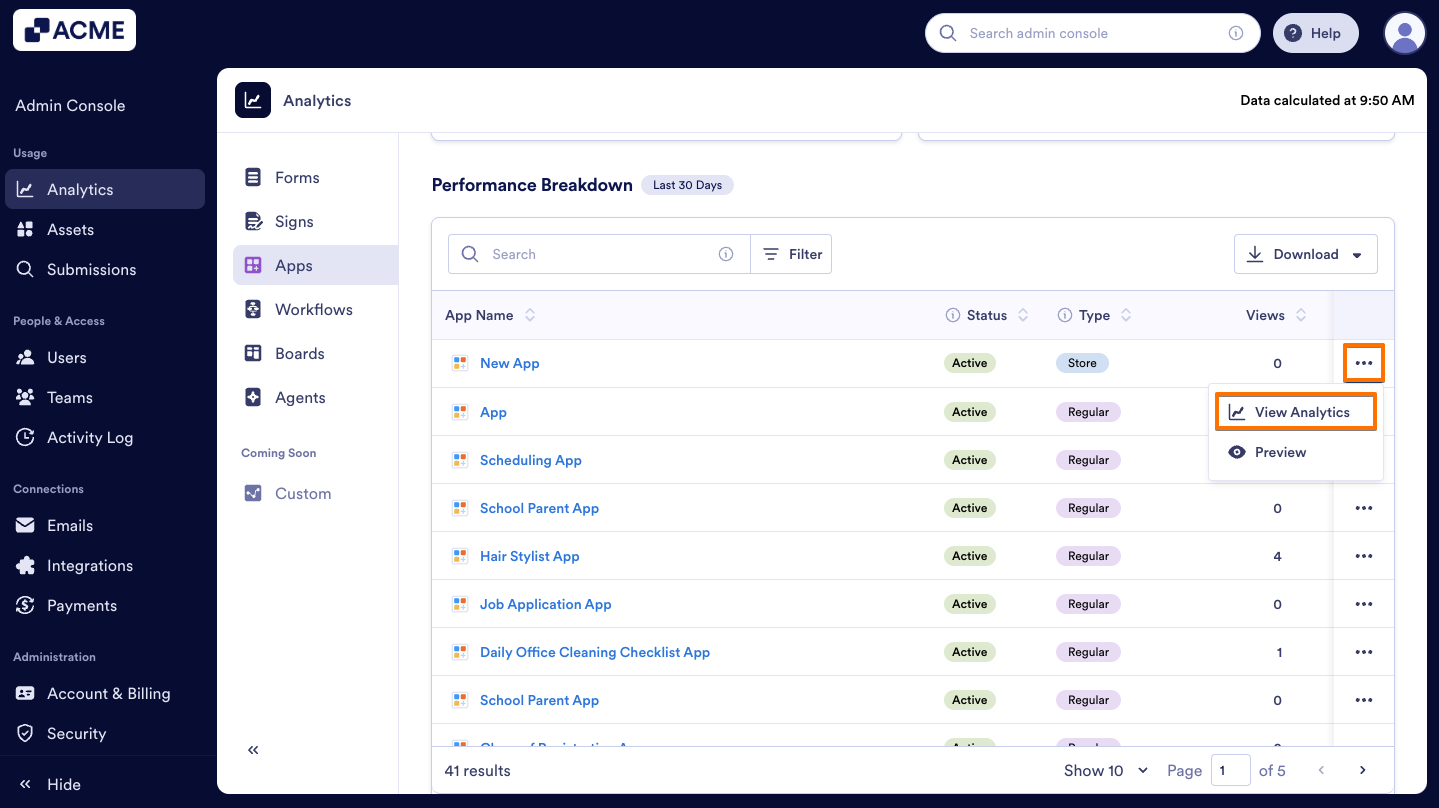
Tip
By clicking the three-dot action menu next to any app, you can either access analytics for that app or preview the app directly.
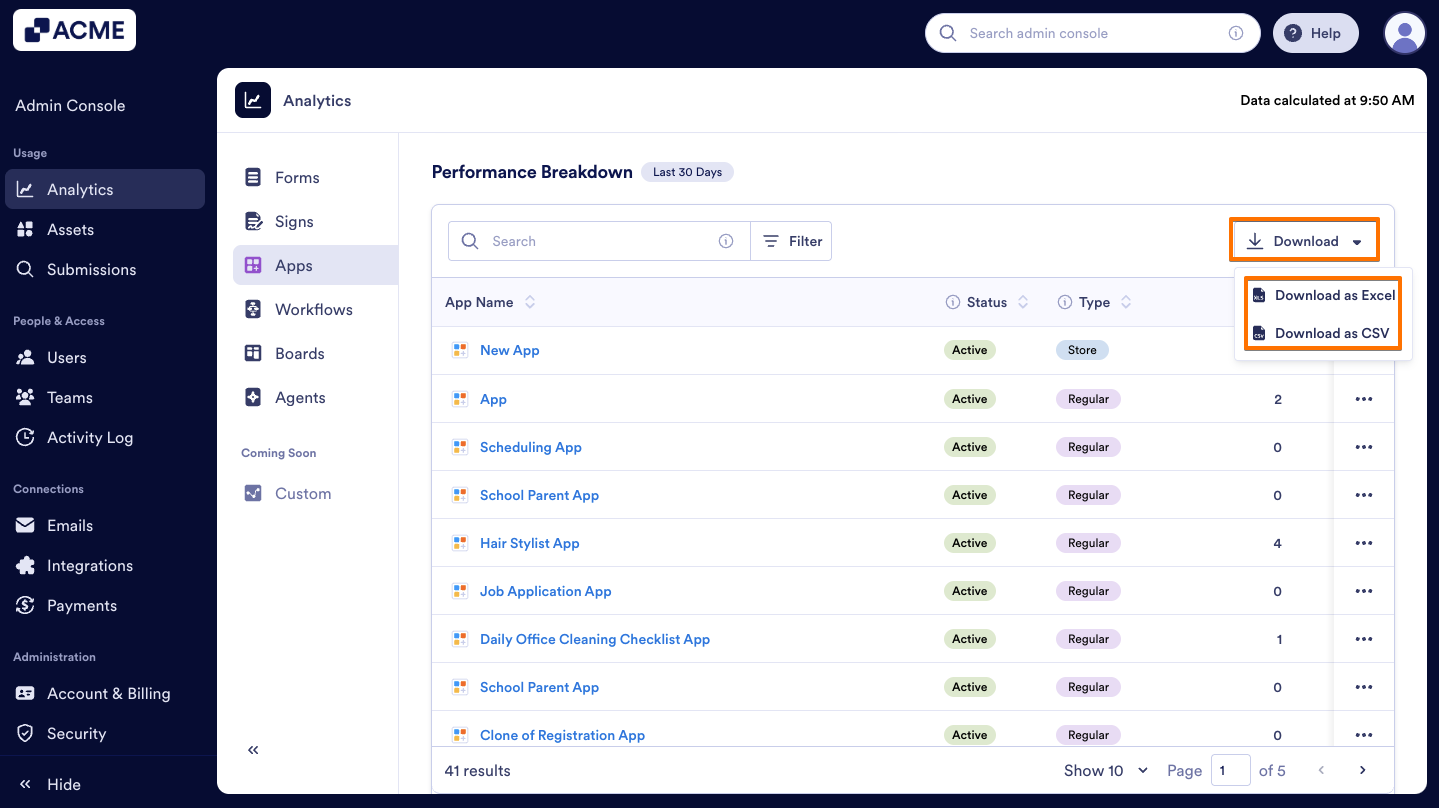
Download App data
In this section, you can also download App data, that includes the App ID, Title, Owner, the number of downloads, the number of views, engagement rate, push notifications, last edit and creation date among other things:
- In App Analytics, under Performance, scroll to Performance Breakdown.

- Click on Download and select how you’d like the file to be downloaded as Excel or CSV.
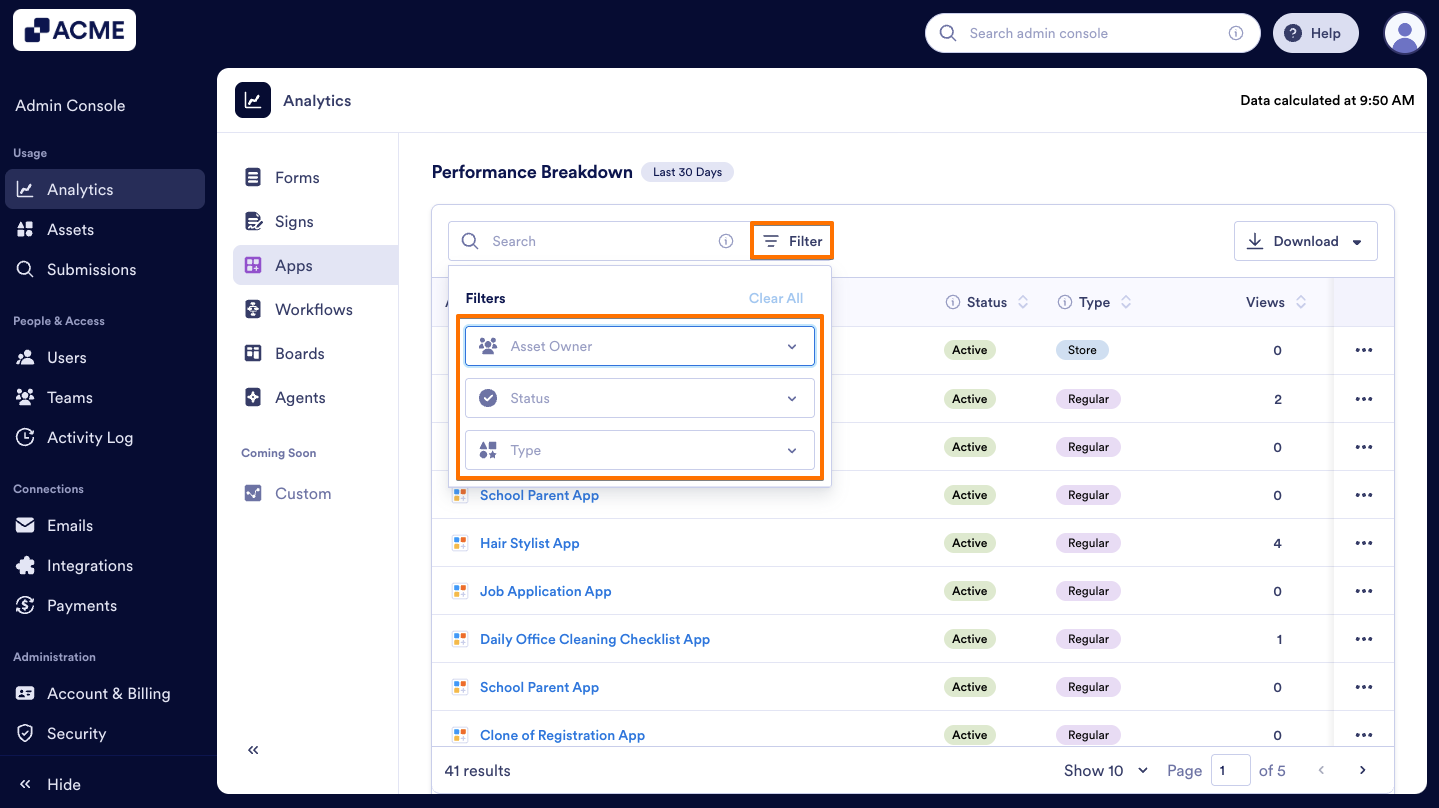
Filter Apps
In the Performance Breakdown section, you can Filter Apps to view details such as Status, Type, Views, Downloads, Engagement Rate, Notifications, and Owner. Here’s how:
- In App Analytics, under Performance, scroll to Performance Breakdown.

- On the right side of the Search bar, click on Filter.
- Select the Asset Owner, Status and Type of the App from the menu.
Traffic Tab
The Traffic Tab provides insights into how and where your organization’s apps are being interacted.
Let’s walk through the steps together:
- On the Apps Analytics page, click on the Traffic tab.
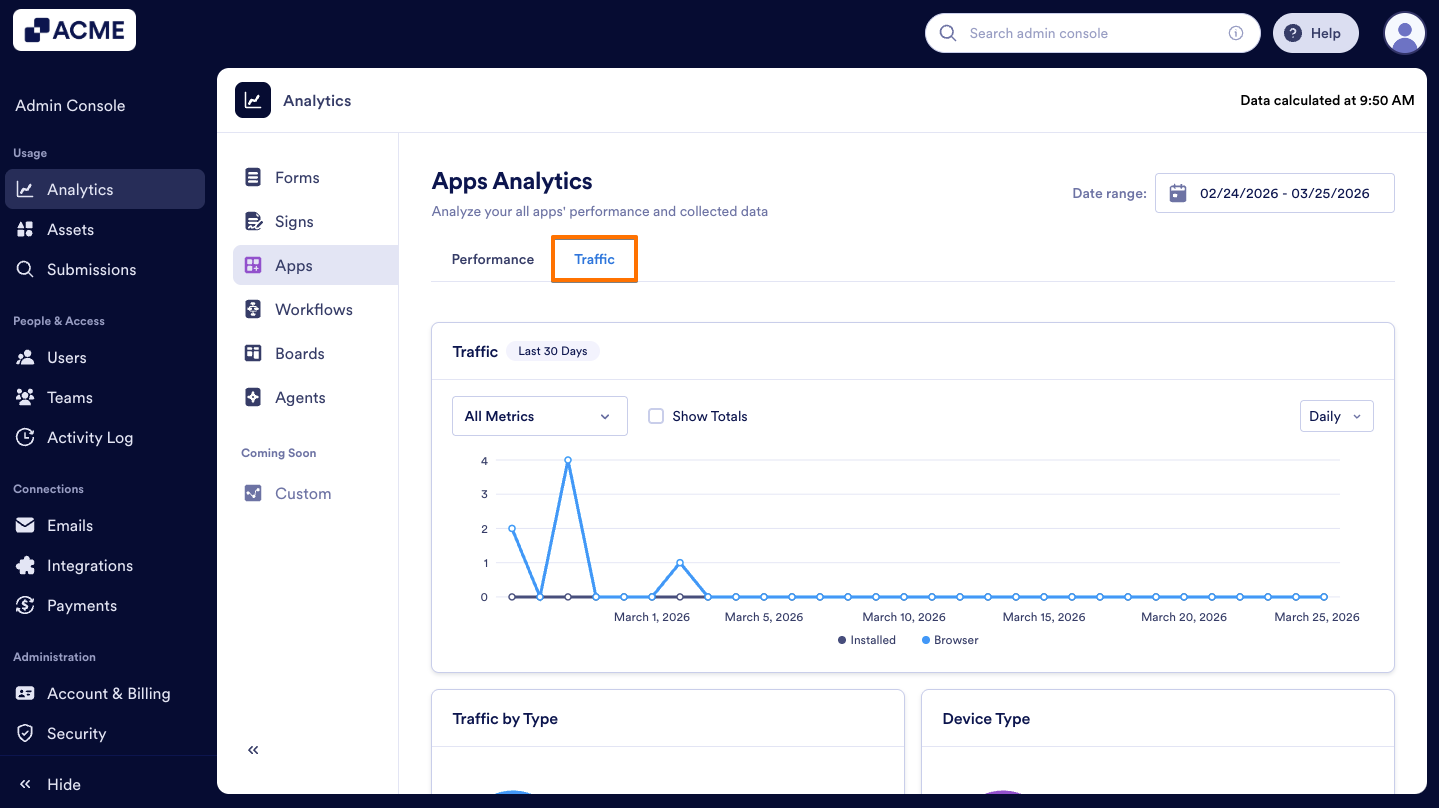
- Then, you will see a line chart displaying the number of installed apps and browser usage within the selected date range.
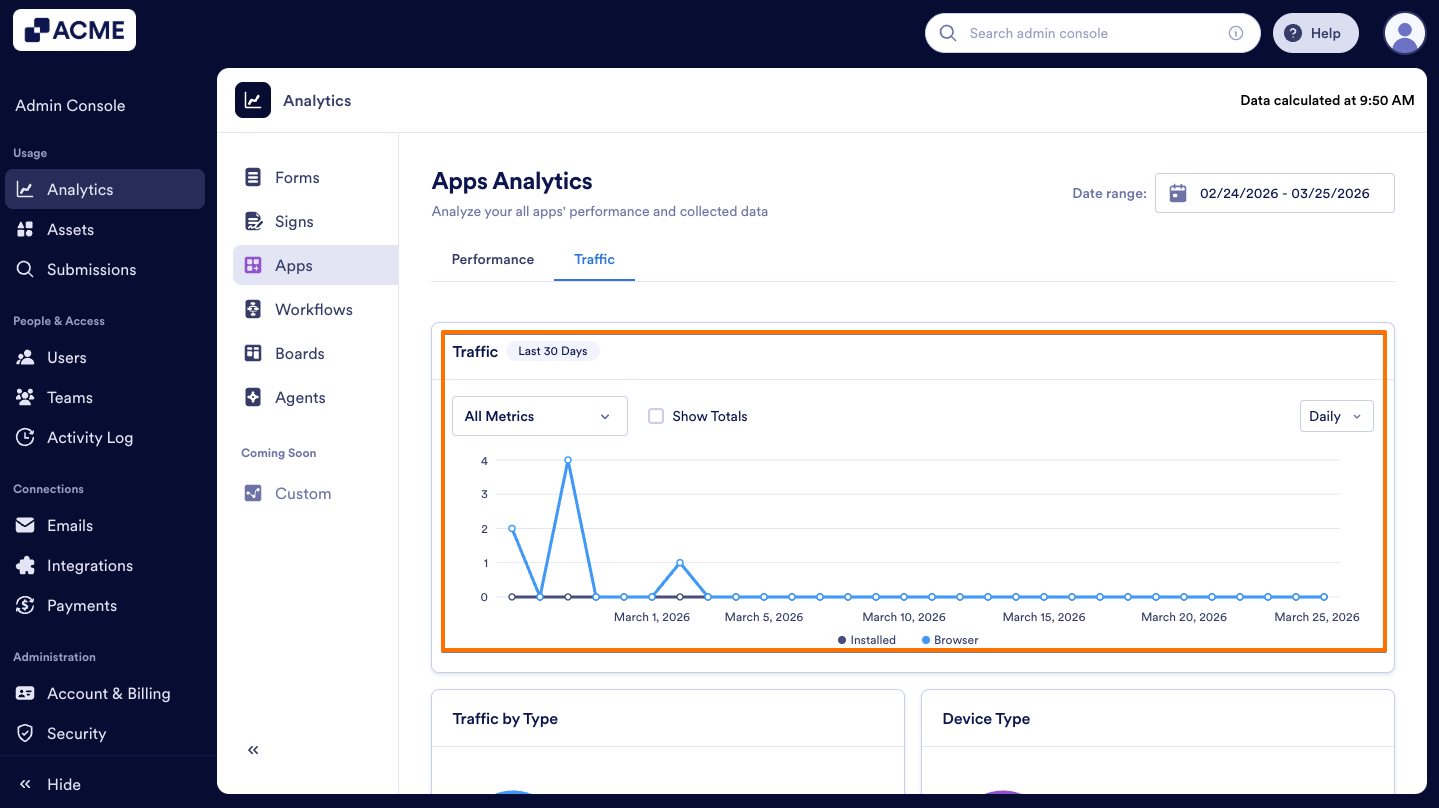
- Additionally, under the Traffic line chart section, you will see the distribution of App Traffic displayed within each card according to the traffic metrics mentioned below.
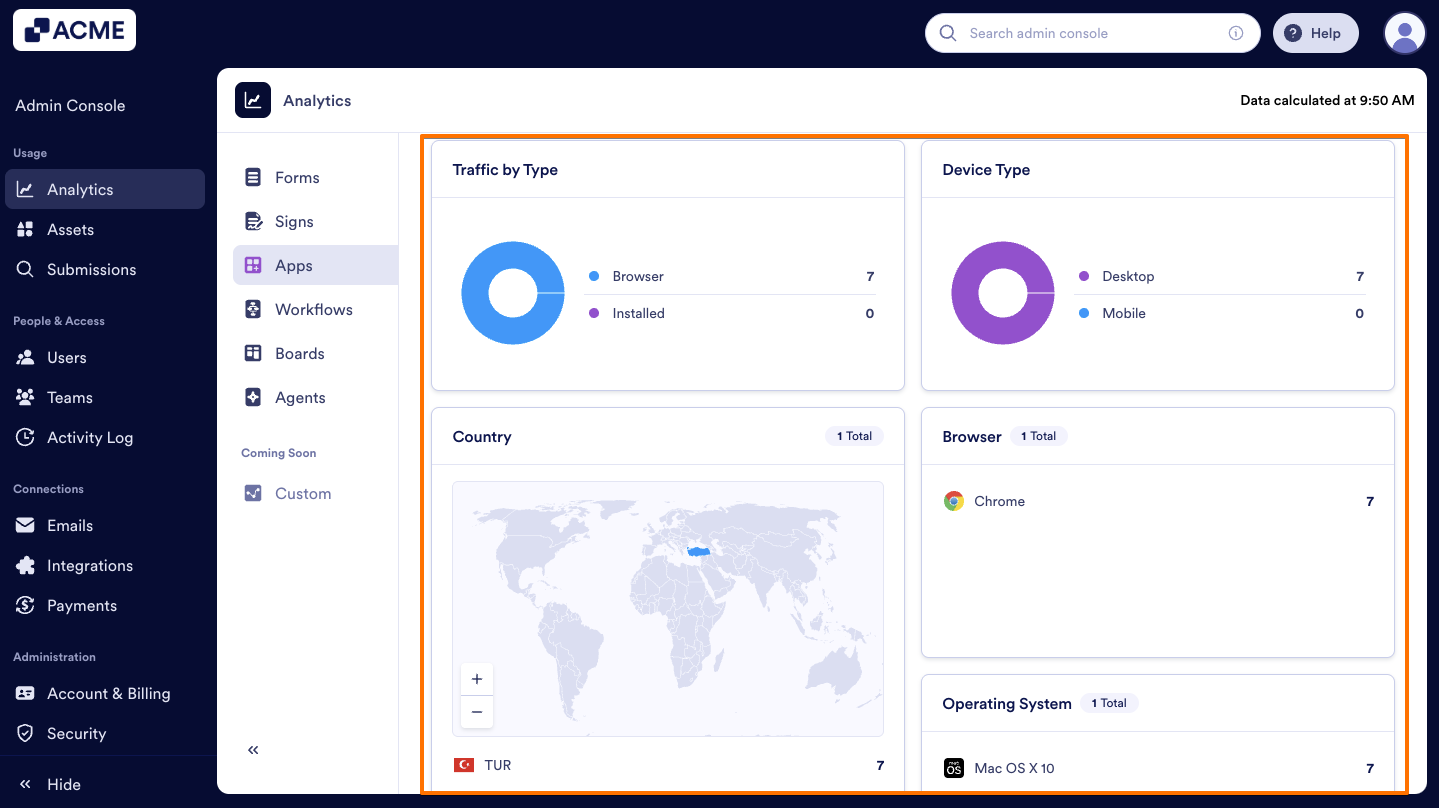
Traffic Metrics:
Under the Traffic chart, there are other insight metrics that you can check out below:
- Traffic by Type: The distribution of visitors by source (Browser vs. Installed)
- Device Type: The distribution of visitors by device type (Desktop vs. Mobile)
- Country: The distribution of visitors by country in the organization
- Browser: The distribution of visitors by browser in the organization
- Operating System: The distribution of visitors by operating system (e.g., Windows, macOS, iOS, Android) in the organization
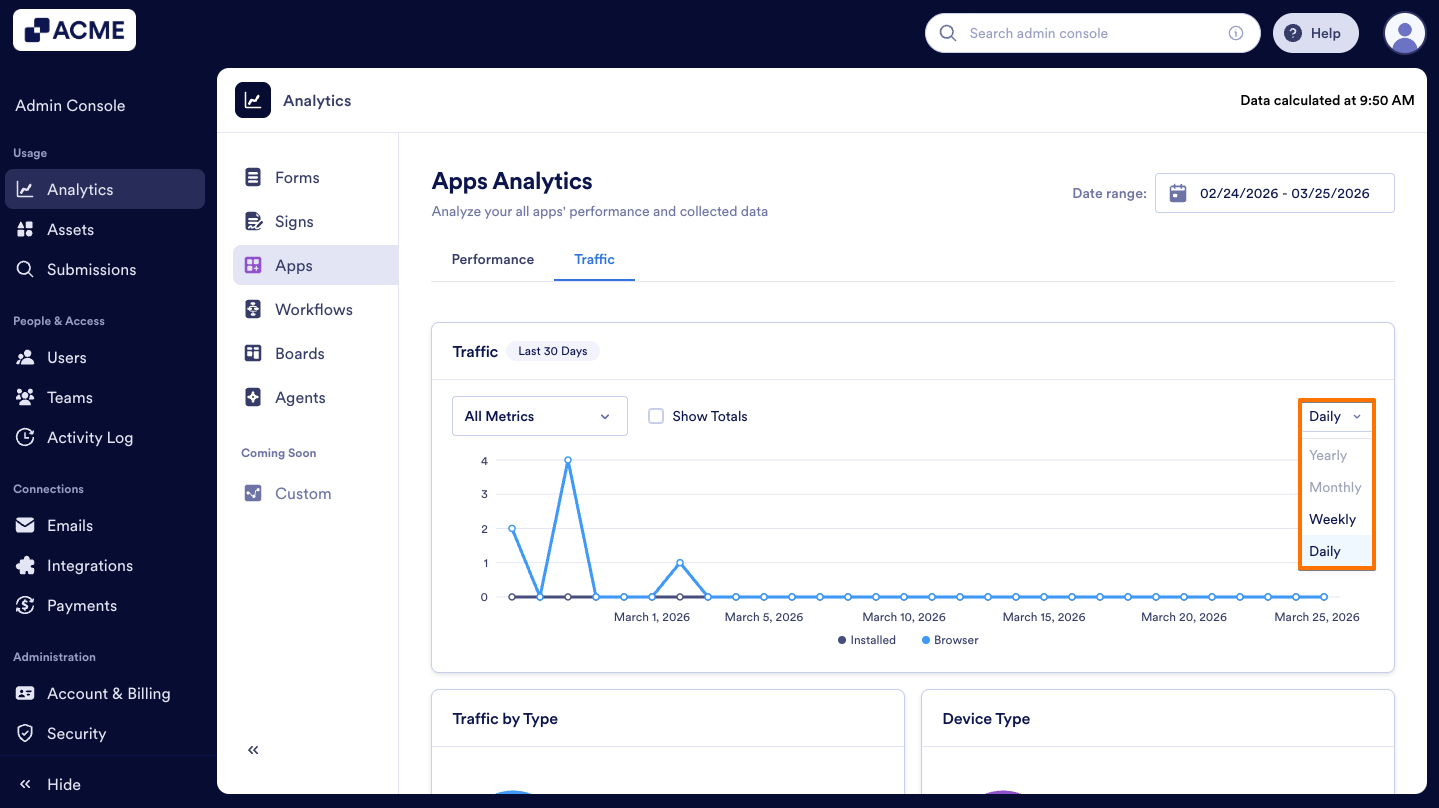
Traffic Chart:
The traffic tab includes a Trends chart that displays the traffic coming via browser or installed apps in the selected date range. Here's how:
- In the Traffic tab, on the upper right side of the page, click on the Date Range to select it.
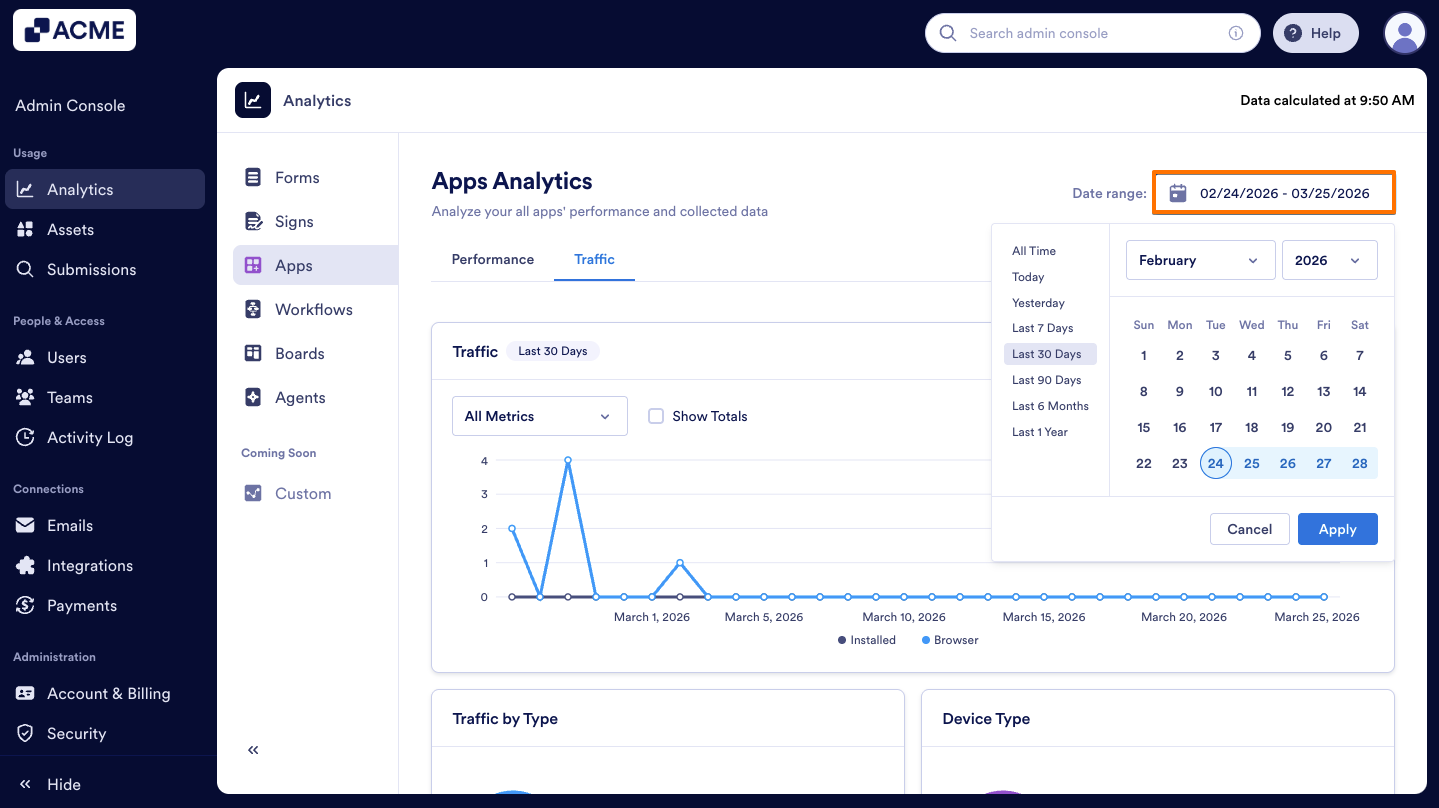
- Next, from the Dropdown menu, choose the metrics to include.
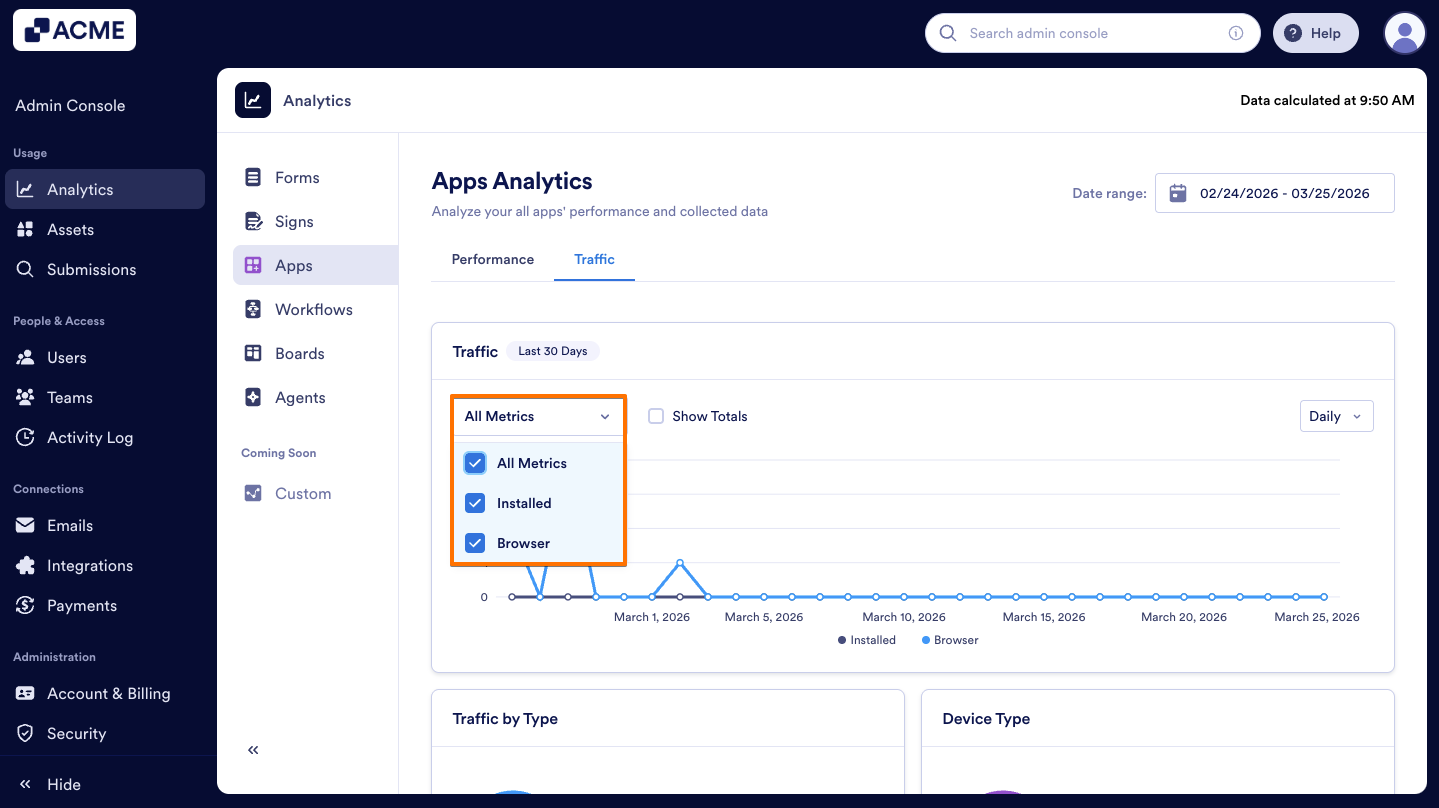
- Finally, set the view to Daily, Weekly, Monthly, or Yearly.
Note
When the date range is selected in the Performance tab, the selection will be applied to the Traffic tab metrics.
View Analytics for a Single App
Under the Performance tab, you can view individual App Analytics by selecting the related app from the Performance Breakdowns list.
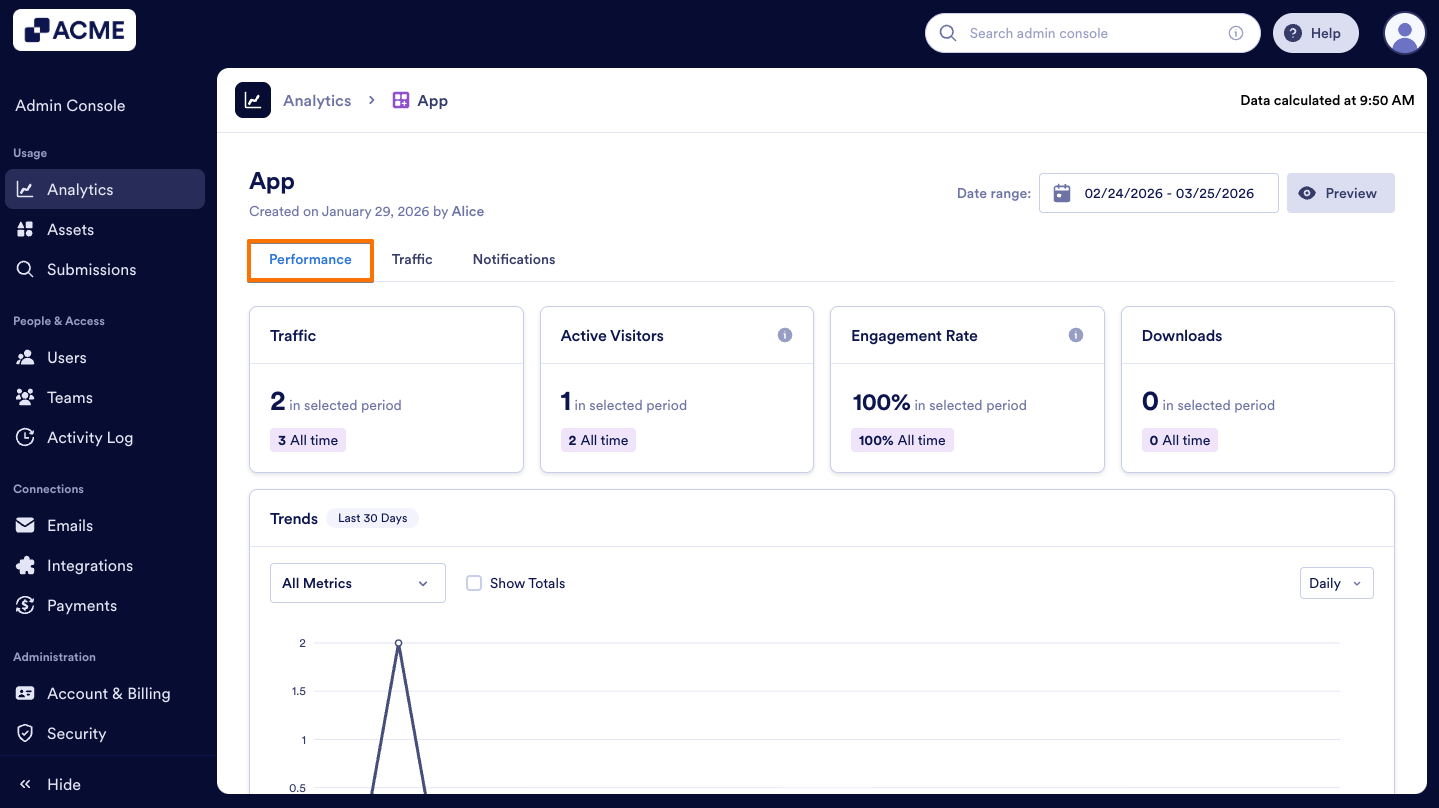
View Performance Analytics for a Single App
Under the Performance tab, you can view performance metrics for a single app such as download number, active visitors, traffic, and engagement rate.
Let's walk through this process together:
- In Apps Analytics, scroll down to Performance Breakdown under the Performance tab.
- Then click on the Three-dots menu next to the app you want to view.
- Select View Analytics from the options.

- In the individual App Analytics page, click on the Performance tab.
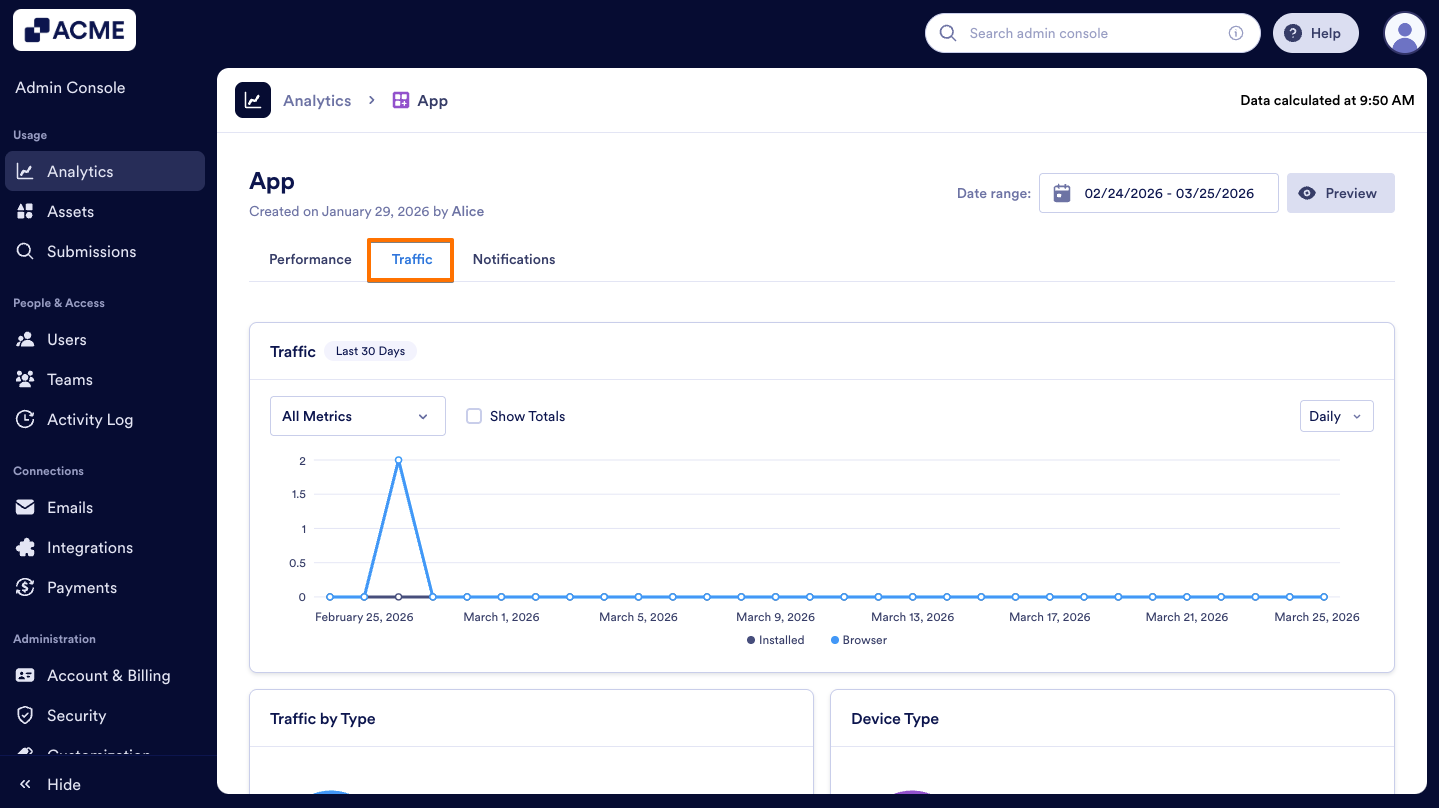
View Traffic For a Single App
Within the single app’s analytics page, you can view Traffic trends for a single app such as traffic type (views via browser or installed app), device type, country, browser, and operating system.
Let’s walk through this process together:
- In Apps Analytics, scroll down to Performance Breakdown under the Performance tab.

- Then click on the Three-dots menu next to the app you want to view.
- Select View Analytics from the options.

- In the individual App Analytics page, click on the Traffic tab.
View Notifications For a Single App
Within the single app’s analytics page, you can view Notification metrics for a single app such as created notification, delivered notification, open rate (users who opened the app via notification), subscribed user.
Let's go through this process together:
- In Apps Analytics, scroll down to Performance Breakdown under the Performance tab.

- Then click on the Three-dots menu next to the app you want to view.
- Select View Analytics from the options.

- In the individual App Analytics page, click on the Notifications tab.
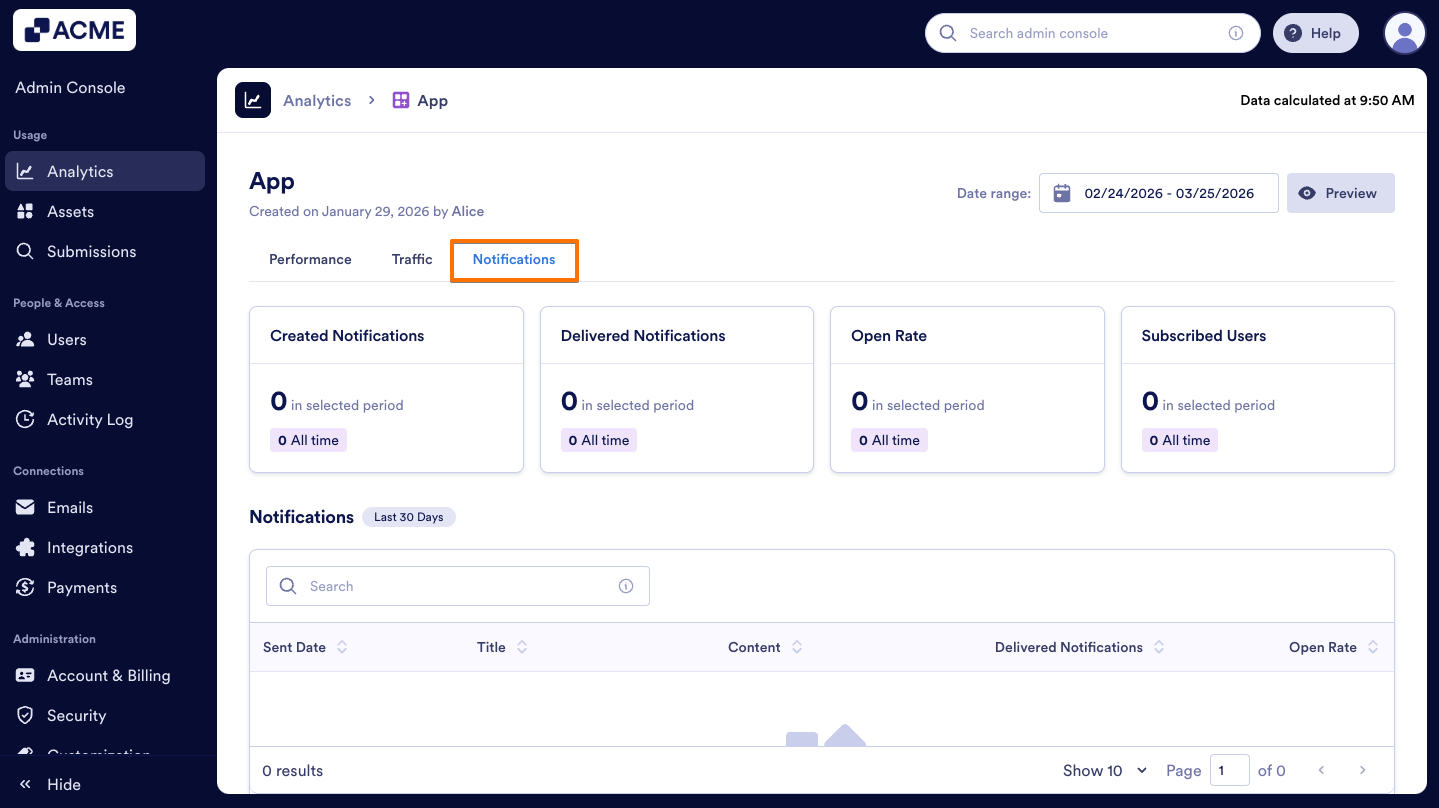
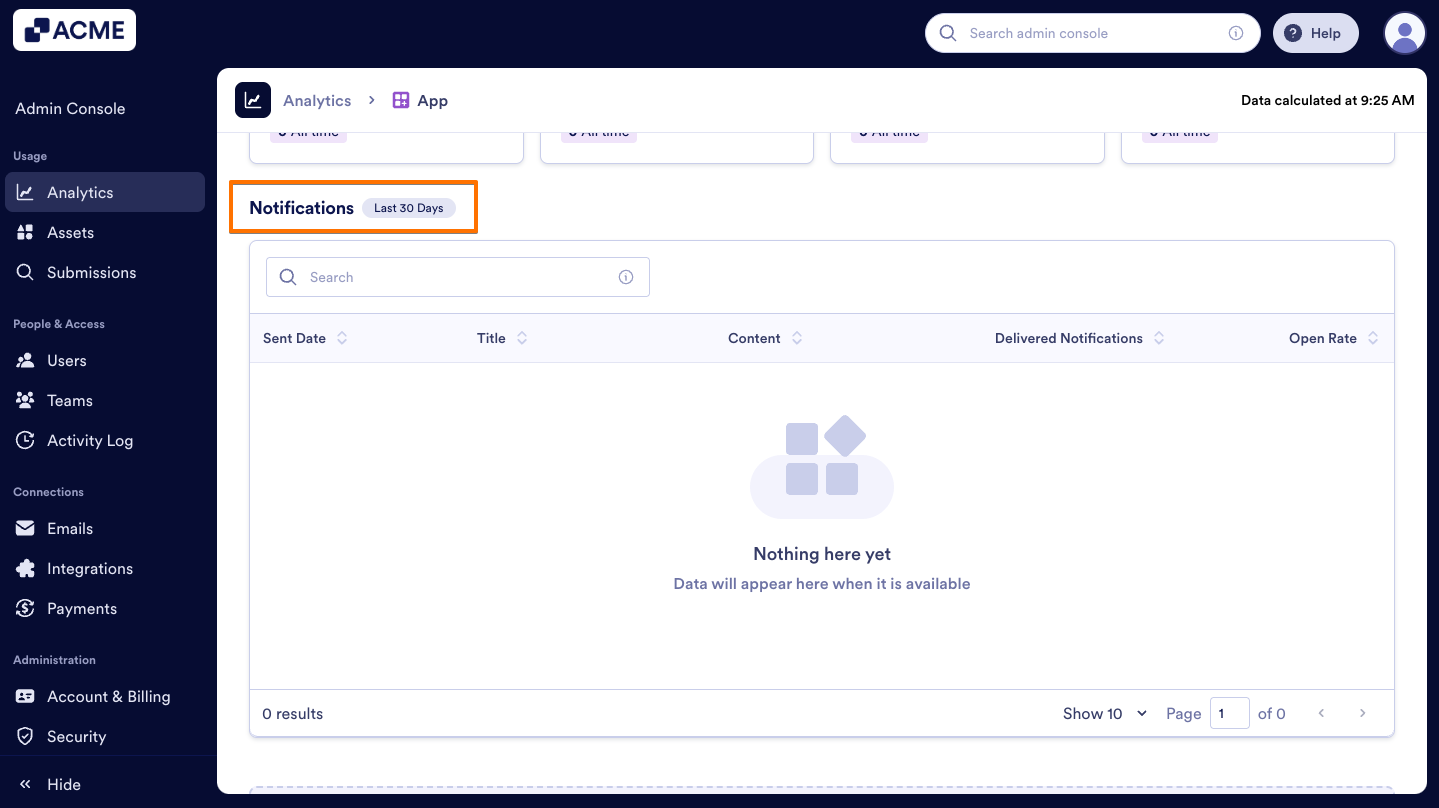
You can also find the notifications list under the notification metrics:
- In the individual App Analytics page, click on the Notifications tab.

- Scroll down to the Notifications section at the bottom.

Send Comment: