The Admin Console provides access to detailed data and analytics on your Boards. As an admin, you can track usage and activity through dedicated sections. Each section offers specific metrics and visualizations to help monitor board usage and overall engagement across your organization.


Boards Analytics
Note
Data in the Analytics page updates every 5 minutes.
Let’s walk through how to reach the Boards Analytics:
- In the Admin Console, on the left side of the page, click on Analytics.
- Then, click on Boards to open Boards Analysis data.
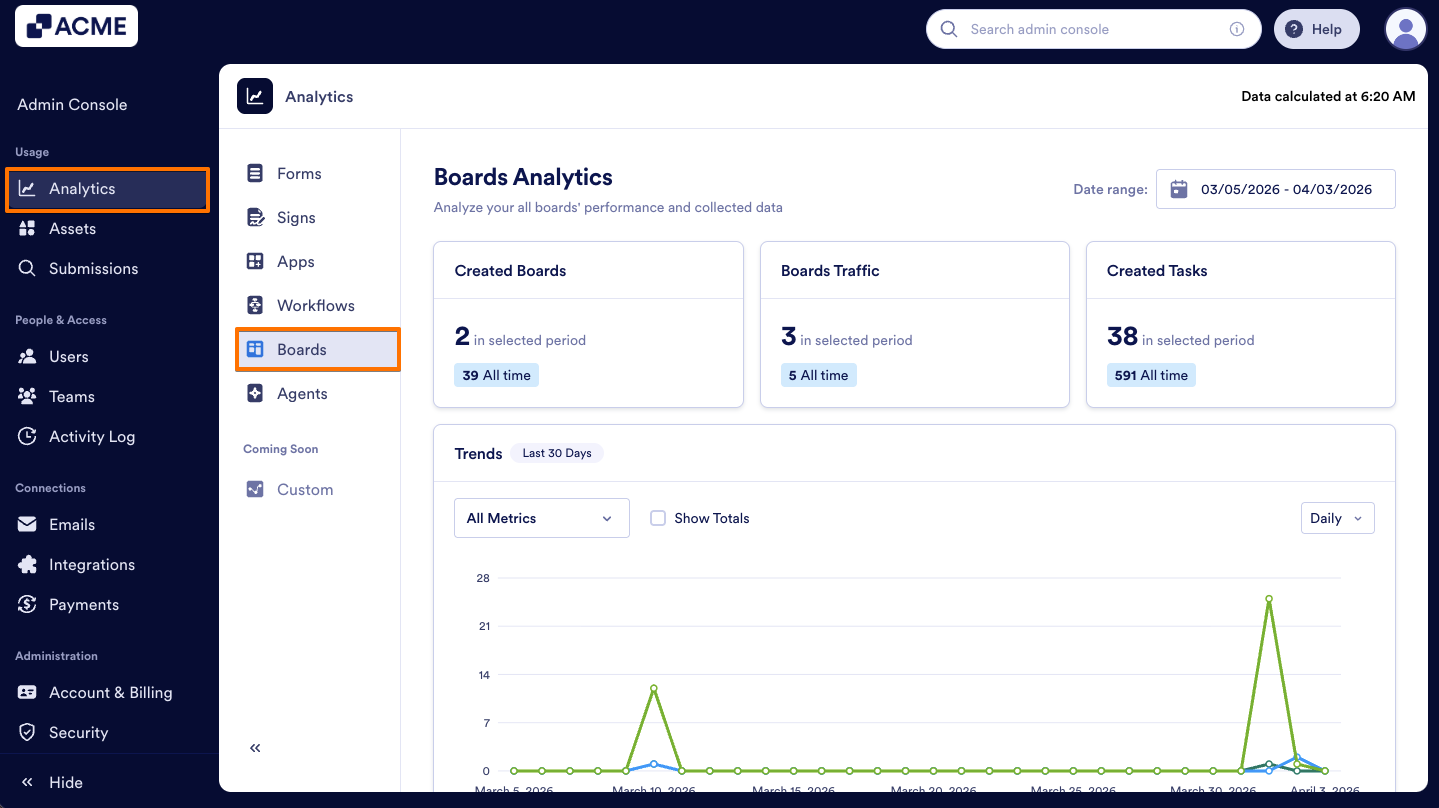
Boards Metrics
- Created Boards: The total number of boards that have been created within the selected date range.
- Boards Traffic: The number of board views received in the organization within the selected date range.
- Created Tasks: The total number of tasks that have been created within the selected date range.
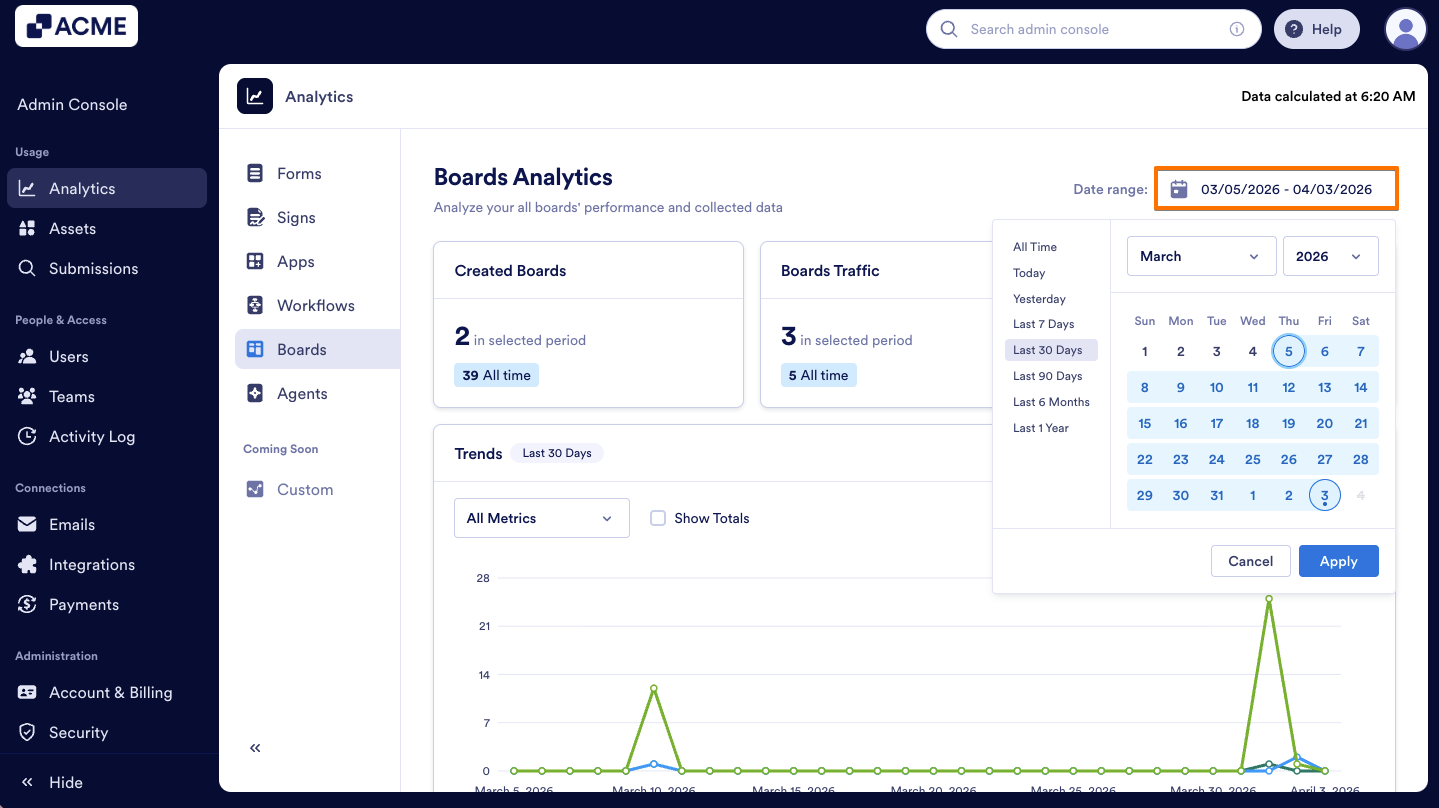
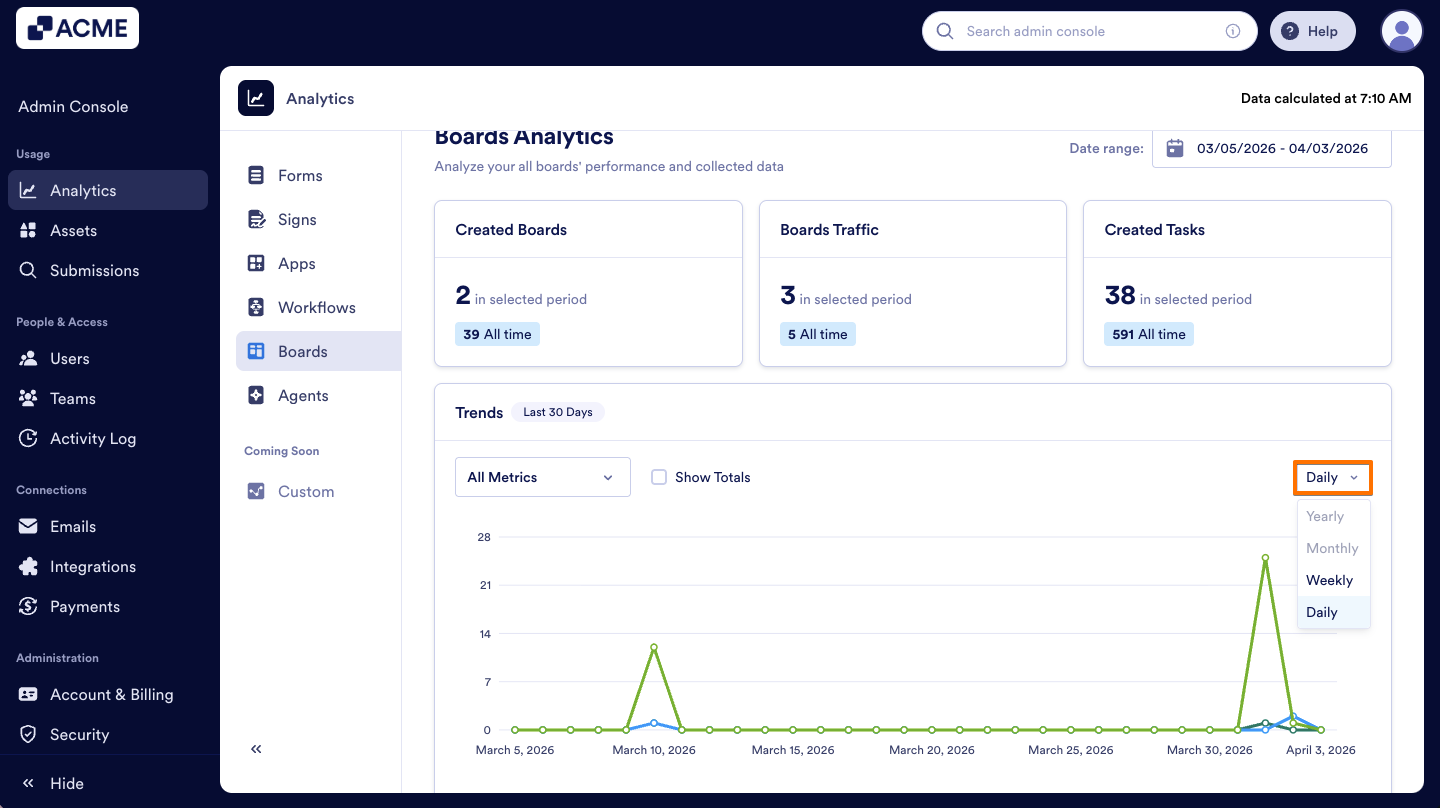
Trends Chart
Under the cards display of the metrics, a Trends line chart is available. This line chart visualizes the metrics above and helps you track your organization’s board performance across a selected date range. You can also decide which metrics to include or exclude and adjust the chart view by daily, weekly, monthly, or yearly intervals. Let me show you how:
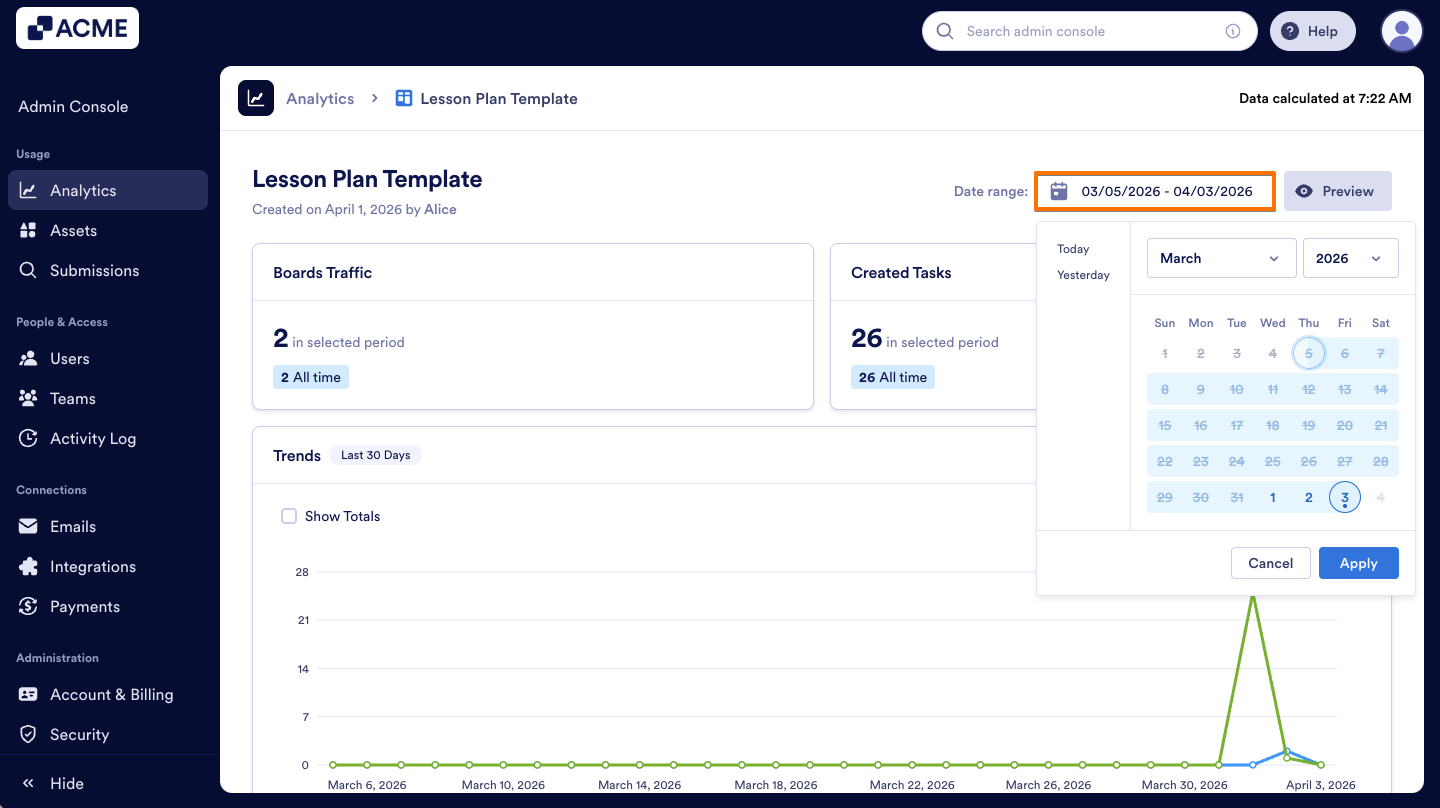
- On the Boards Analytics page, first click the Date Range selector and select the date.
- Next, from the Dropdown menu, choose the metrics to include (Created Boards, Traffic, Created Tasks)
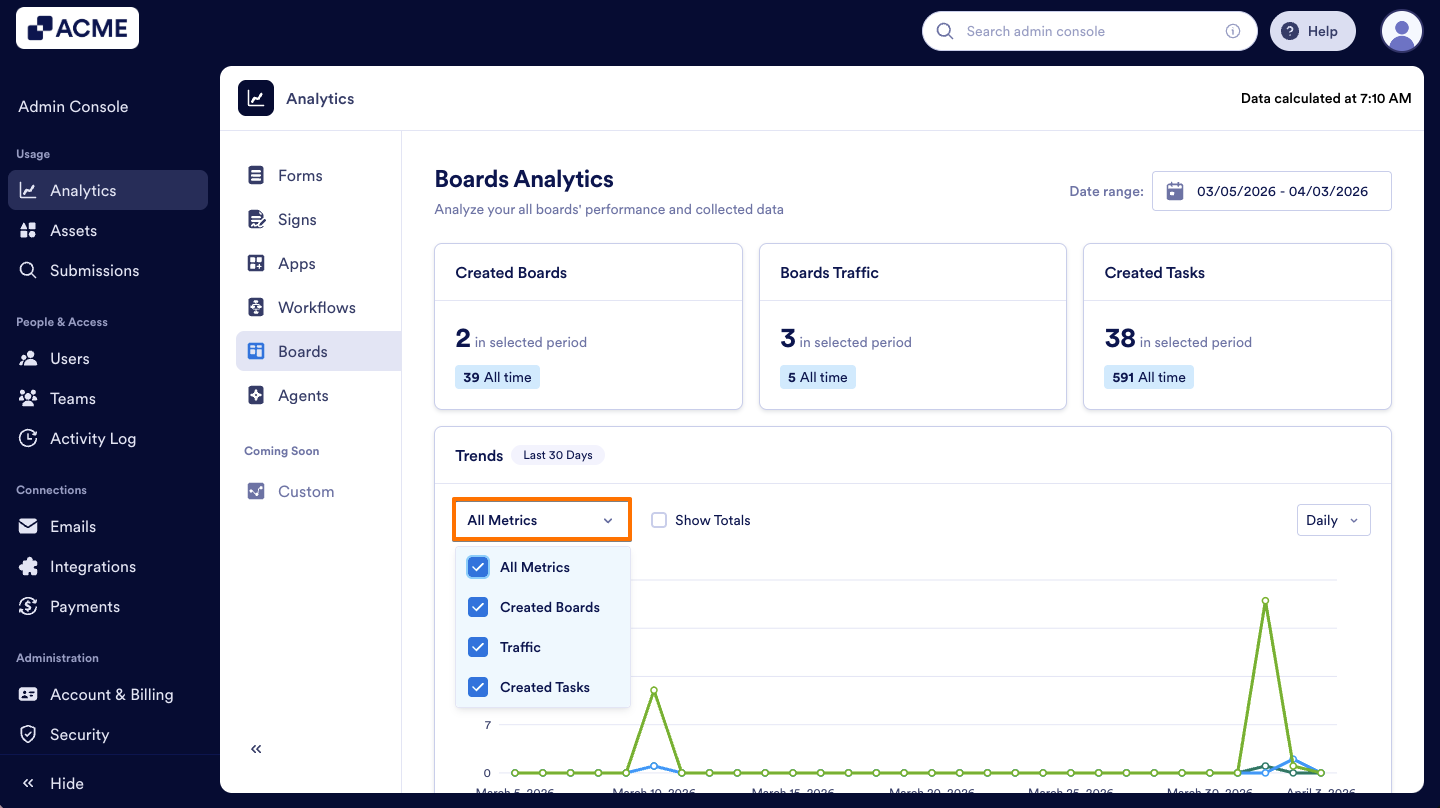
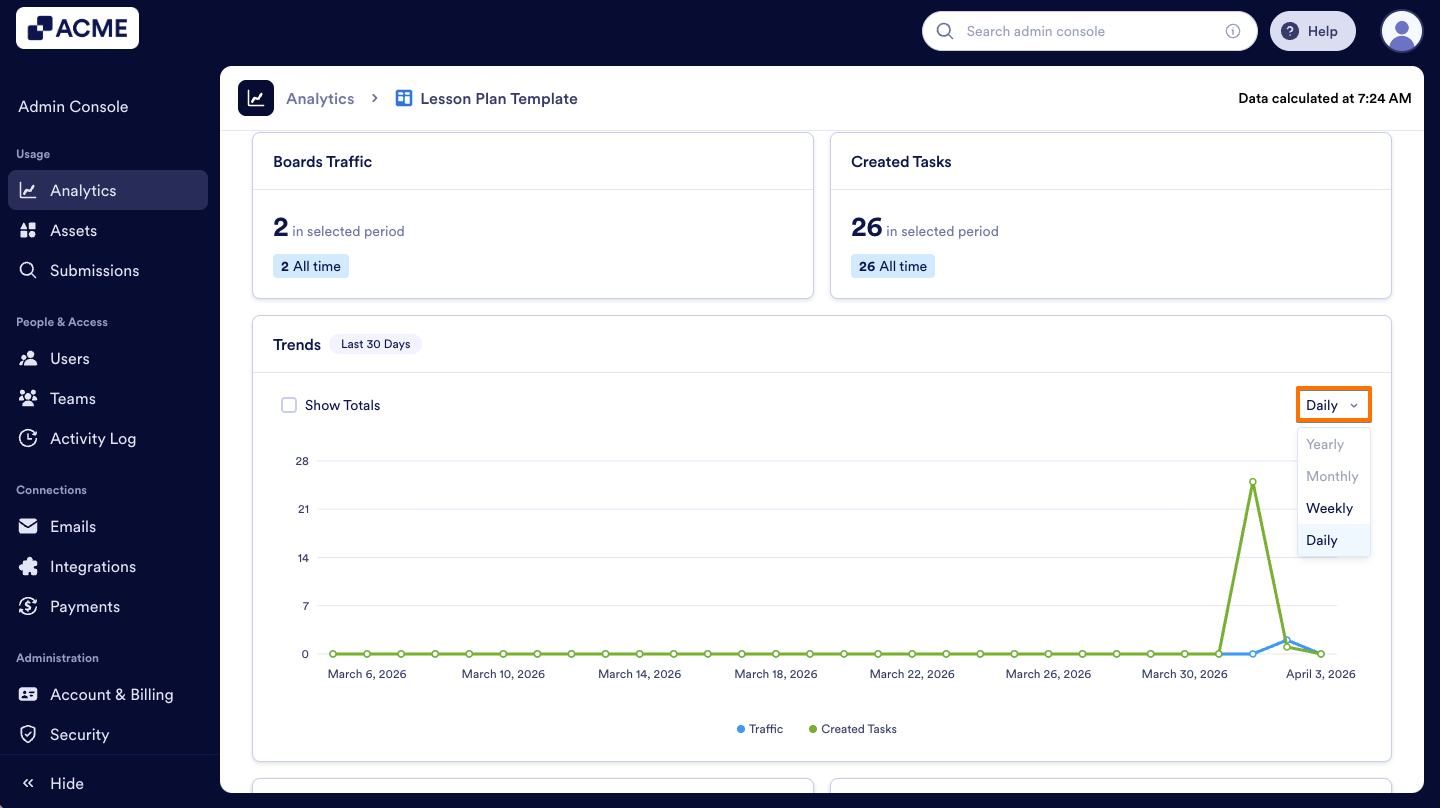
- Finally, set the view to Daily, Weekly, Monthly, or Yearly.
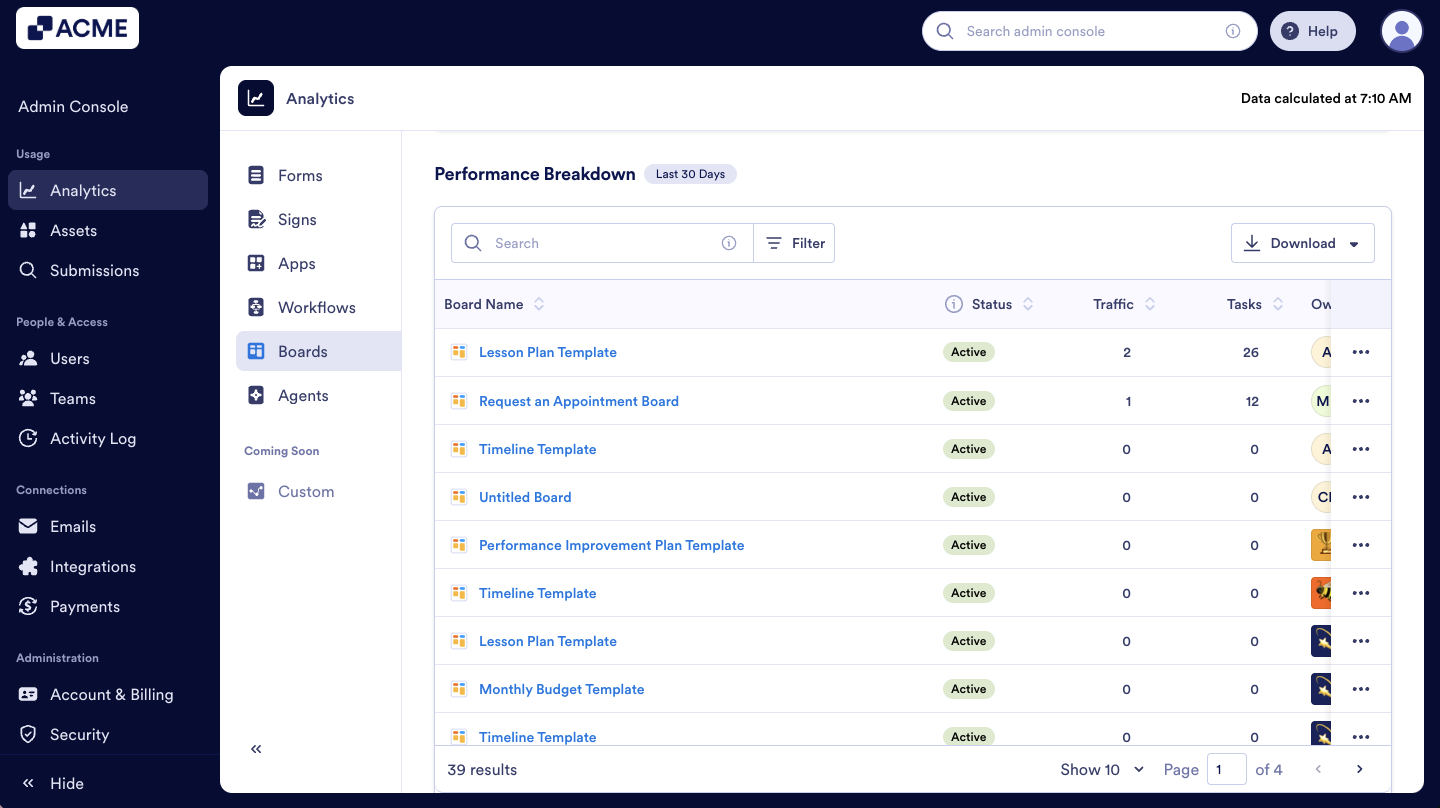
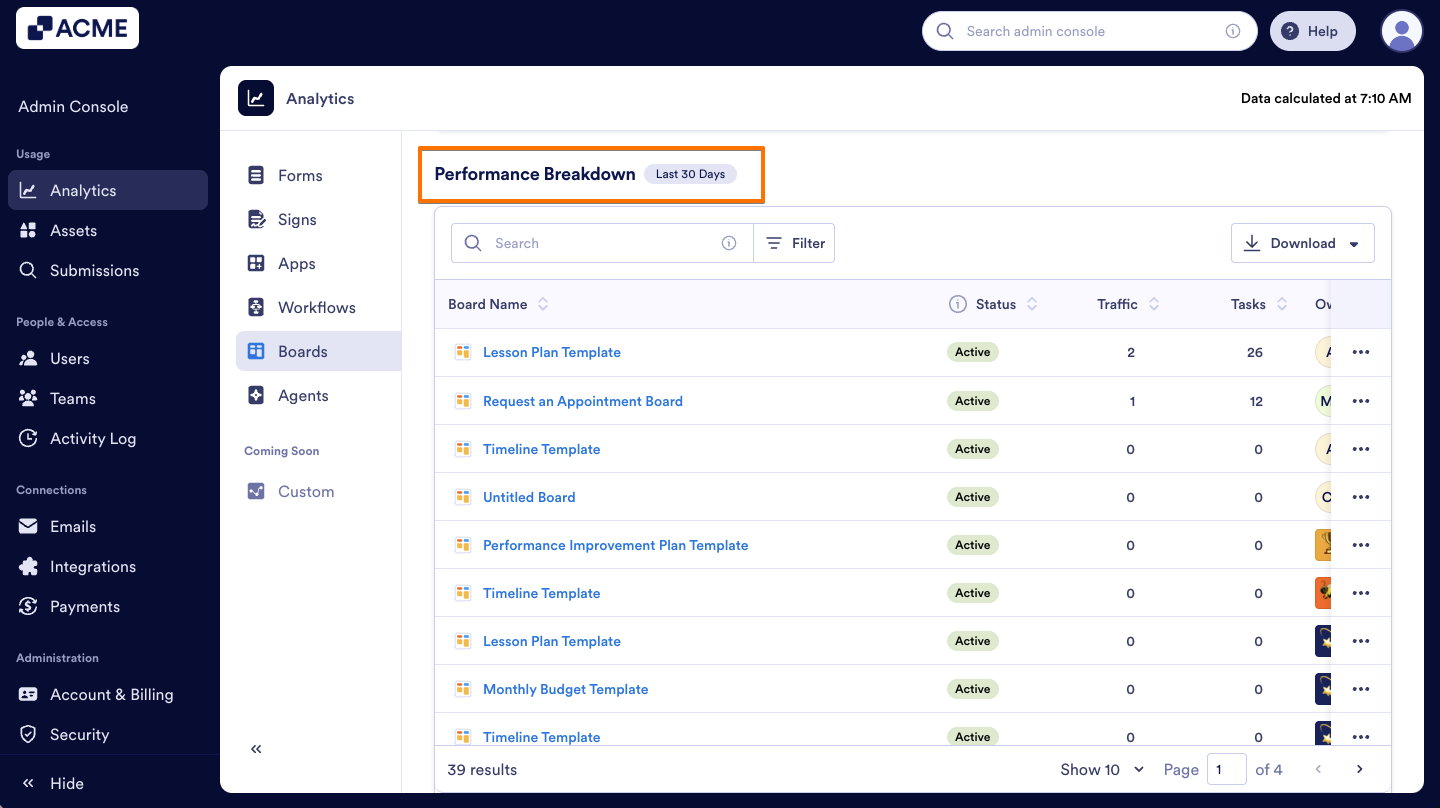
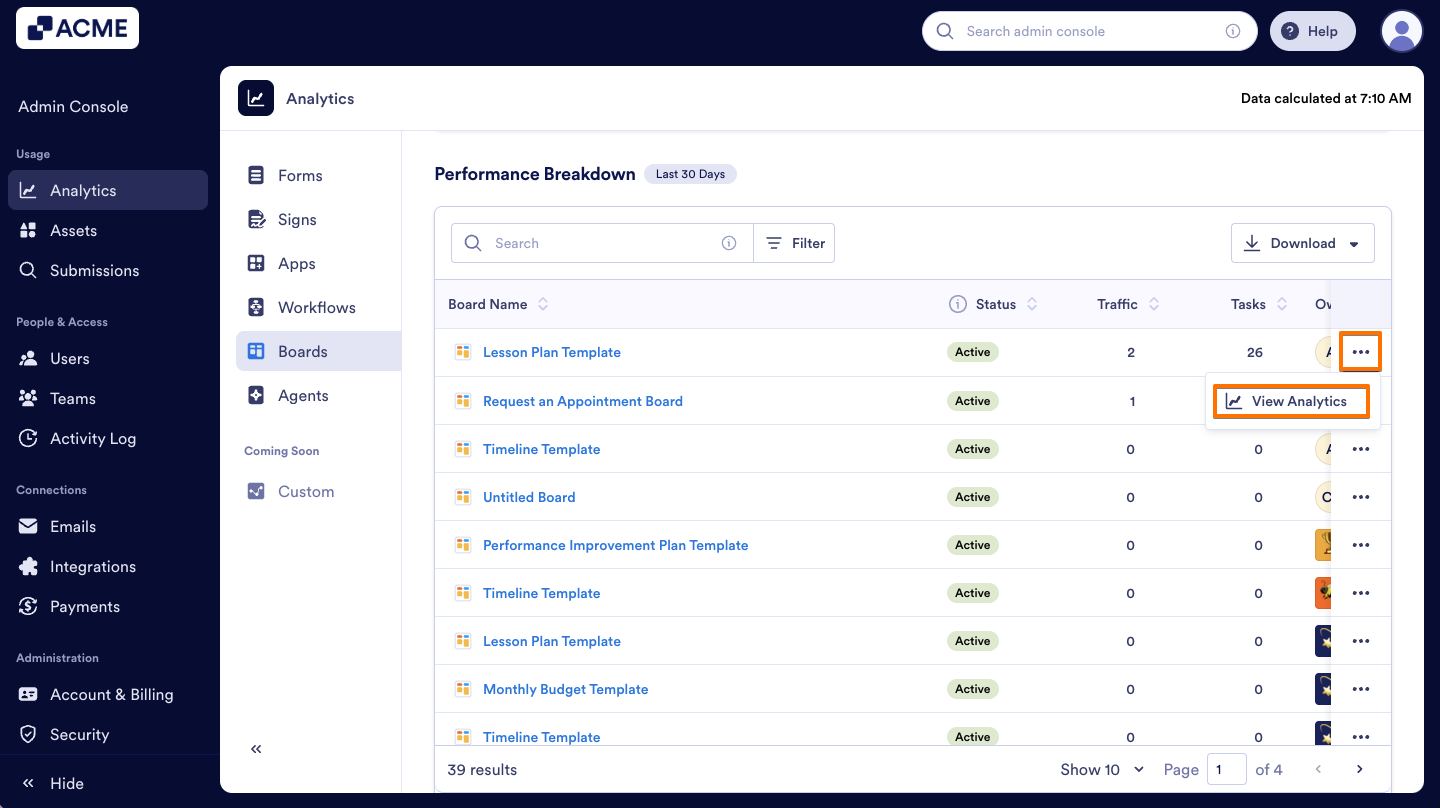
Performance Breakdown
In the Performance Breakdown section, you will see the distribution of all Boards based on the selected date range. The list shows each Board’s Name, Status, Traffic, Tasks, and Owner.
Note
When the date range is selected at the top of the page, the selection will be applied to all metrics except Status and Owner.
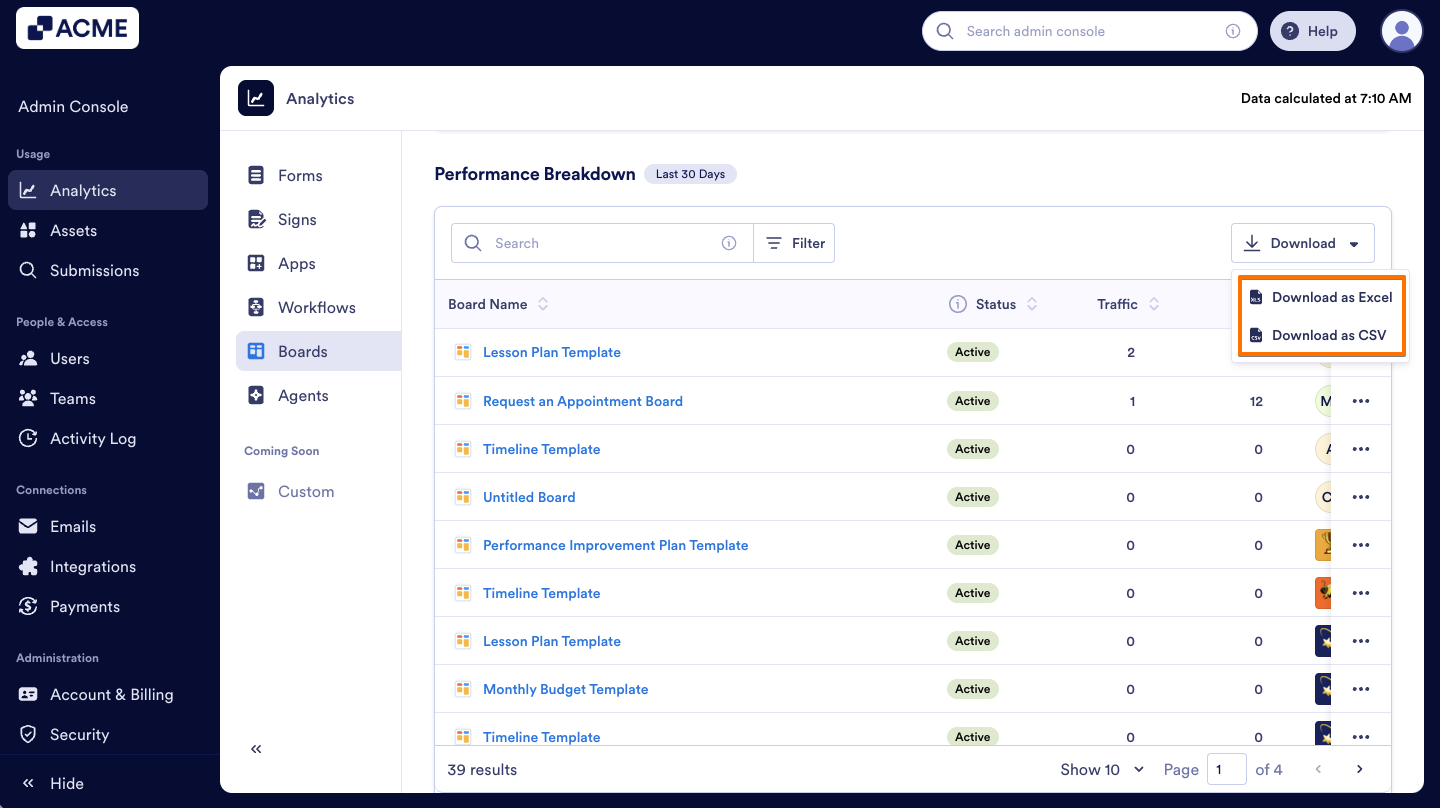
Download Boards Data
In this section, you can also download Boards data, which includes Boards’ ID, Name, Status, View, Task, Creation Date, Last Edit, and Owner. Here’s how:
- In Boards Analytics, scroll down to the Performance Breakdown section.
- On the upper right side of the list, click on Download.
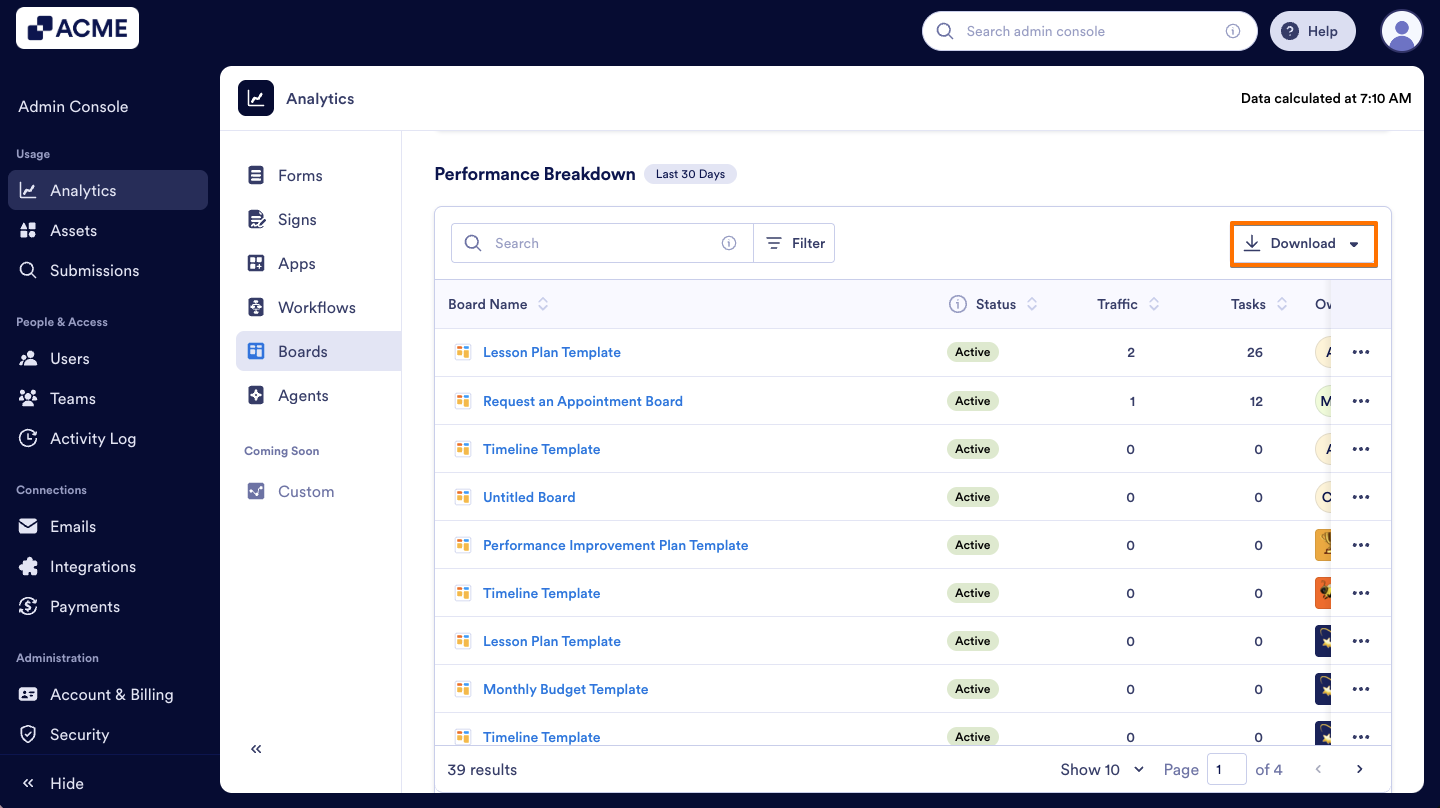
- Then, select the desired file type, Excel or CSV, to download.
Filter Boards
In the Performance Breakdown section, you can filter your boards to view specific Boards and their data. Let me show you how:
- In Boards Analytics, scroll to the Performance Breakdown section.

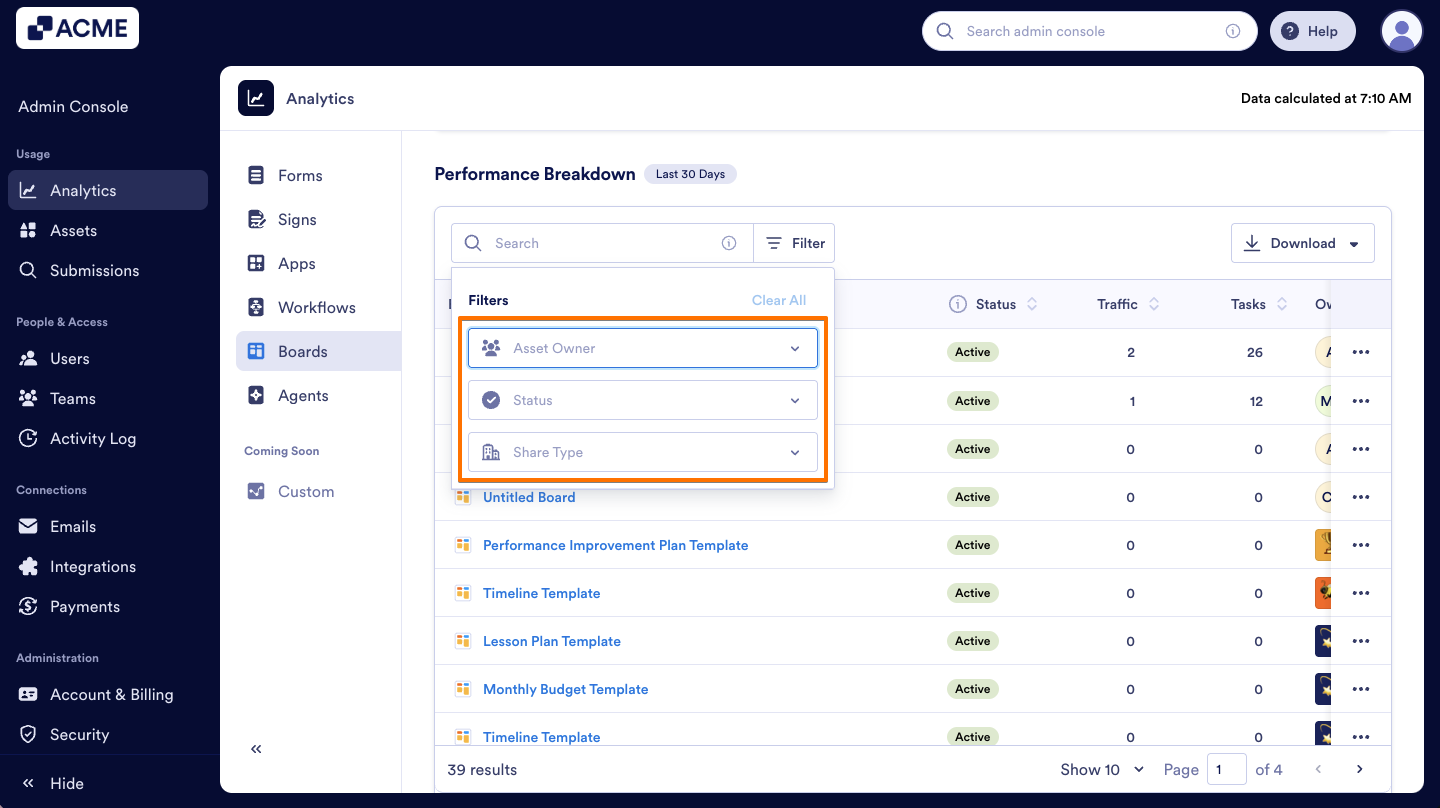
- On the right side of the Search bar, click on Filter.
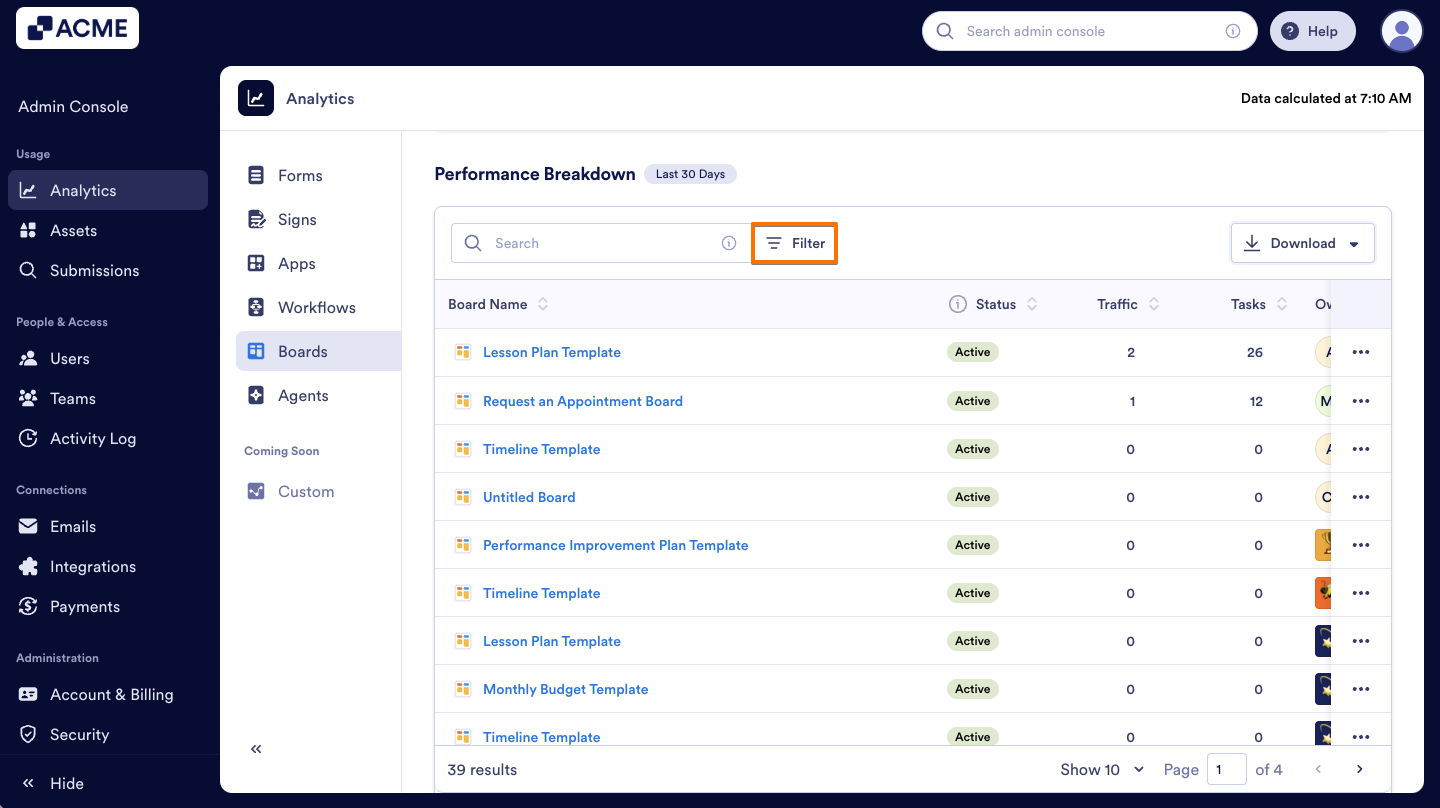
- Select Asset Owner, Status, and Share Type to filter the Boards in your organization.
View Analytics for a Single Boards
You can also view the data for a specific board on the Analytics page. We’ll walk through together on steps:
- In Boards Analytics, scroll to the Performance Breakdown section.

- Locate the boards you’d like to review and click on the Three dots icon next to it.
- Then, select View Analytics.

On the dedicated page, you will see the following sections:
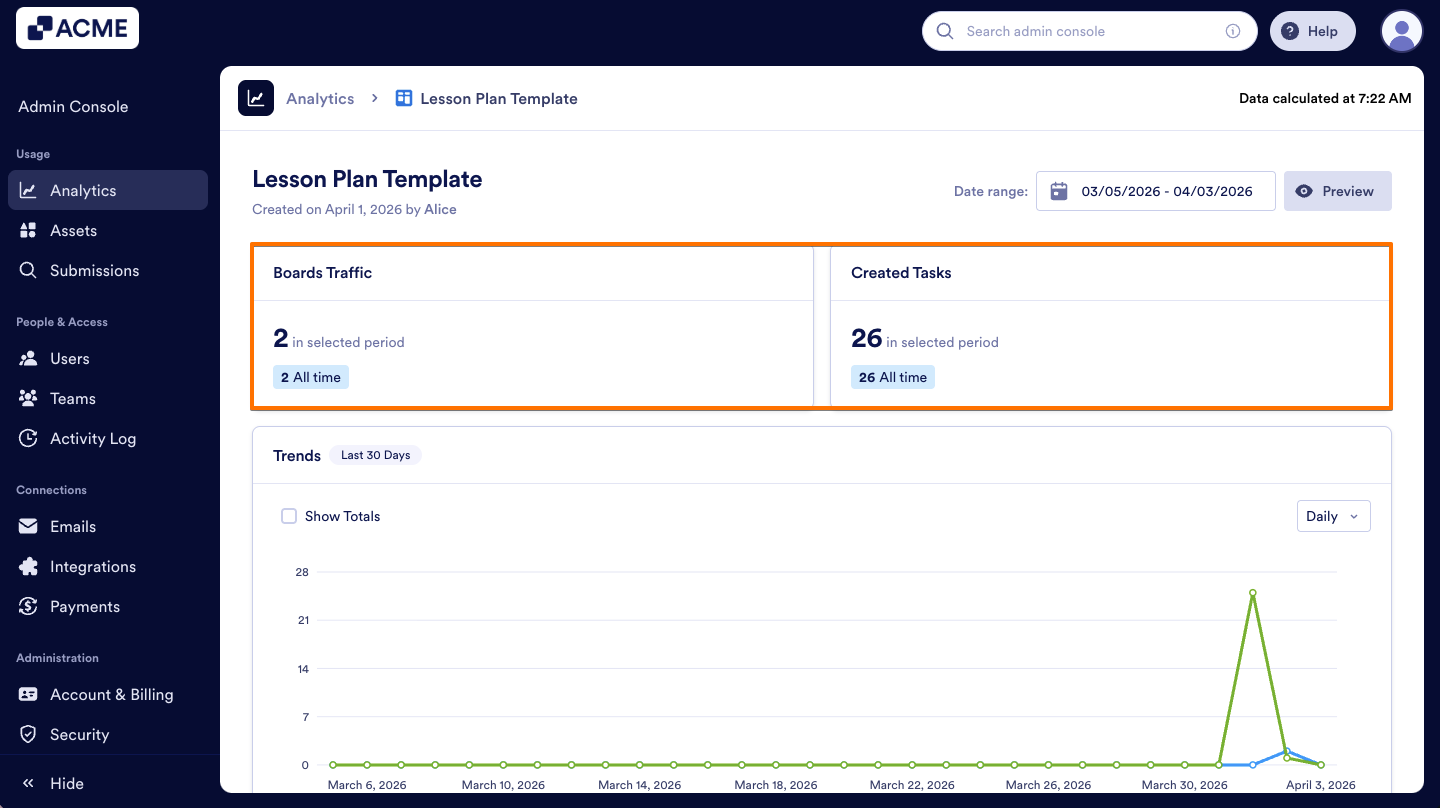
Single Boards Metrics
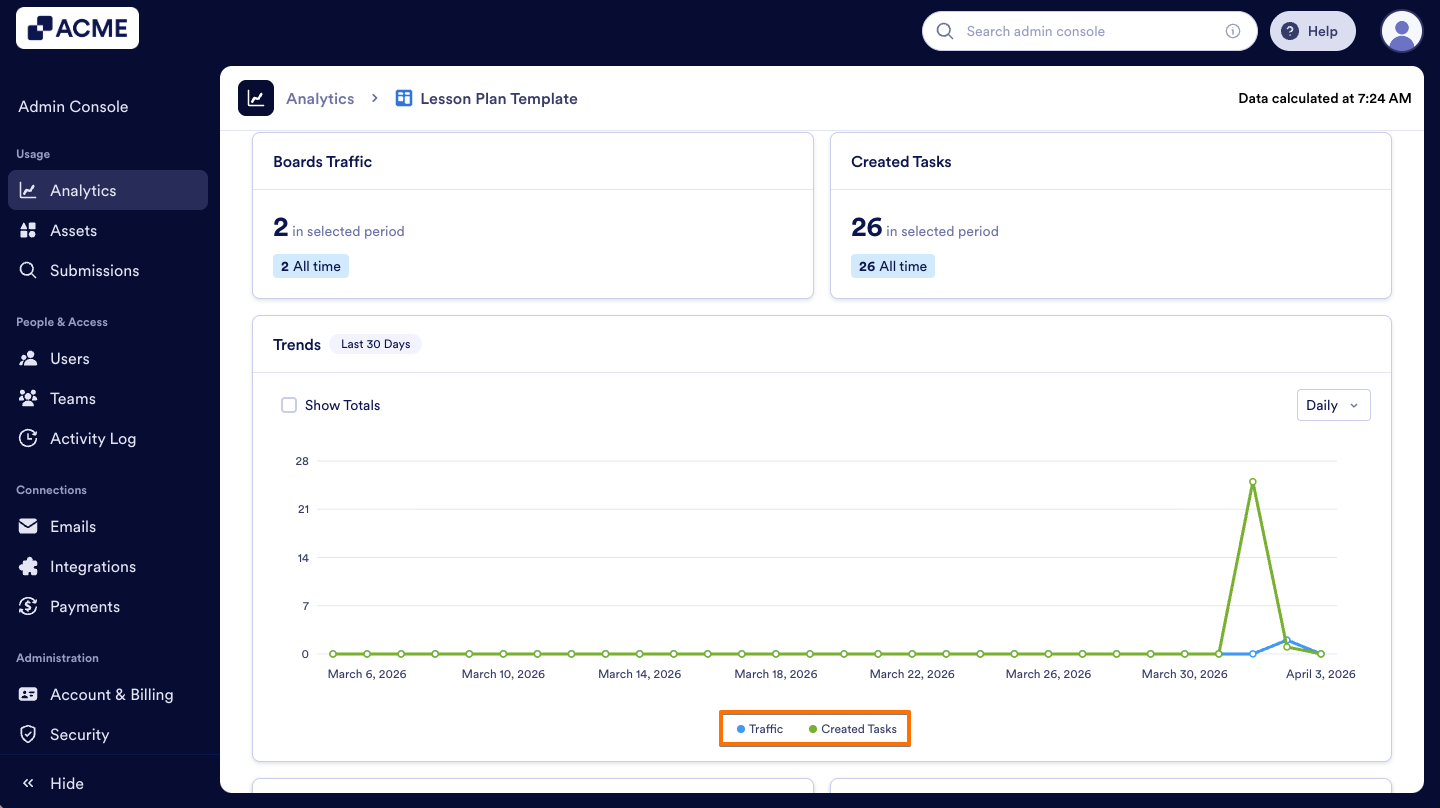
- Boards Traffic: The total number of views the selected boards received during the chosen time period.
- Created Tasks: The total number of tasks created in the selected boards during the chosen time period.
Trends Chart
Below the metrics, you will see the trend chart specific to this board. This chart visualizes how the board’s traffic and task creation have changed over the selected time period. You can also choose which metrics to display and adjust the chart view by day, week, month, or year to analyze trends more effectively. Let’s walk through how to use the trend chart on a single workflow page:
- First, select the desired Date Range using the selector at the top right of the page.
- Next, at the bottom of the chart, click on Metrics to choose which data points to visualize.
- Finally, set the chart view to Daily, Weekly, Monthly, or Yearly.
Connected Assets
Under the Trends line chart, there is a card that provides an overview of all assets linked to the selected boards. It shows the total number of Boards, Forms, Signs, Agents, and Workflows that are associated, giving you insight into how these boards interact with other assets across your organization.
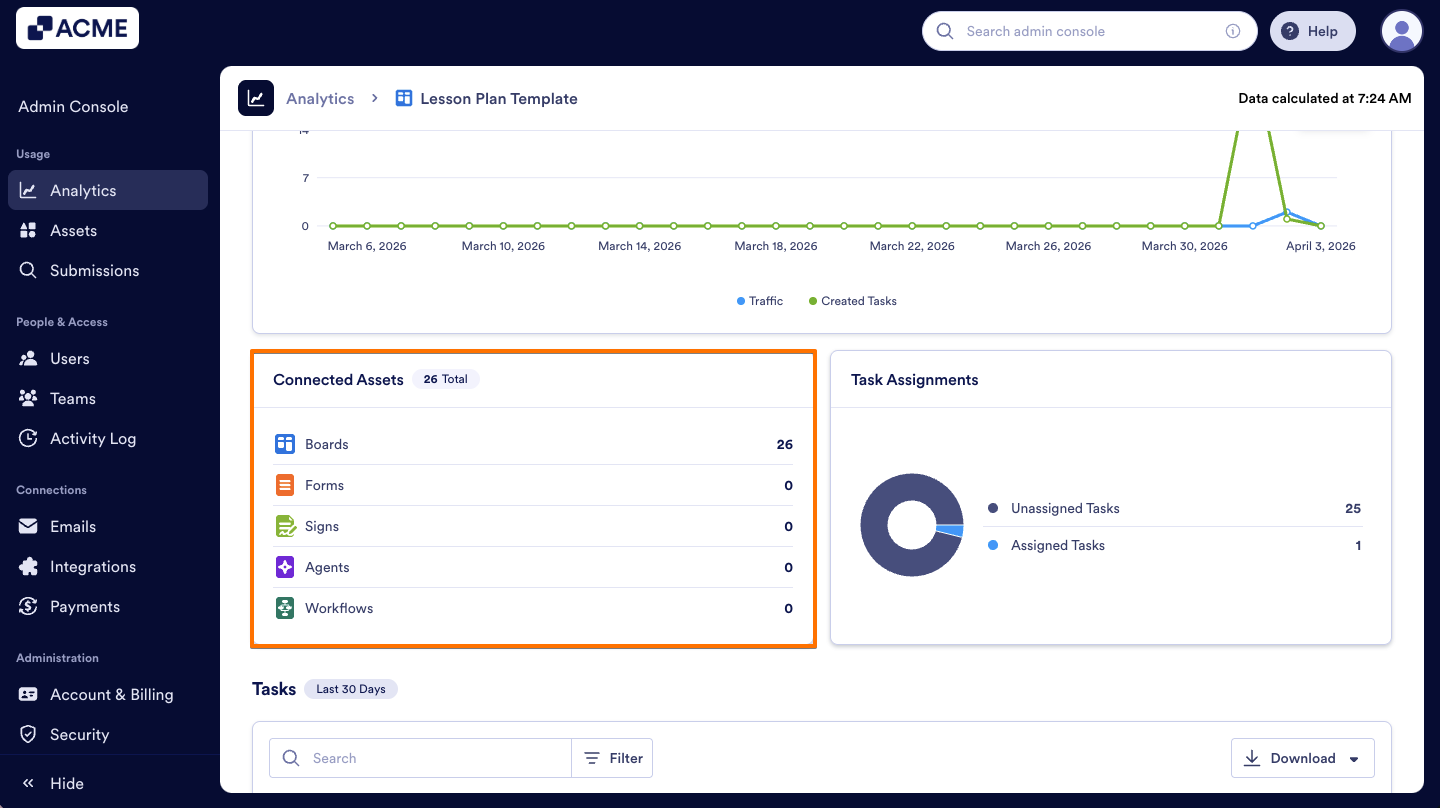
Task Assignments
Next to the Connected Assets card, a donut chart shows the ratio of assignments:
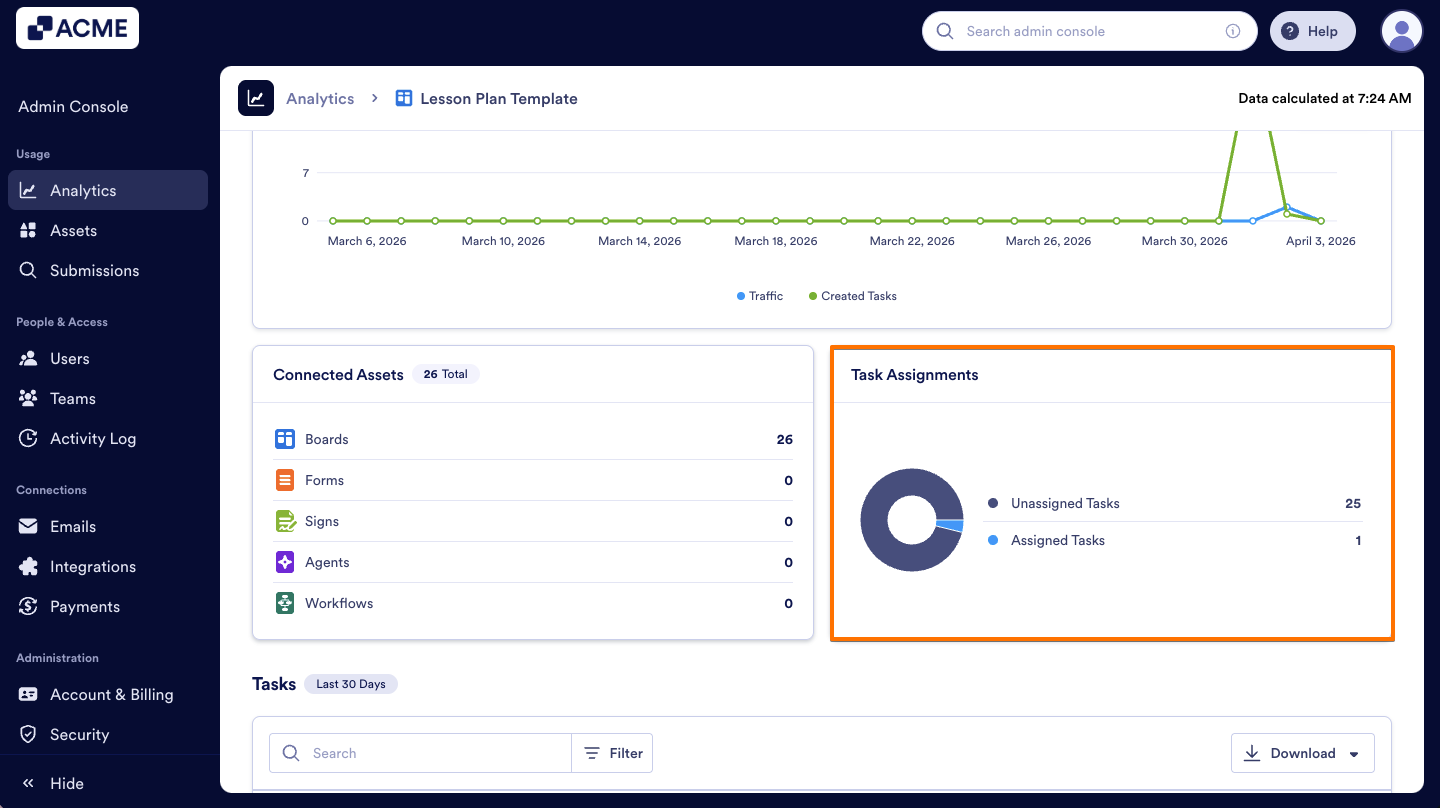
- Unassigned Tasks: Tasks that have not been assigned to any user.
- Assigned Tasks: Tasks that have been assigned to one or more users.
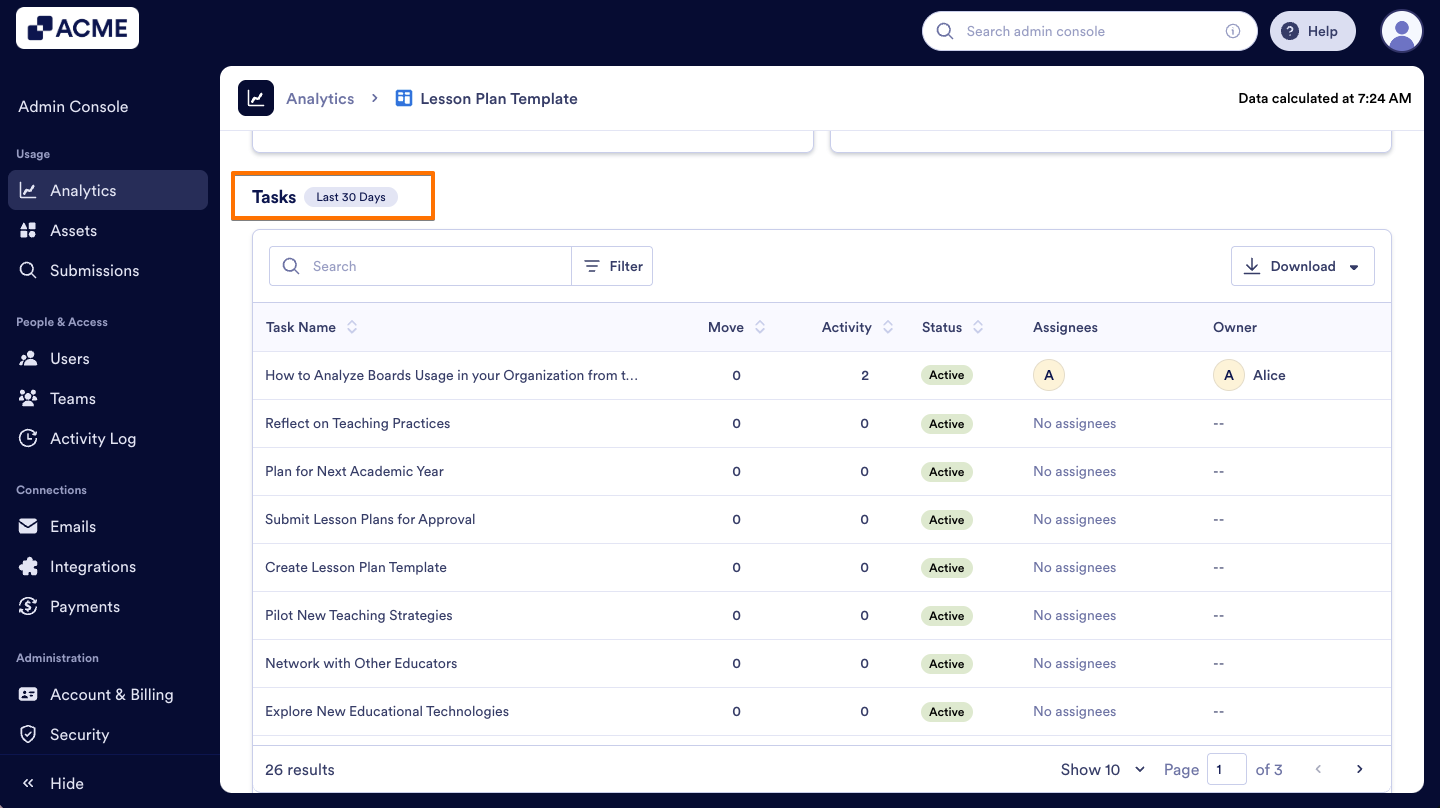
Tasks
At the bottom of the Single Board Analytics page, you will find the Tasks section. This section provides detailed insights into each task on the board, including the Task Name, the number of Activities and Moves associated with the task, its current Status, the Assignees, and the task Owner. This allows you to monitor task progress, track engagement, and understand how work is being distributed across the board. Let me show you how to reach this section:
- On the Boards Analytics page, scroll down to Performance Breakdown.

- Then, on the right side of the boards you like the view, click on the Three dots icon and select View Analytics.
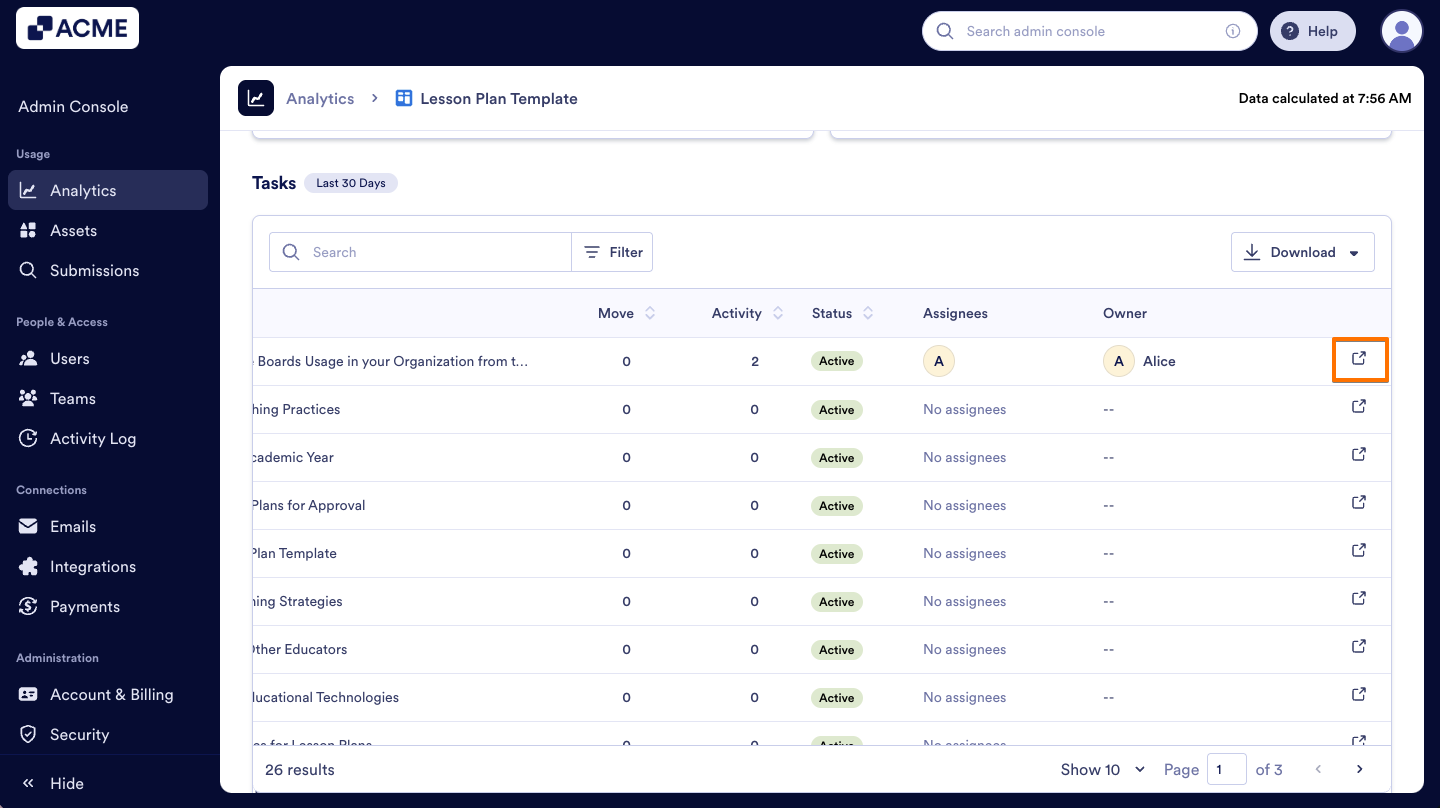
- On the single Boards Analytics page, scroll down to Tasks.
- Finally, if you want to view a single task, click on the External Link icon on the right side of the task.

Send Comment: