The Admin Console provides access to detailed data and analytics on your Forms. As an admin, you can track both Performance and Submissions through dedicated tabs. Each section gives you specific metrics and visualizations to help monitor form usage and overall engagement across your organization.


Form Analytics
Note
Data in the Analytics tab updates every 5 minutes.
Let’s walk through how to reach the Form Analytics:
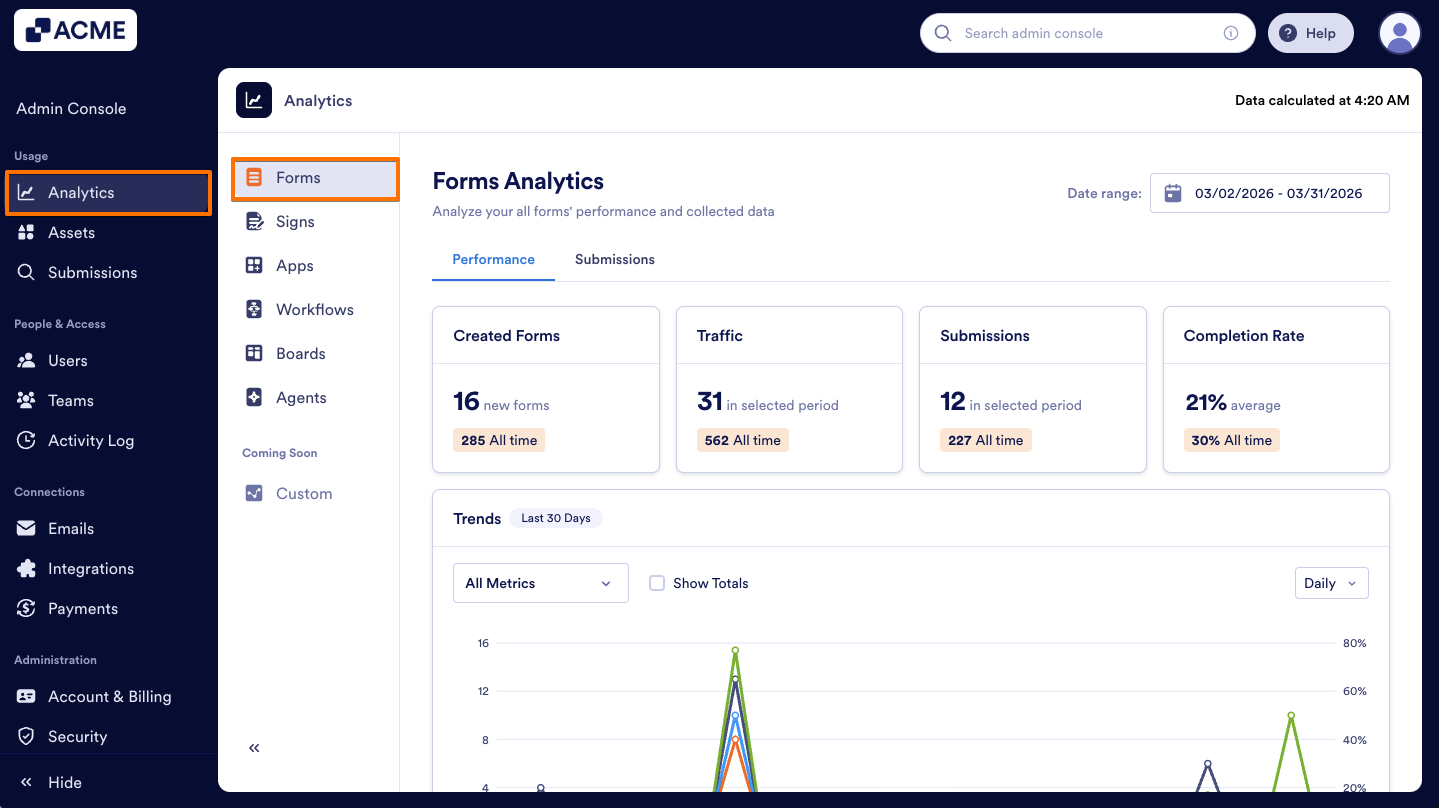
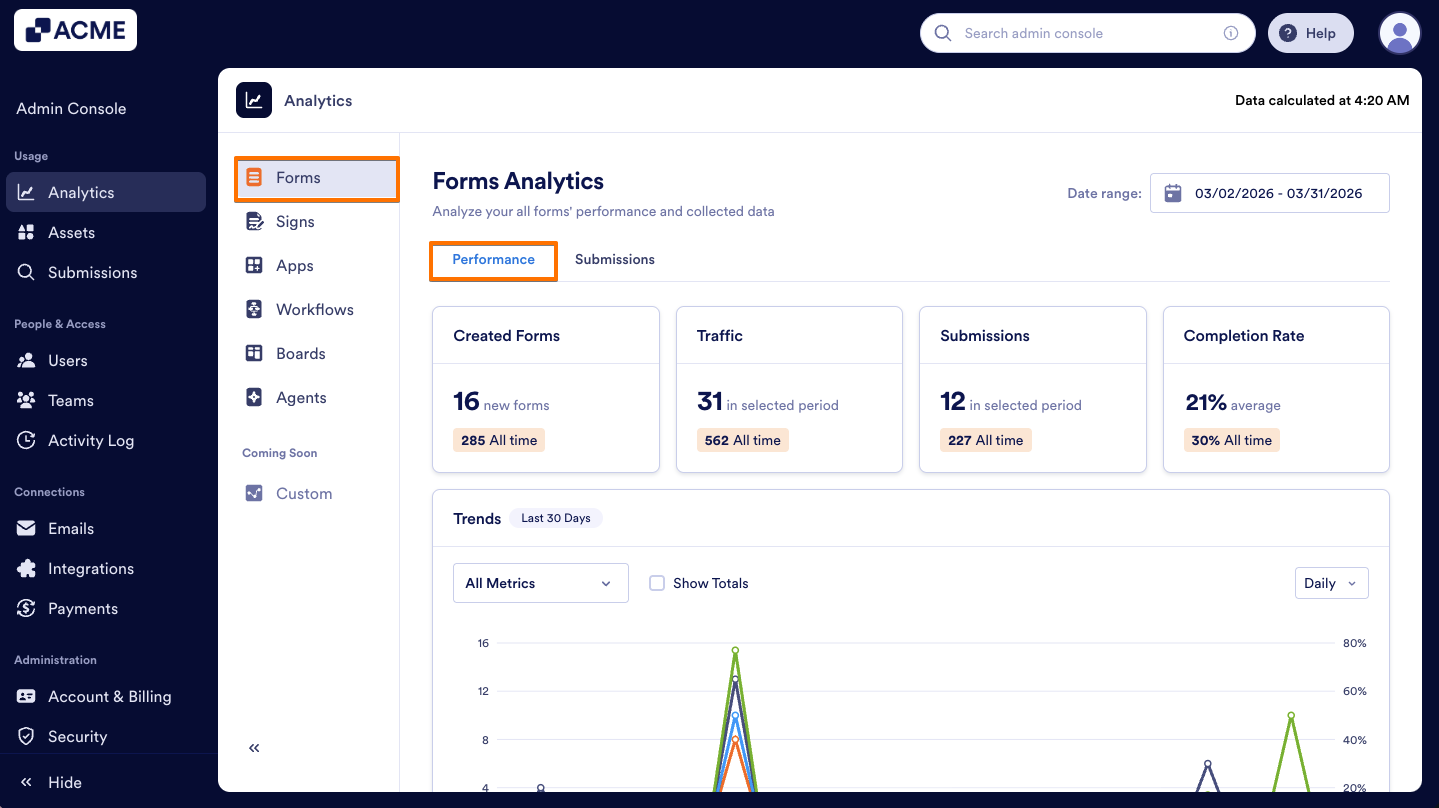
- In the Admin Console, click on Analytics on the left-hand side of the page.
- Next, click on Forms to open Form Analysis data.
Performance Tab
The Performance Tab focuses on overall form activity and completion trends across your organization. Let me show you how to reach to the Performance tab:
- In the Form Analytics page, click on the Performance tab.
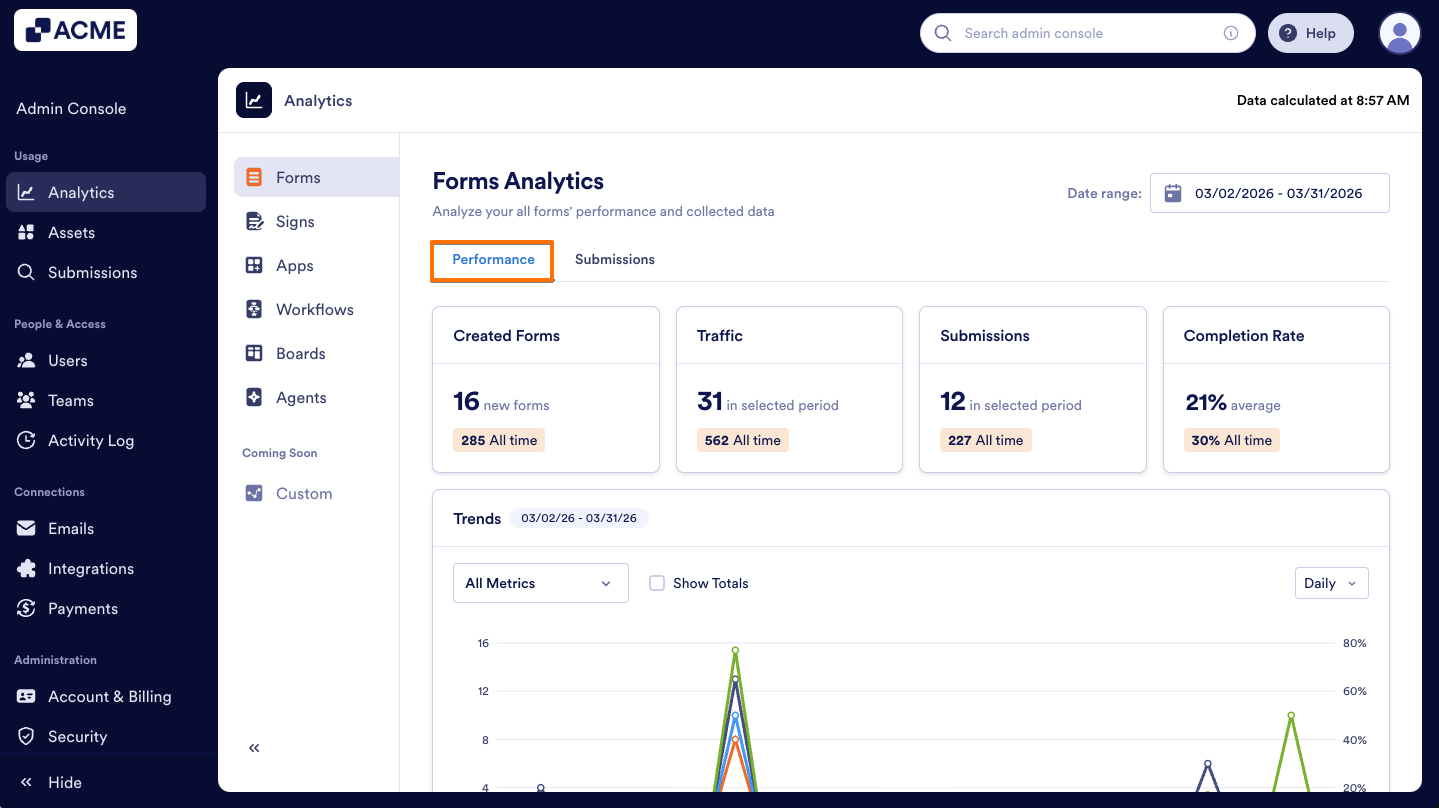
- Then, you will see the metrics shown above:
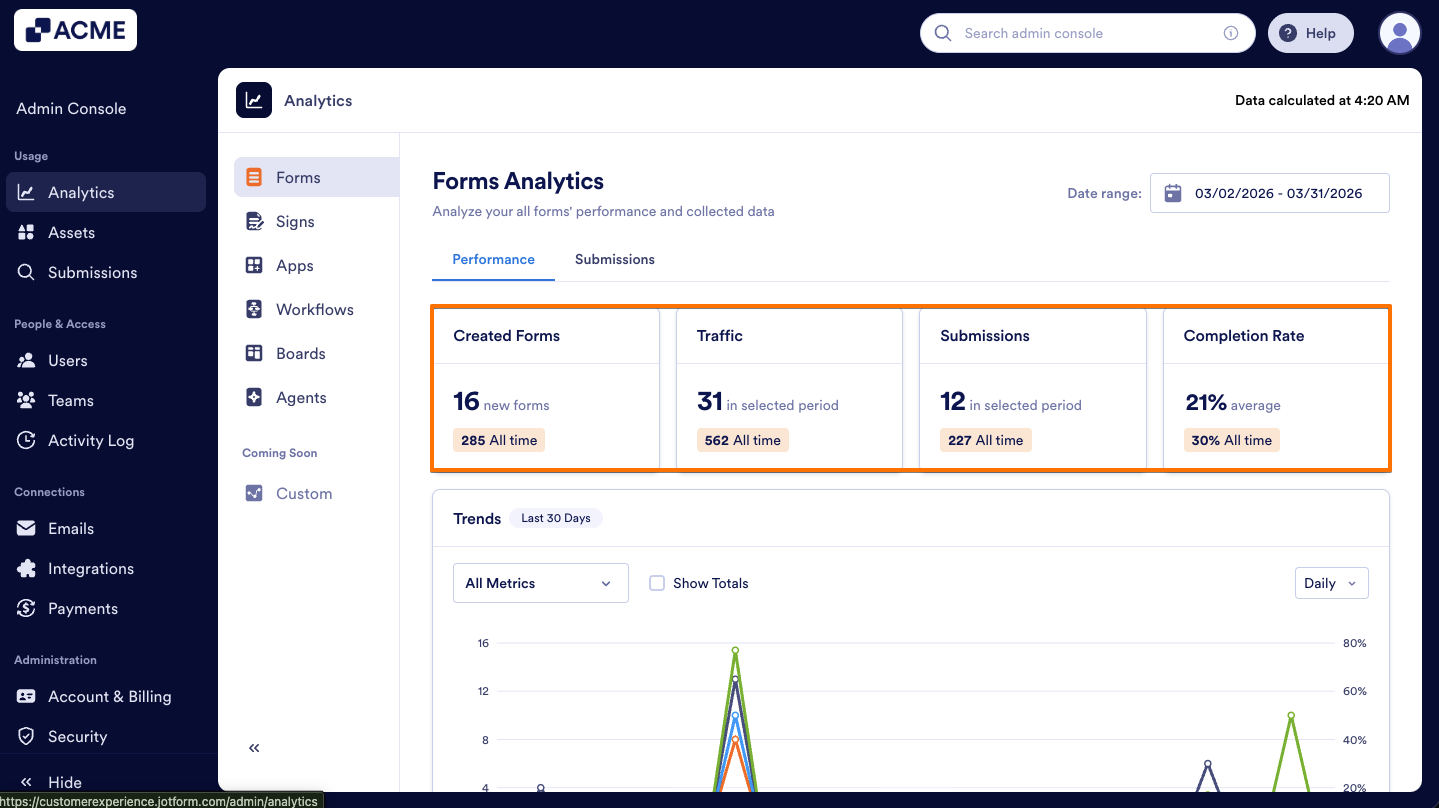
Performance Tab Metrics:
- Created Forms: The total number of forms created across the organization.
- Traffic: The number of form views received in the organization.
- Submissions: The total number of submissions received in the organization.
- Completion Rate: The percentage of completed forms in the organization.
Trends Chart
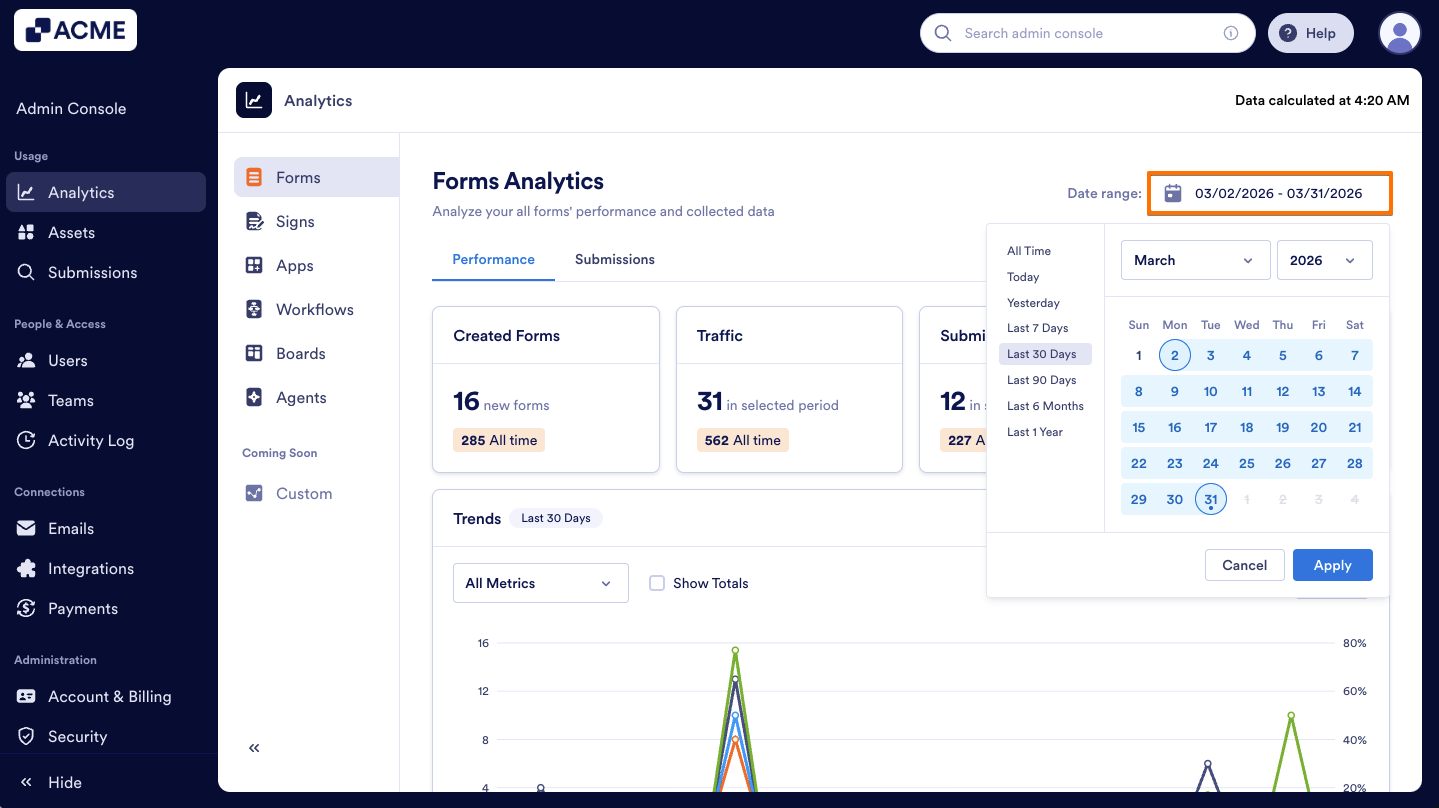
Under Performance metrics, a Trends Chart is available. This line chart visualizes the metrics above and helps you track your organization’s form performance across a selected date range. You can also decide which metrics to include or exclude and adjust the chart view by daily, weekly, monthly and yearly intervals. Let me show you how:
- In the Performance tab, first select the desired date range from the Date Range selector.
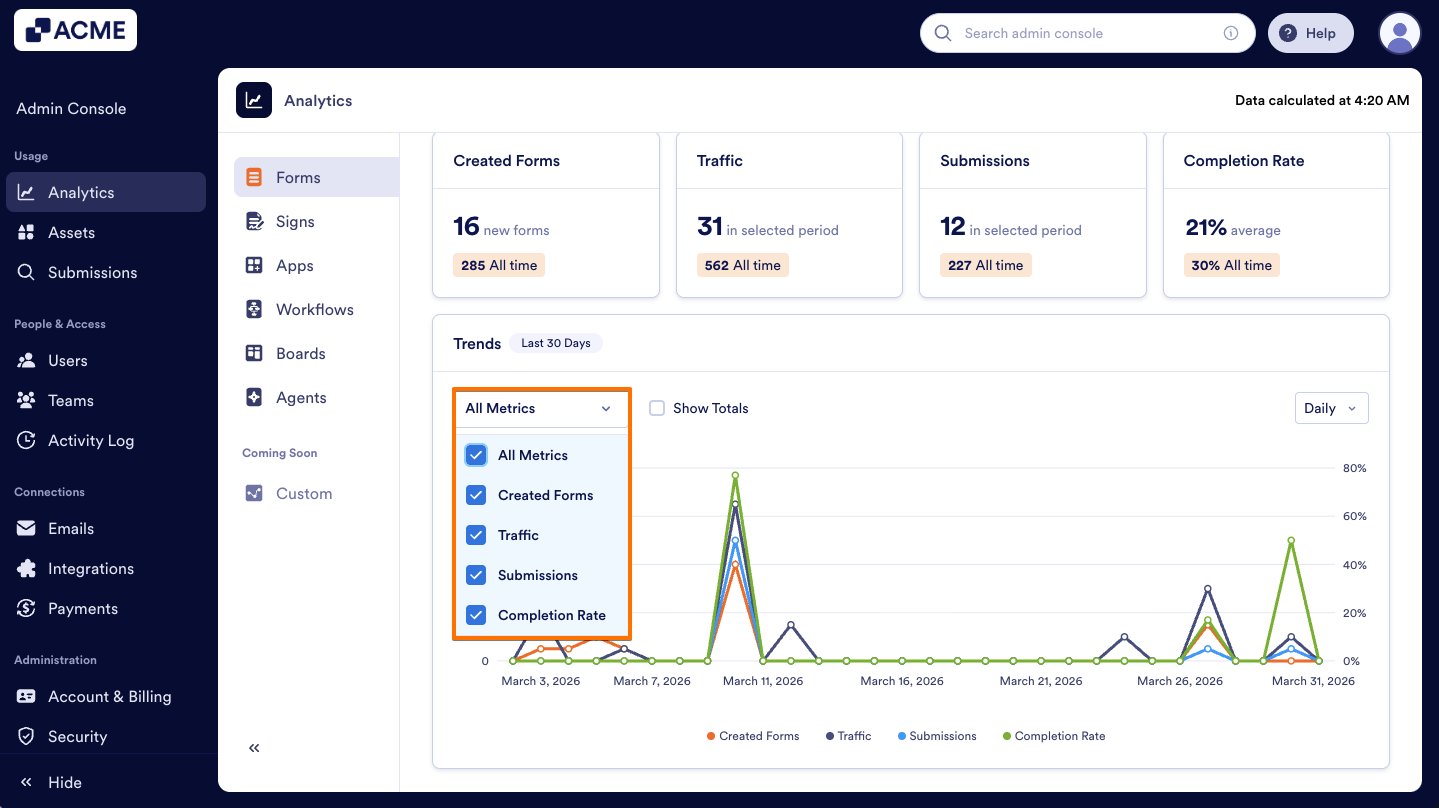
- Next, from the Dropdown menu, choose the metrics to include (e.g., created forms, traffic, submissions, completion rate).
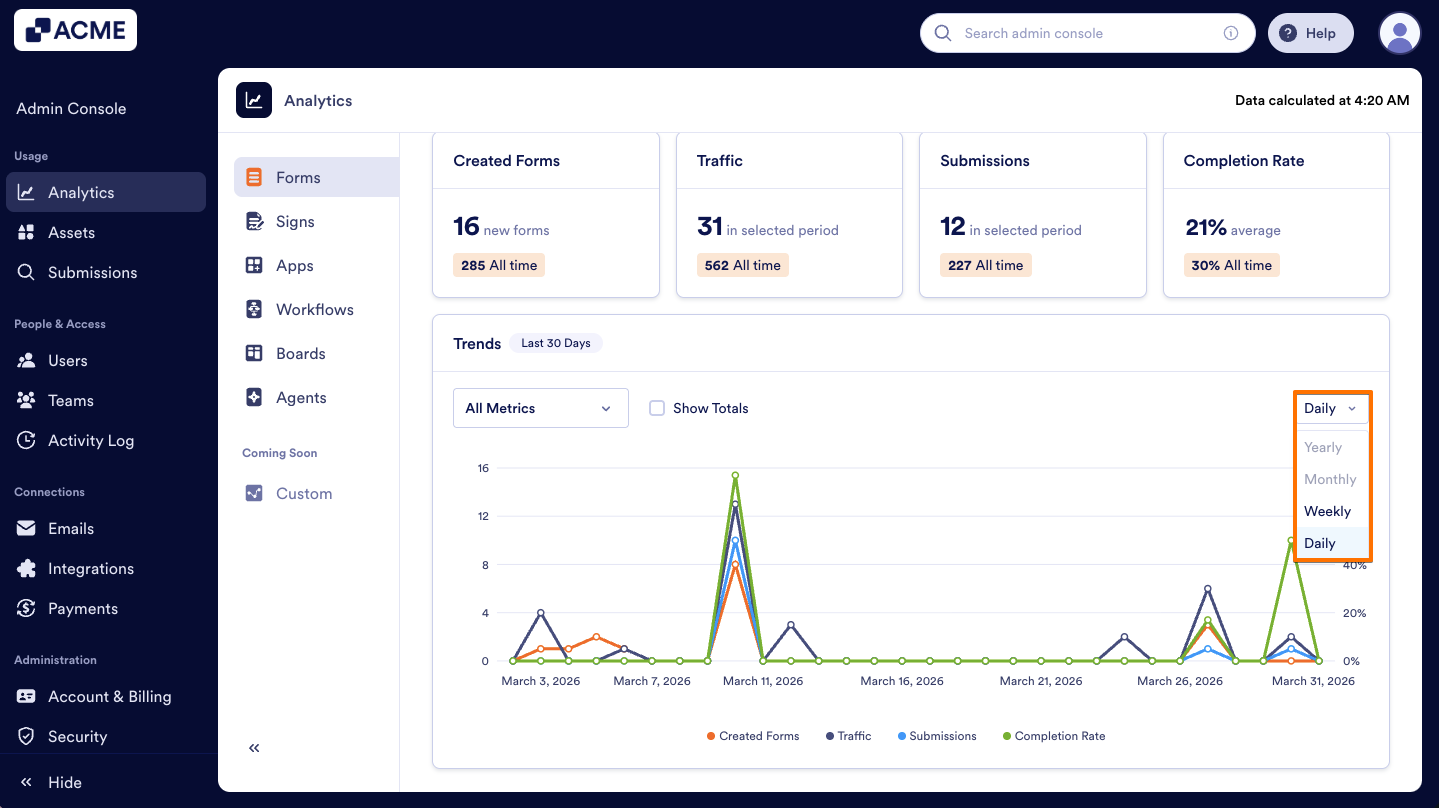
- Finally, set the view to Daily, Weekly, Monthly, or Yearly.
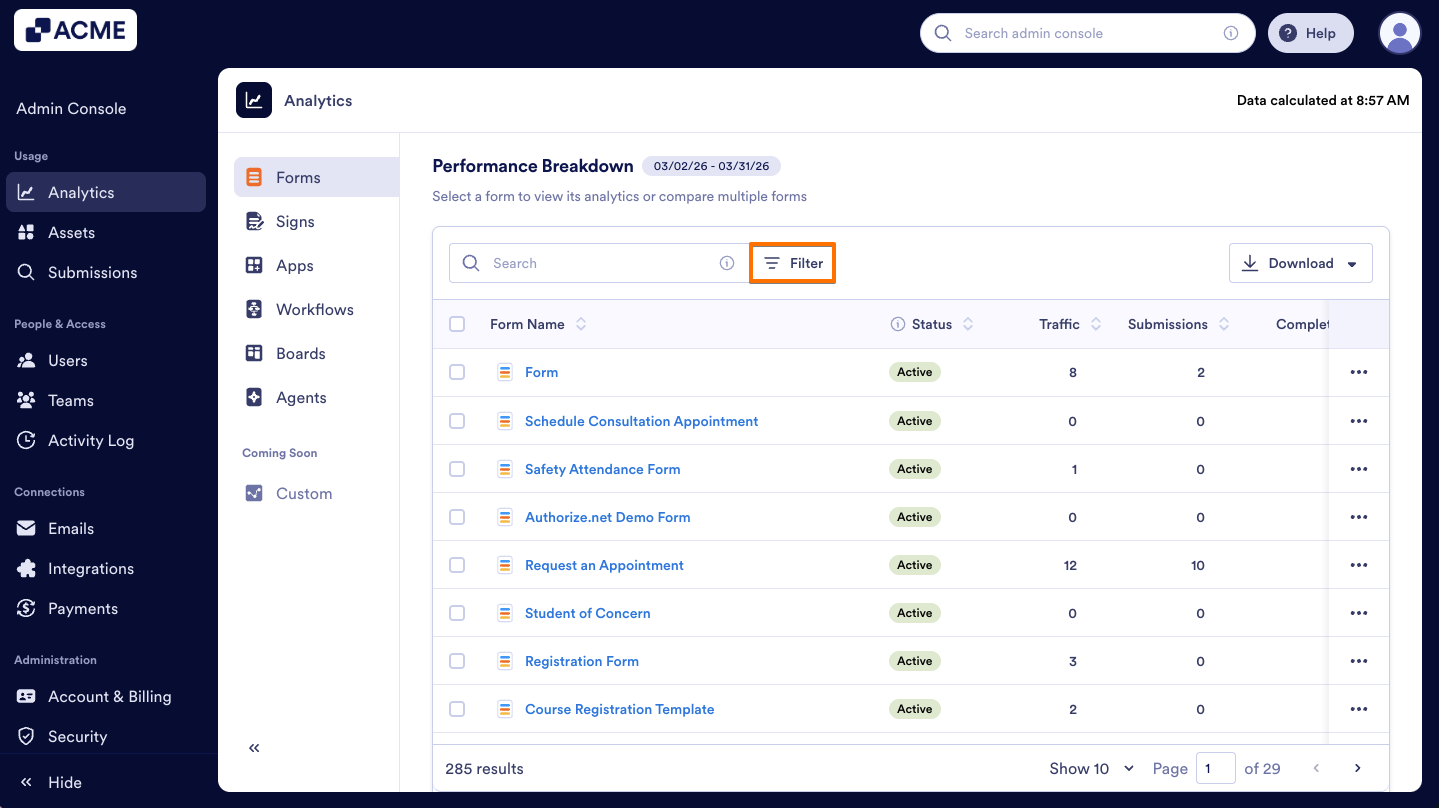
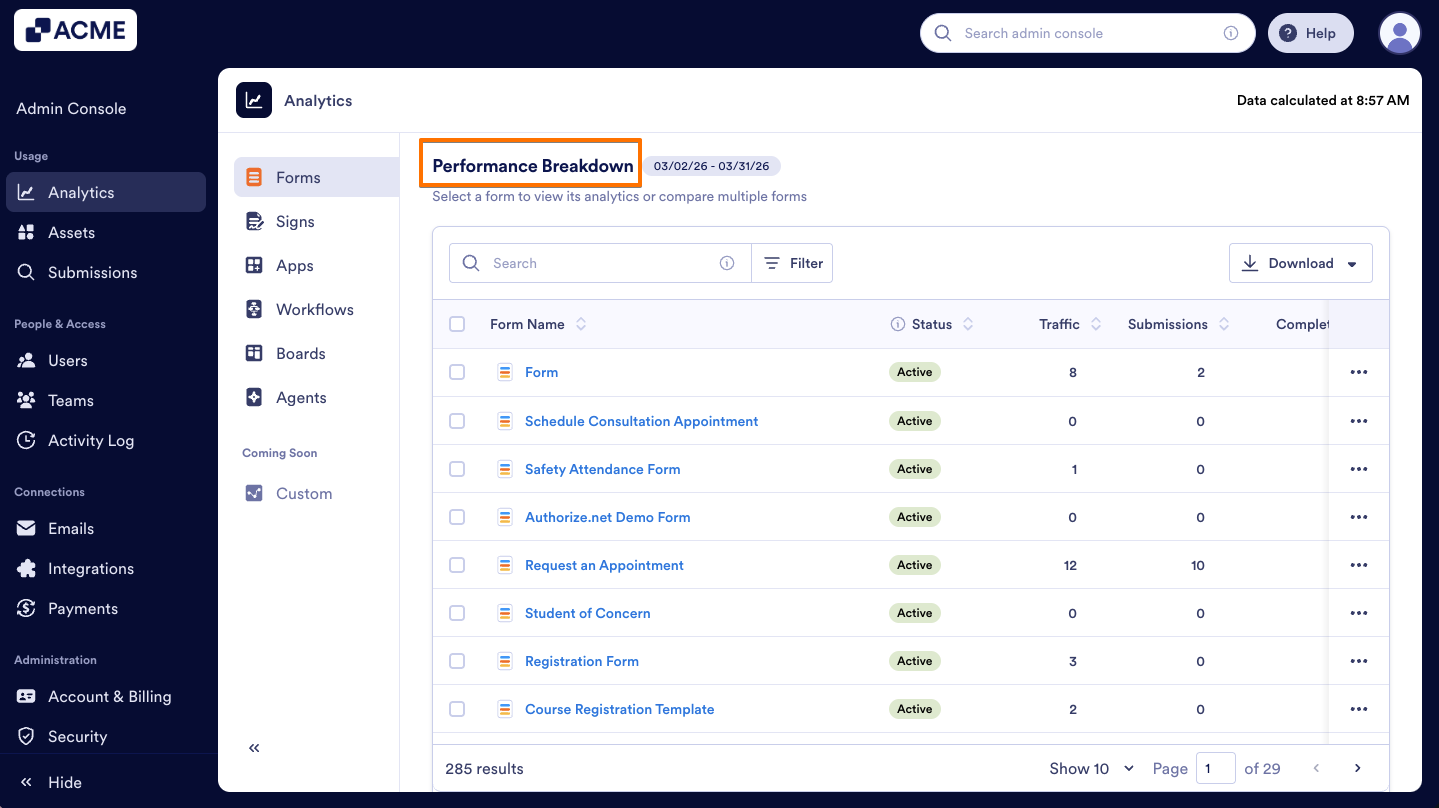
Performance Breakdown
In this section, you will see the distribution of all forms created across the organization based on the selected date range. The list shows each Form’s Name, traffic, Status, number of Submissions, Completion Rate for the selected period, Share Type, Form Owner, and eSignature.
Let’s walk through the steps together:
- In the Admin Console, select Forms from Analytics section.
- Next, click on the Performance tab.
- Finally, scroll down to the Performance Breakdown list to see all forms.

Note
By clicking the three-dot action menu next to any form, you can either access analytics for that form or preview the form directly.
Filter Form Data
In the Performance Breakdown section, you can Filter your Forms to view their details. Let me show you how:
- In Form Analytics page, under the Performance tab, scroll to the Performance Breakdown section.

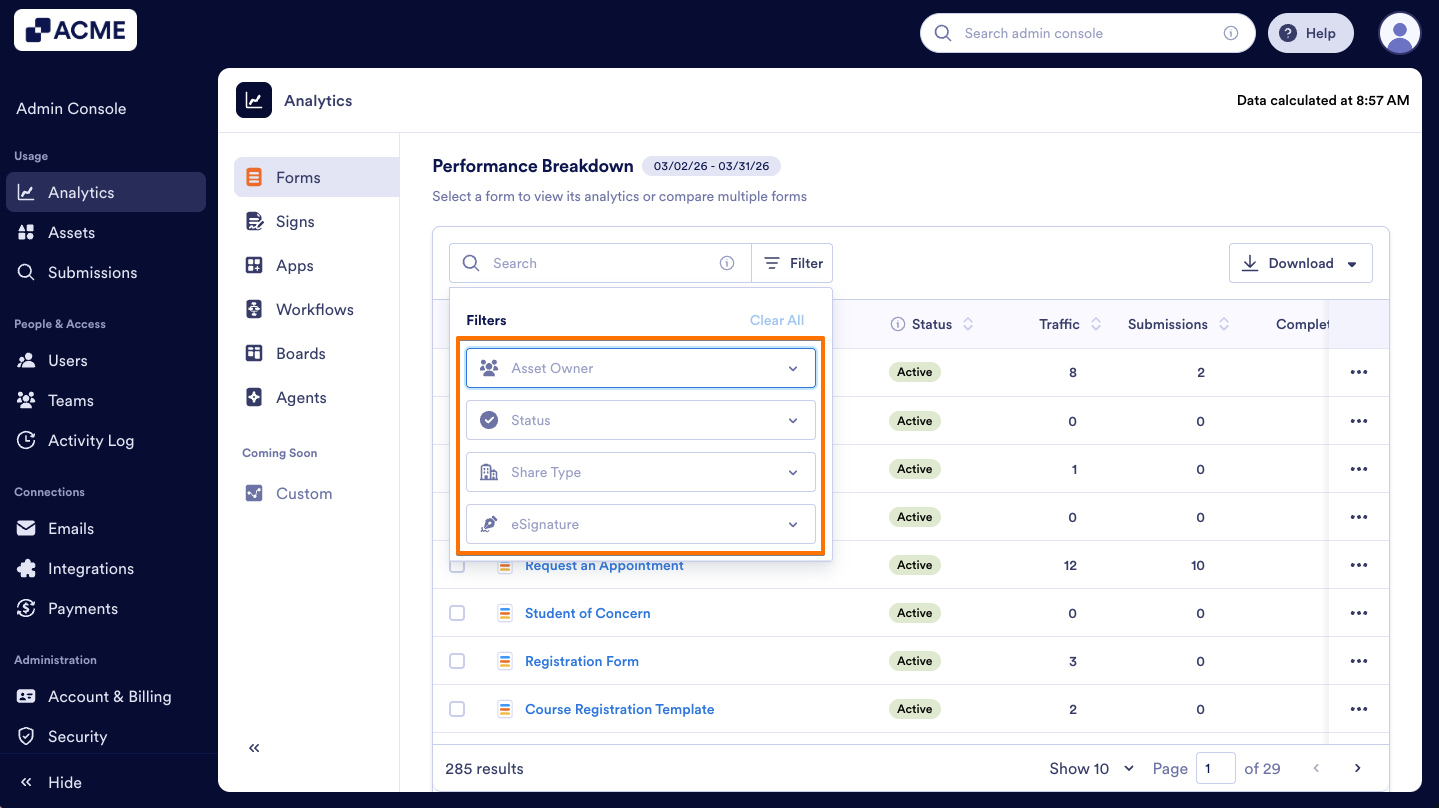
- On the right side of the Search bar, click on Filter.
- Then, select Asset Owner, Status, Share Type and eSignature filters according to your needs.
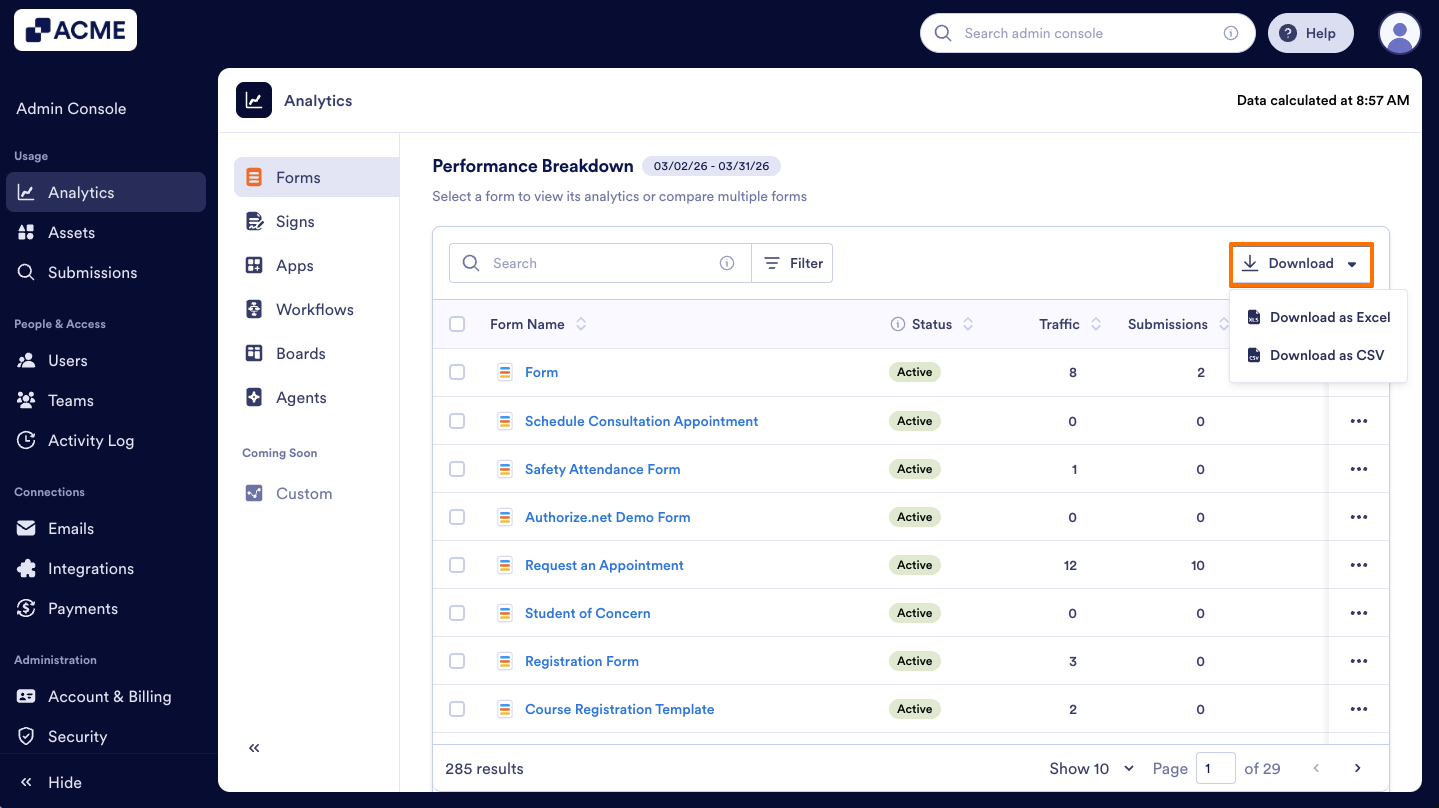
Download Form Data
In this section, you can also download Form data, that includes the form ID, the number of submissions, times the form has been submitted and completed, among other things:
- In Form Analytics, under Performance tab, scroll to Performance Breakdown.
- Click on Download and select how you’d like the file to be downloaded.
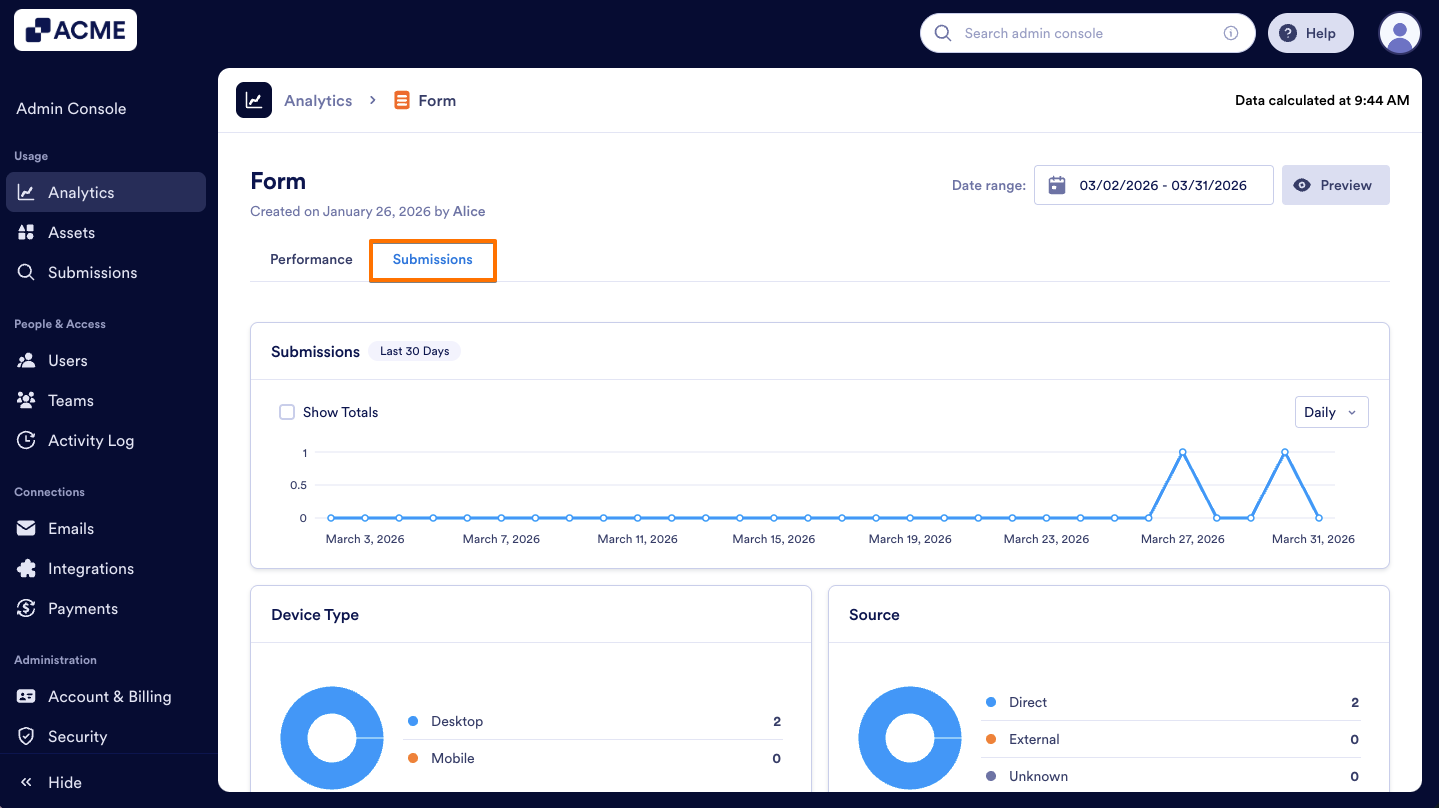
Submissions Tab
The Submissions Tab provides insights into how and where your organization’s forms are being filled out. Let me show you how to reach the Submissions tab:
- In the Form Analytics page, click on the Submissions tab to open it.
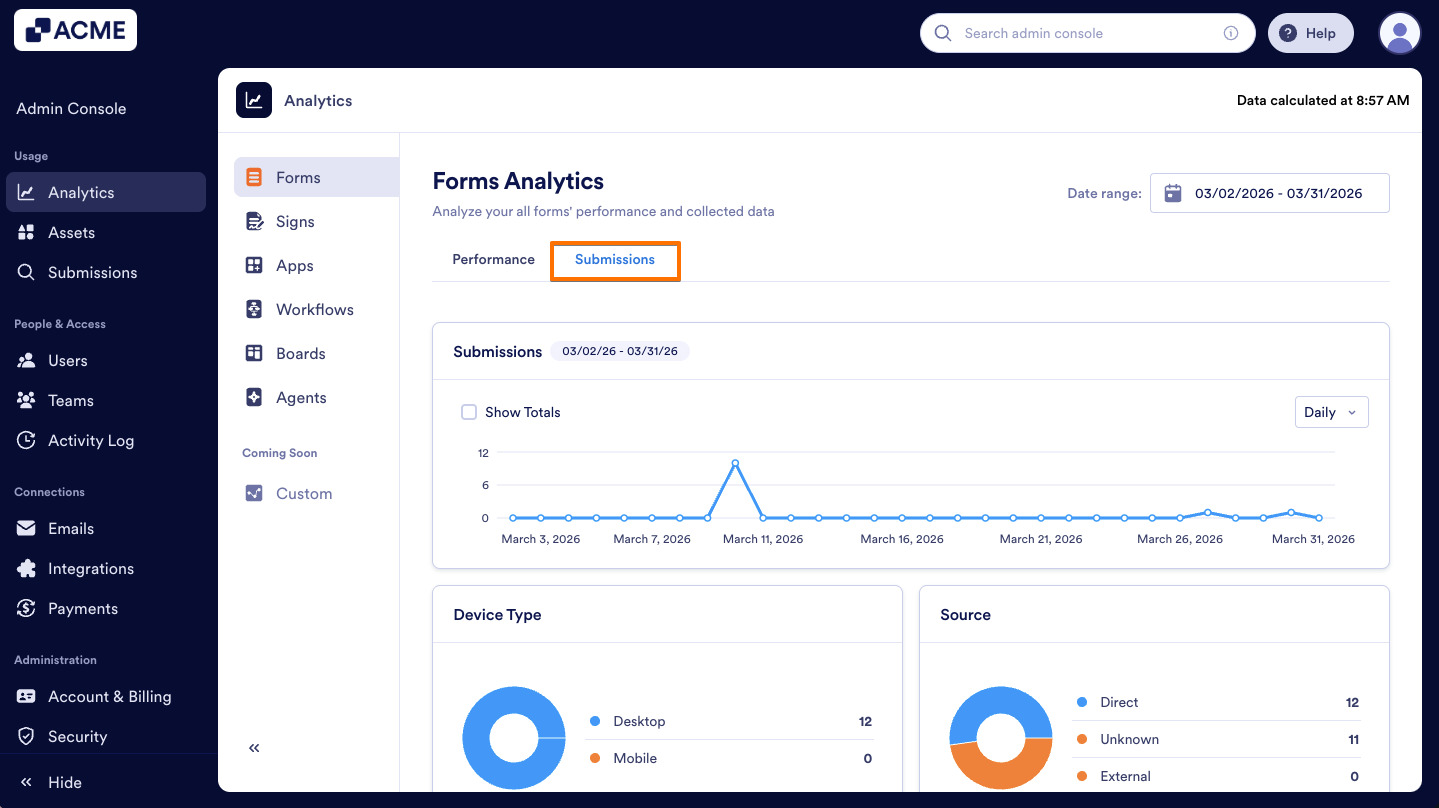
- Then, you will see the metrics listed below, providing an overview of the key data.
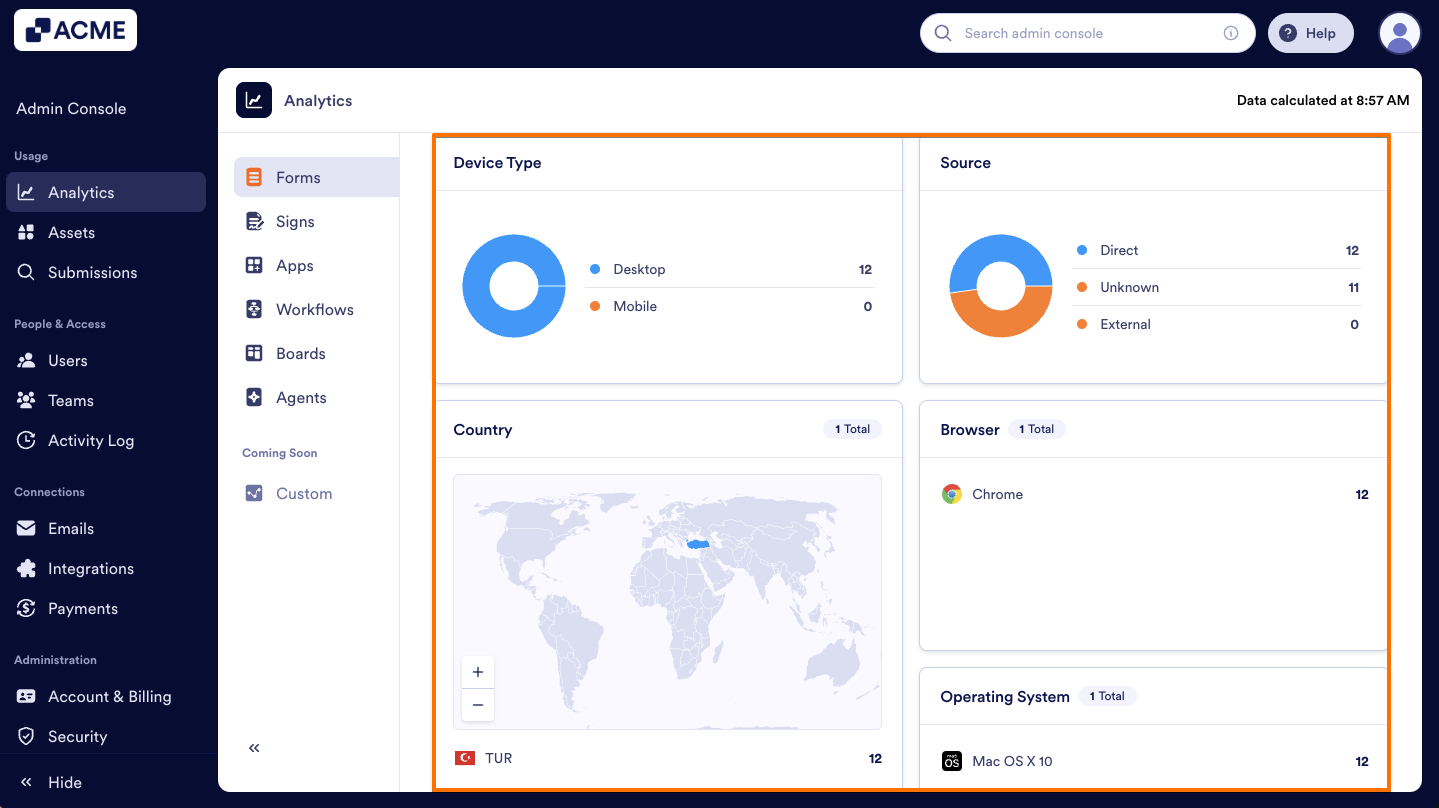
Submission Metrics:
- Device Type: Submission distribution numbers by device type (Mobile vs. Desktop) in the organization.
- Source: Submission distribution by source (Direct vs. External). Direct is via the form link; External is via the form embedded elsewhere.
- Country: Submission distribution numbers by country in the organization.
- Browser: Submission distribution numbers by browser in the organization.
- Operating System: Submission distribution numbers by operating system (e.g., Windows, macOS, iOS, Android) in the organization.
Submissions Chart
The line chart in the Submissions tab displays the number of submissions received in the selected date range.
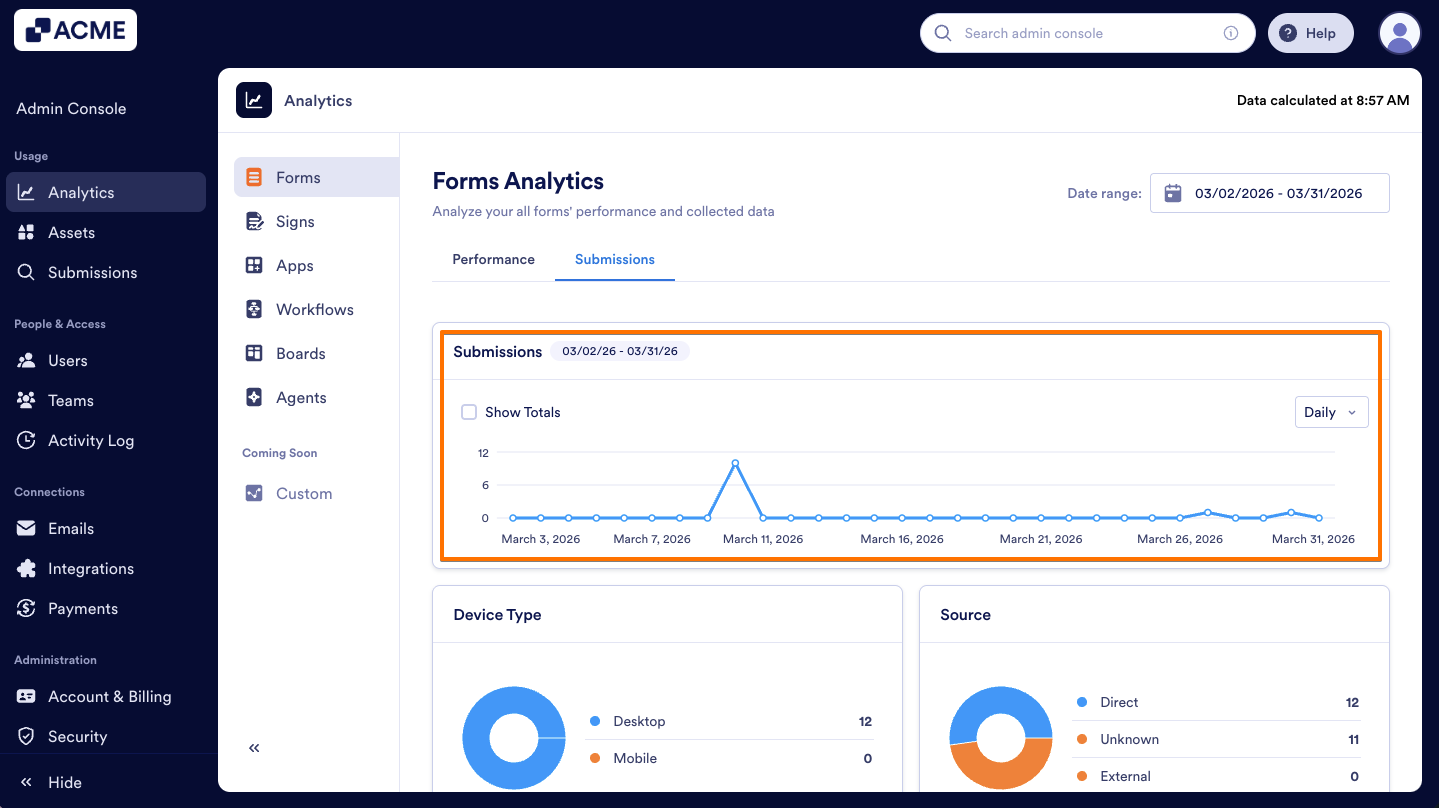
Note
When the date range is selected in the performance tab, the selection will be applied to the line chart in the Submissions tab.
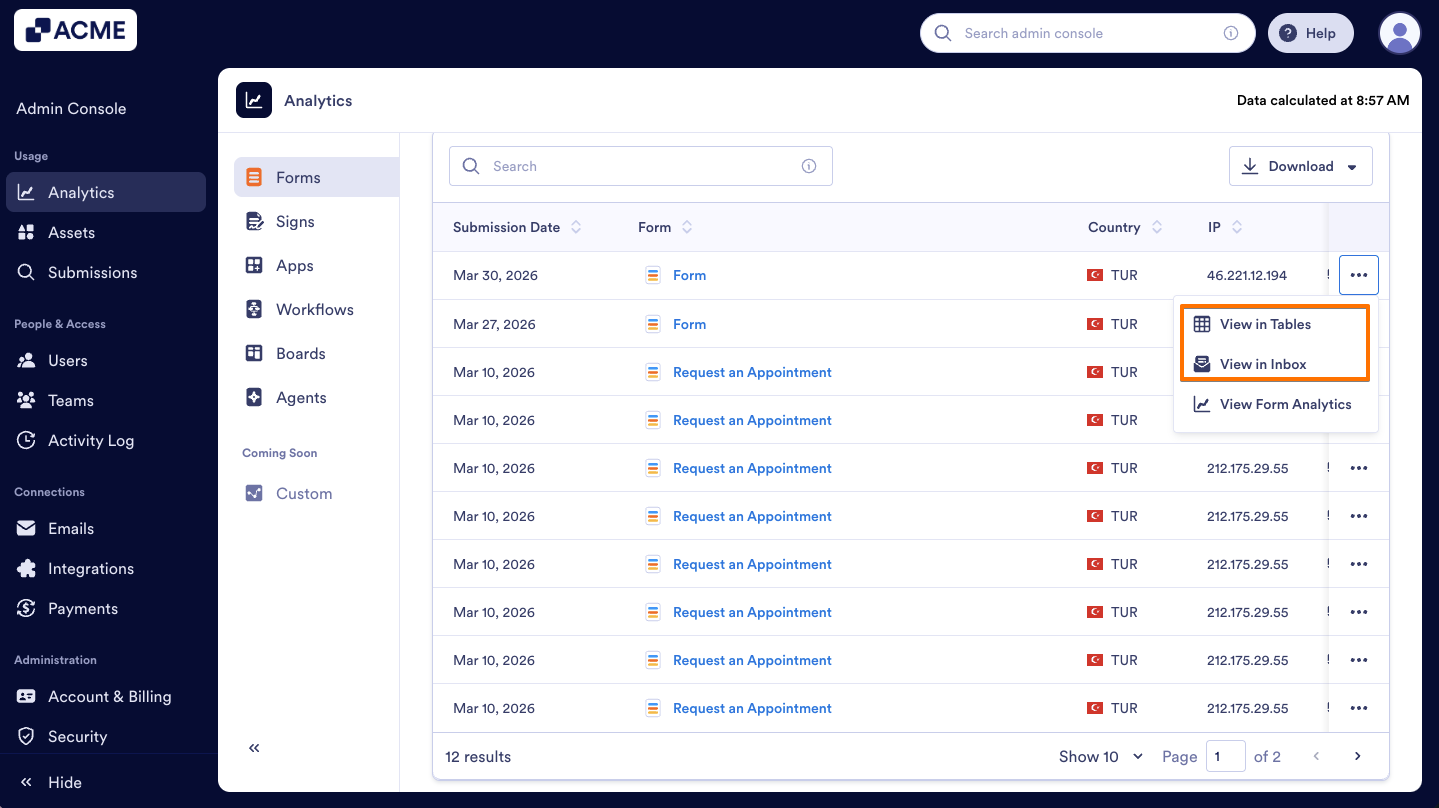
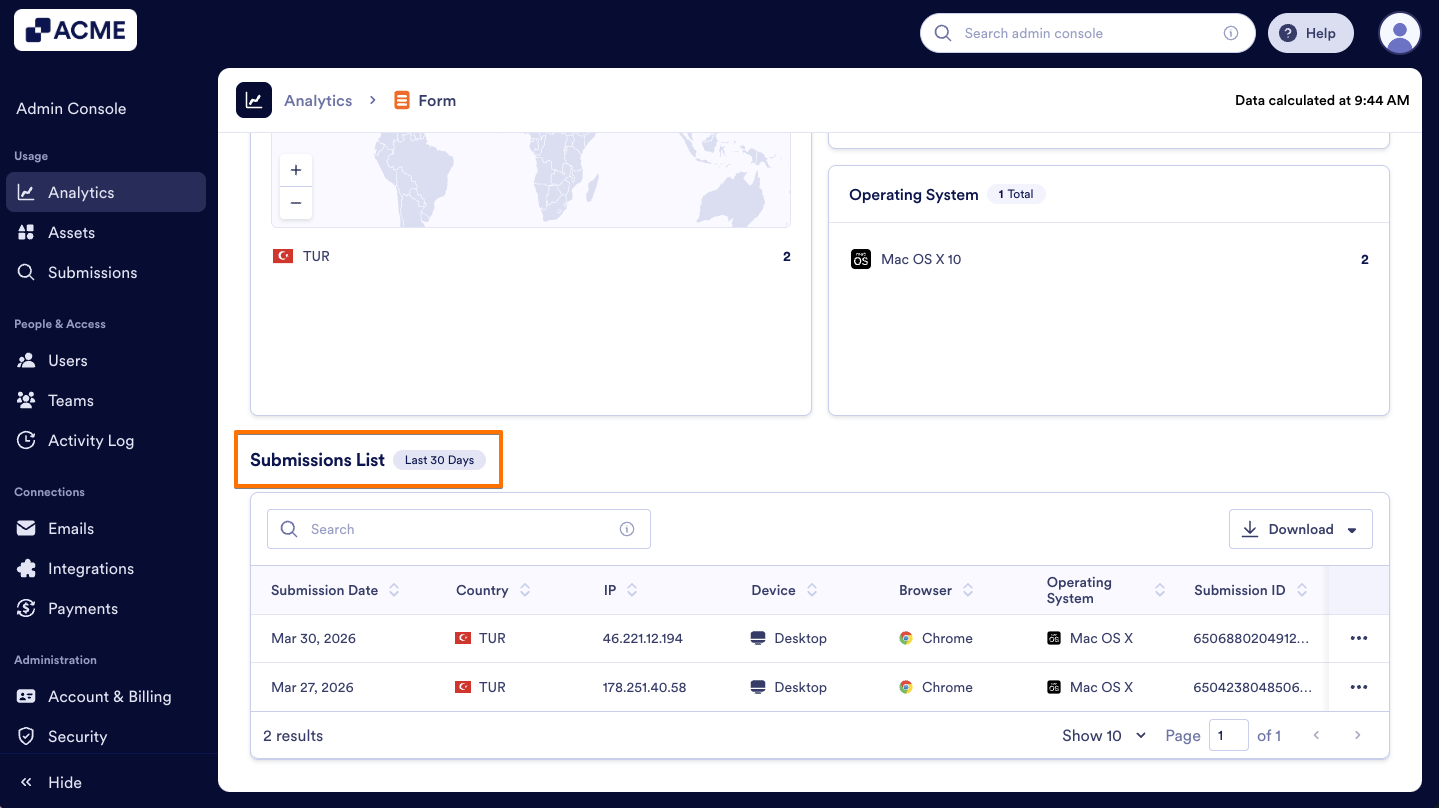
Submissions List
Under the Submissions tab, you can view detailed submission information, including submission date, country, IP address, device, browser, operating system, submission ID, and more.

You can also view the submission in the Inbox or the Submission Table. Let’s walk through this process together:
- In Form Analytics, click on Submissions.

- Next, scroll down to the Submission List.

- Click on the Three-dots menu next to the submission you’d like to view.
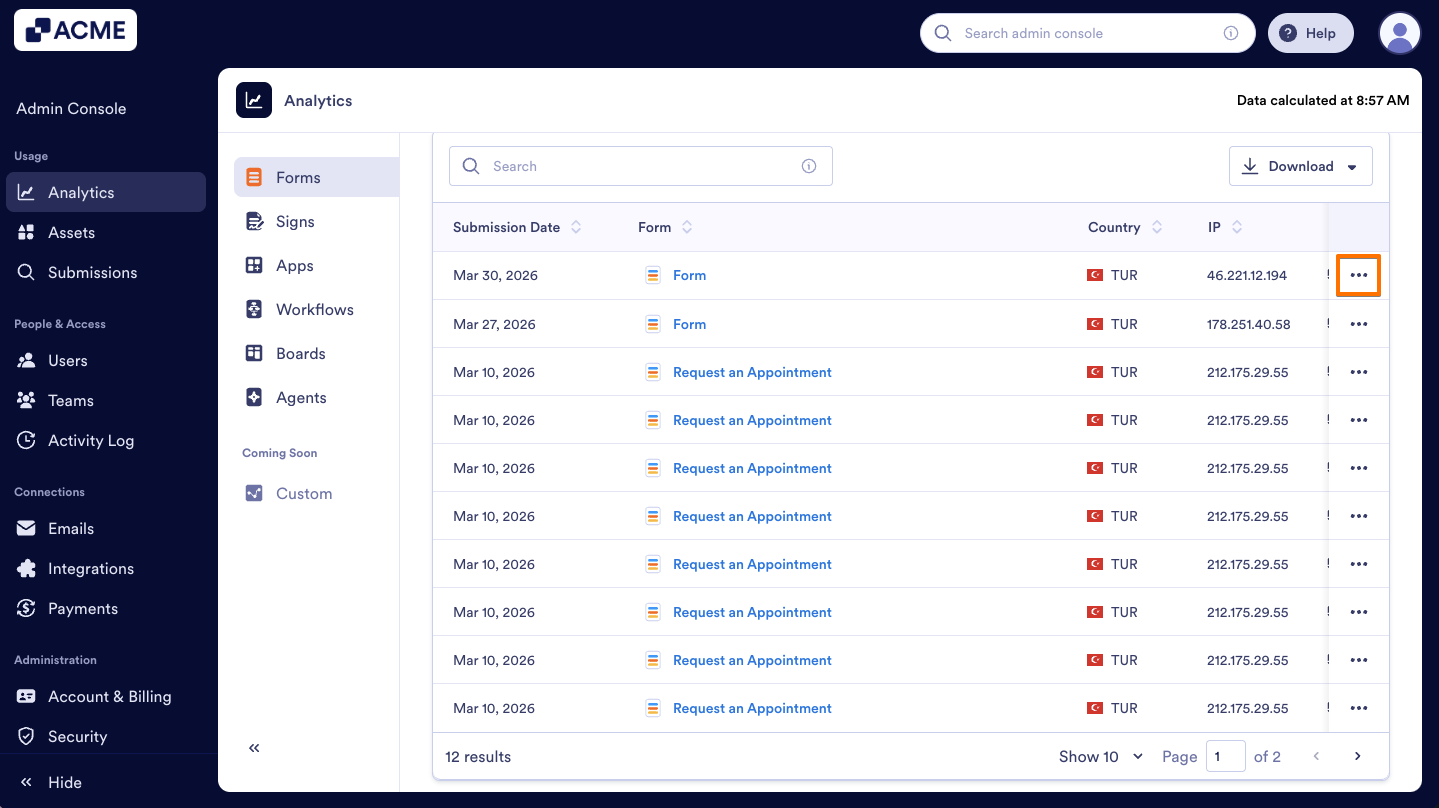
- Then, select View in Tables or View in Inbox to open the submission.
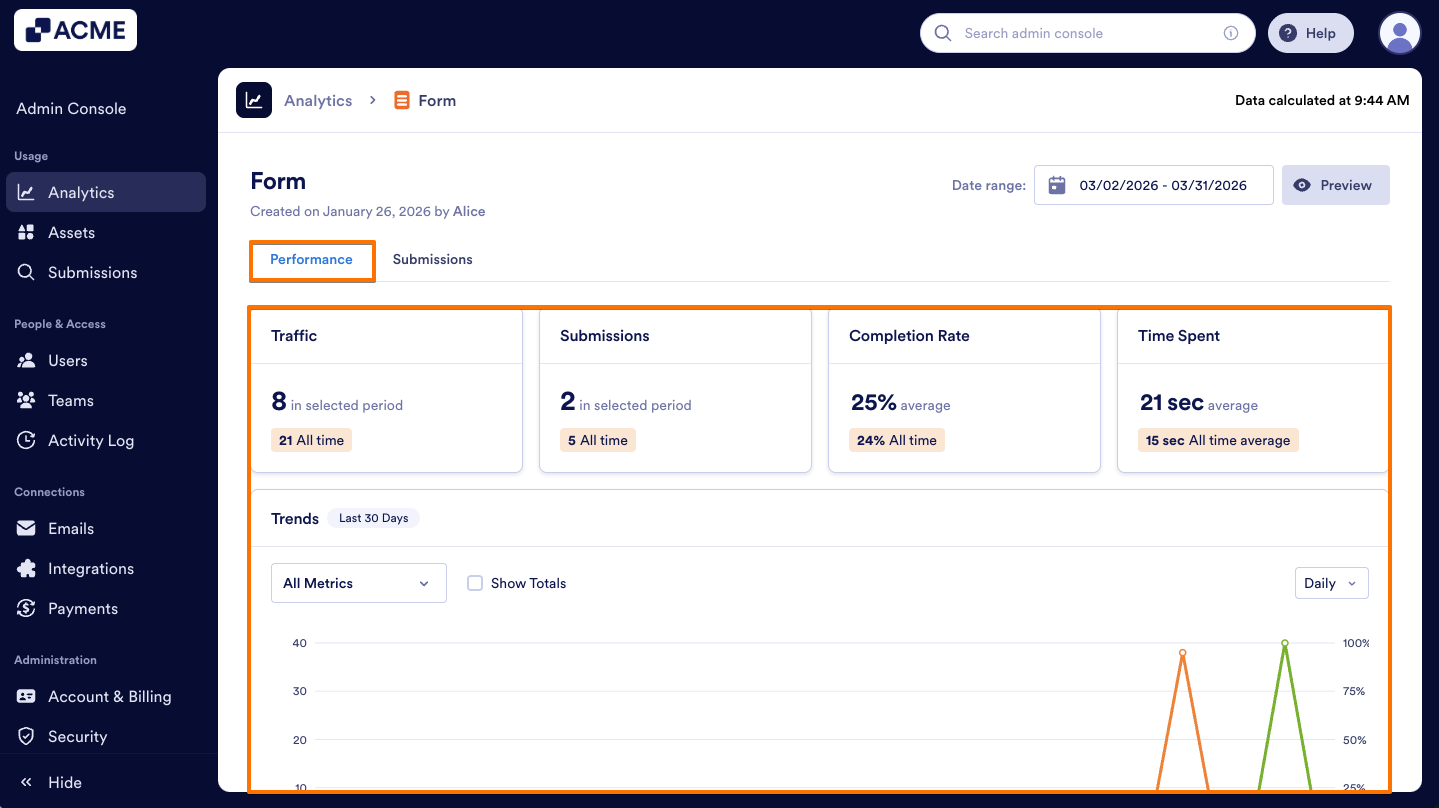
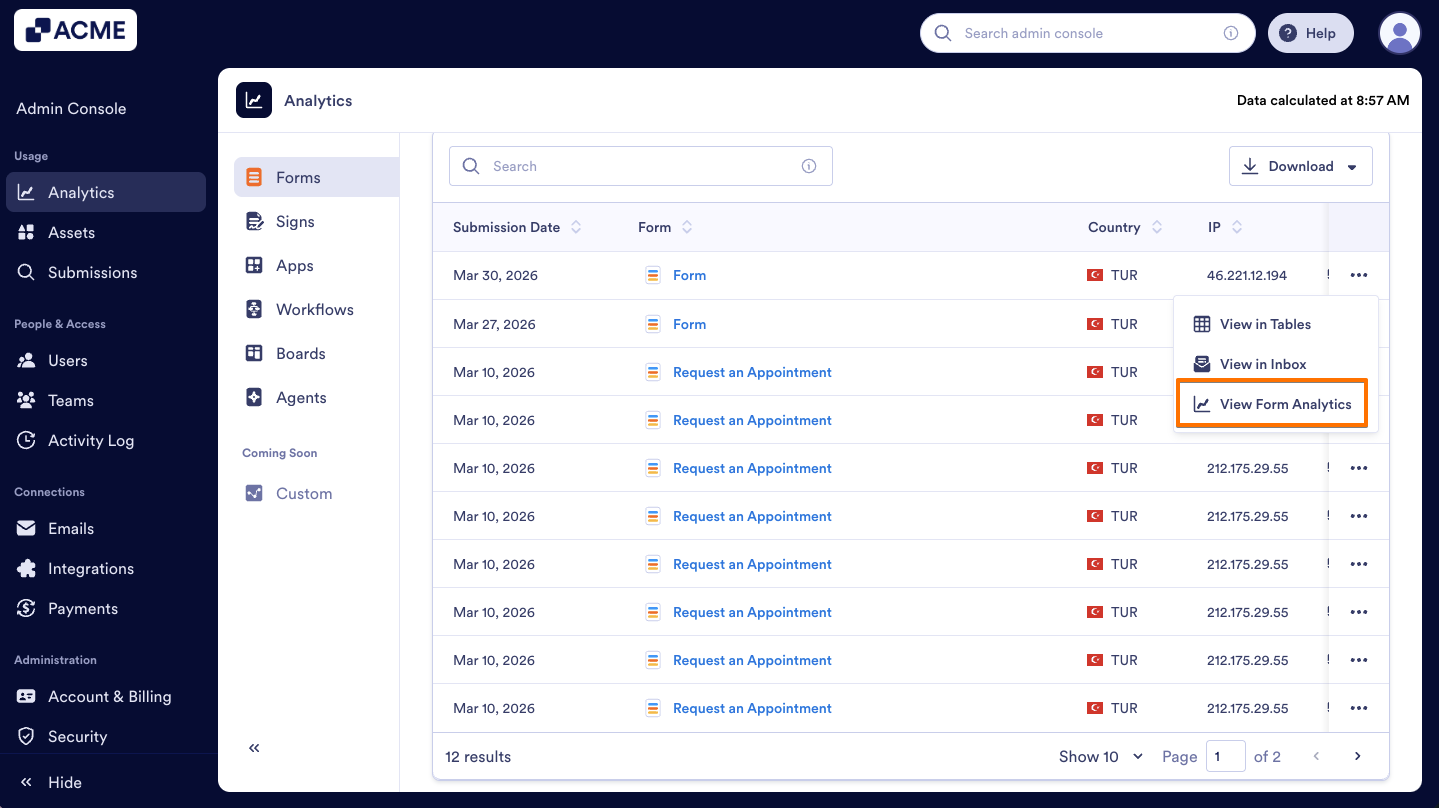
View Analytics for a Single Form
You can also view the data for a specific Form in the Analytics tab. We’ll walk through steps together:
- In the Form Analytics page, under the Performance tab, scroll to the Performance Breakdown section bottom of the page.

- Click on the Three-dots menu next to the form you’d like to view analytics for.

- Then, click View Form Analytics.

- Finally, under a single form’s Performance tab, you will see cards displaying Traffic, Submissions, Completion Rate, and Time Spent, along with a Trends chart visualizing these metrics.
View Submission For a Single Form
Under the Submission tab, you can view submission information, such as location, device type, operating system details within a selected date range.
Let’s walk through this process together:
- In Form Analytics, click on the Submissions tab.

- Next, scroll down to the Submission List in all Forms.
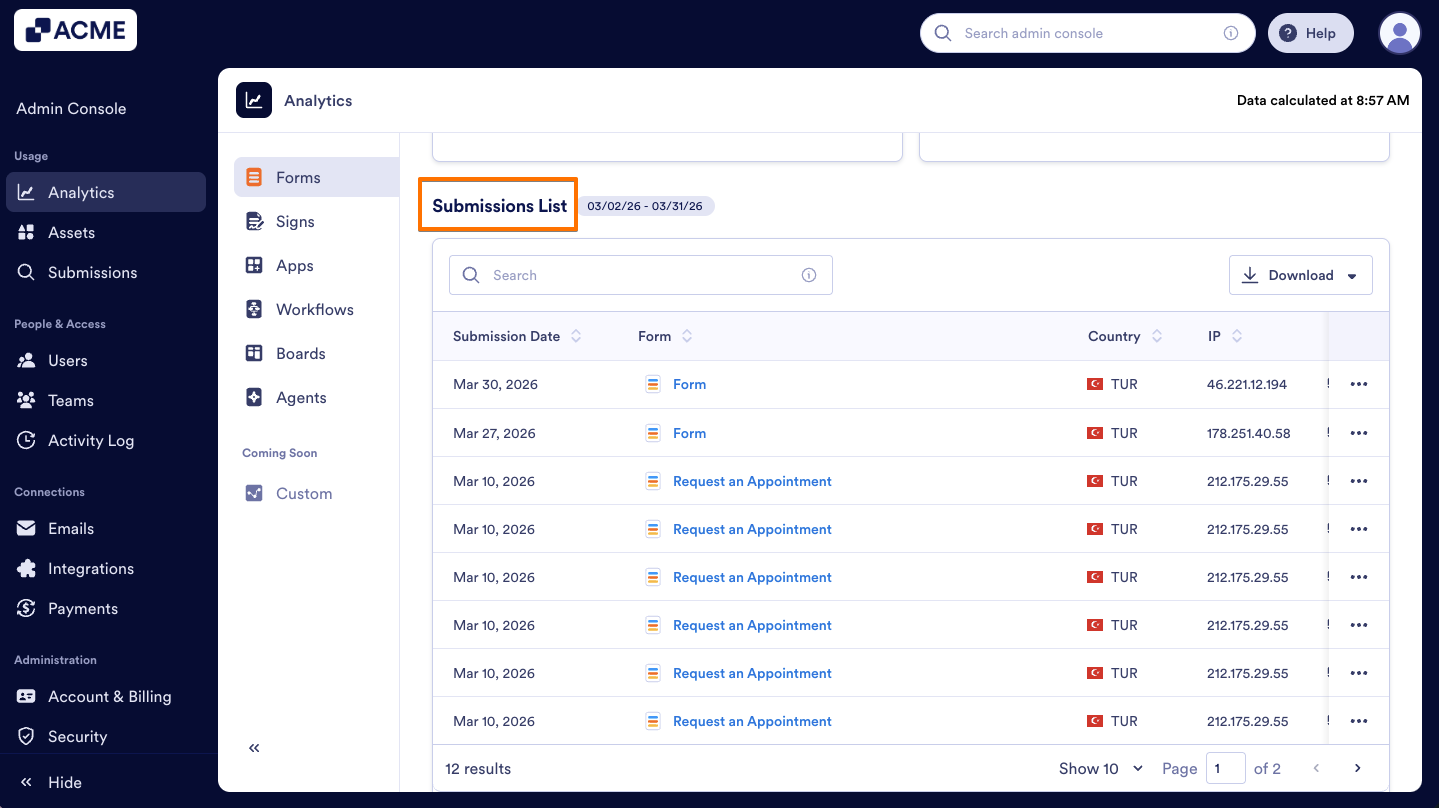
- Click on the Three-dot menu next to the submission you’d like to view.

- Then, select View Form Analytics and open the form's analytics page.
- Go to Submissions tab to access the submission details page for the selected form.
- Finally, scroll down to the Submission List of the specific form.

Send Comment: