The Admin Console provides access to detailed data and analytics for your Sign Documents. As an admin, you can track both documents and signers through dedicated tabs, allowing you to view key information and monitor activity.
Note
Data in the Analytics tab updates every 5 minutes.


Sign Document Analytics
Let’s walk through how to reach the Sign Document analytics page:
- In the Admin Console, on the left-hand side of the page, click on Analytics.
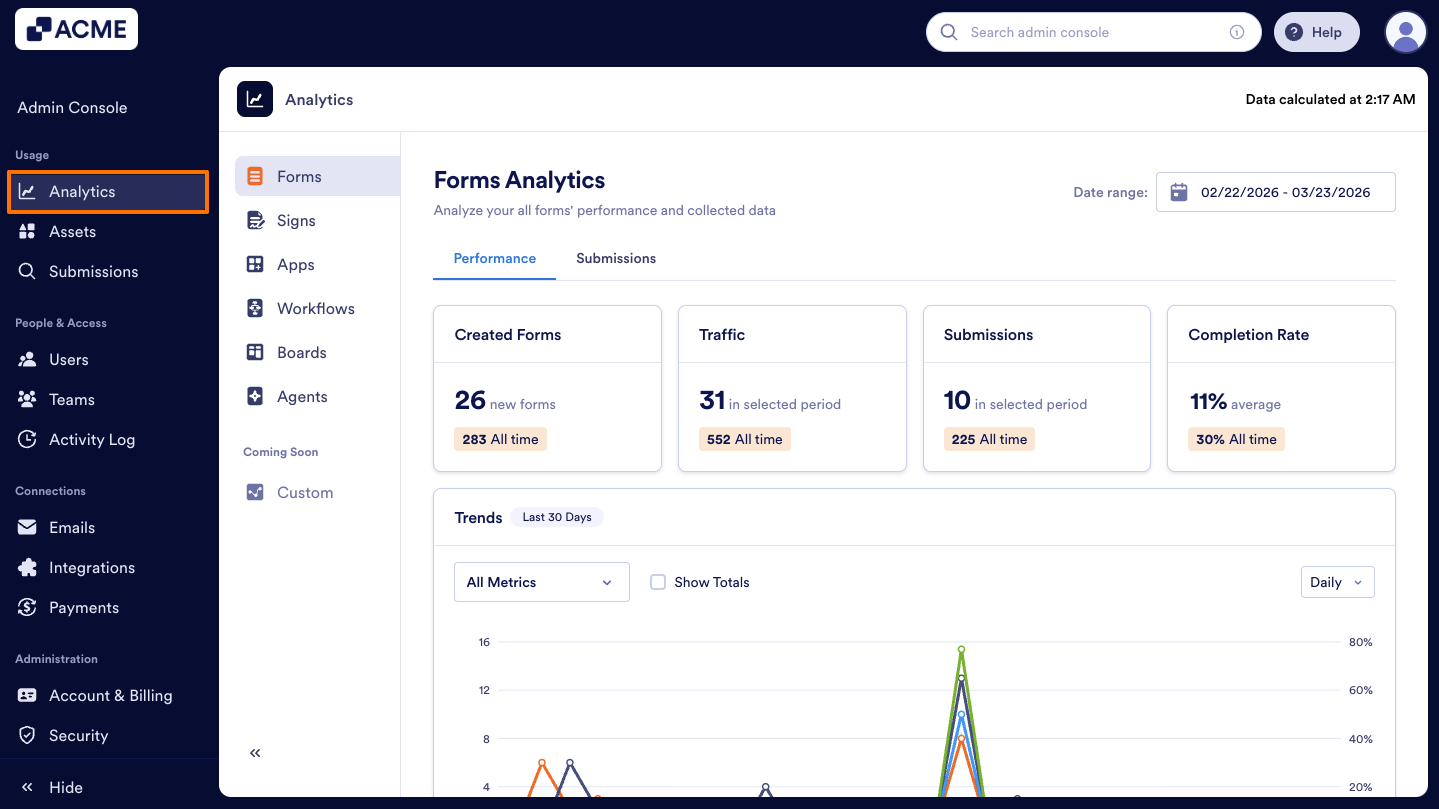
- Next, click on Signs to open Sign Documents Analysis data.

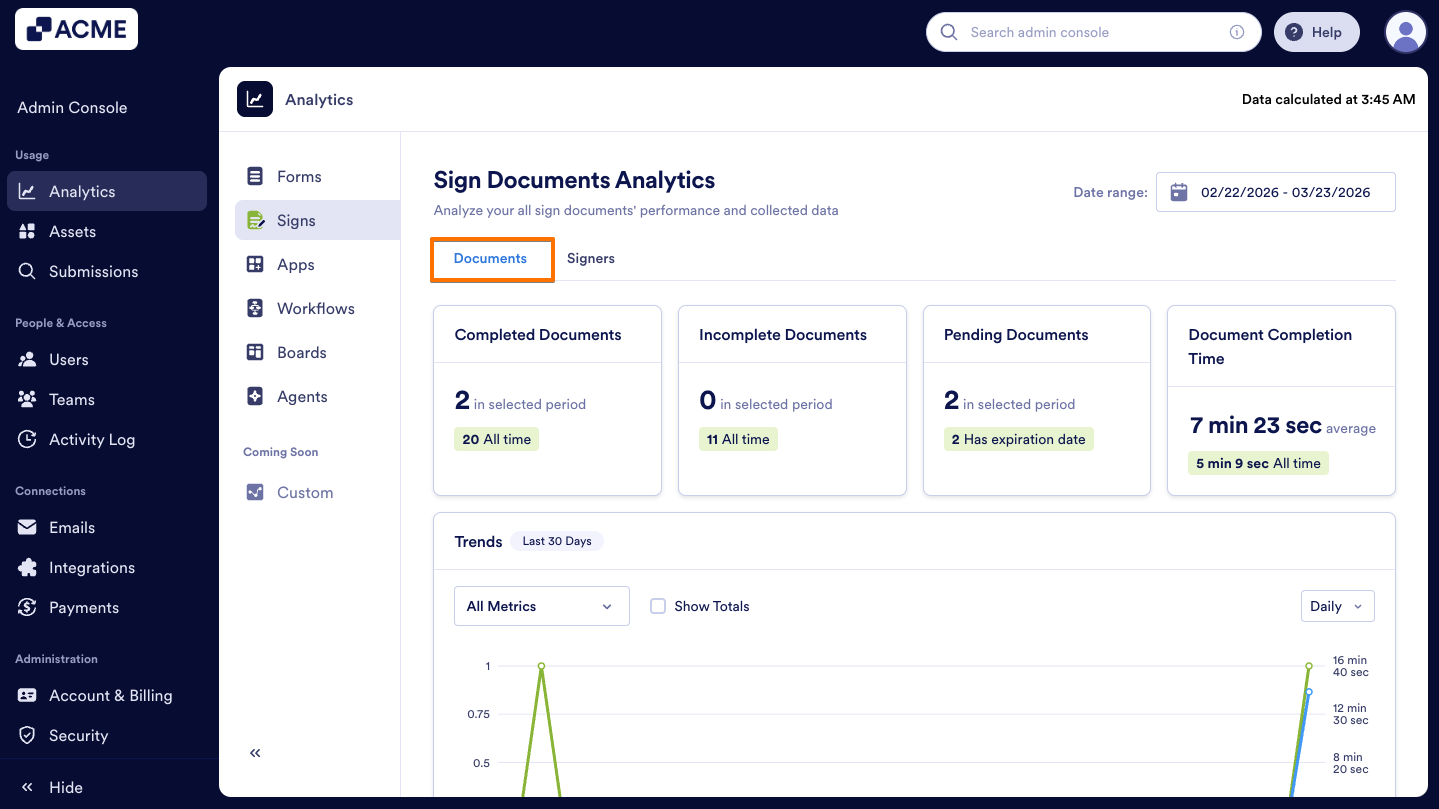
Documents Tab
The Documents tab focuses on overall Sign Documents activity and completion trends across your organization.
- Select the Documents tab to view the performance of all documents.

- From there, you can start applying filters, reviewing document statuses, and analyzing completion metrics to monitor activity effectively.
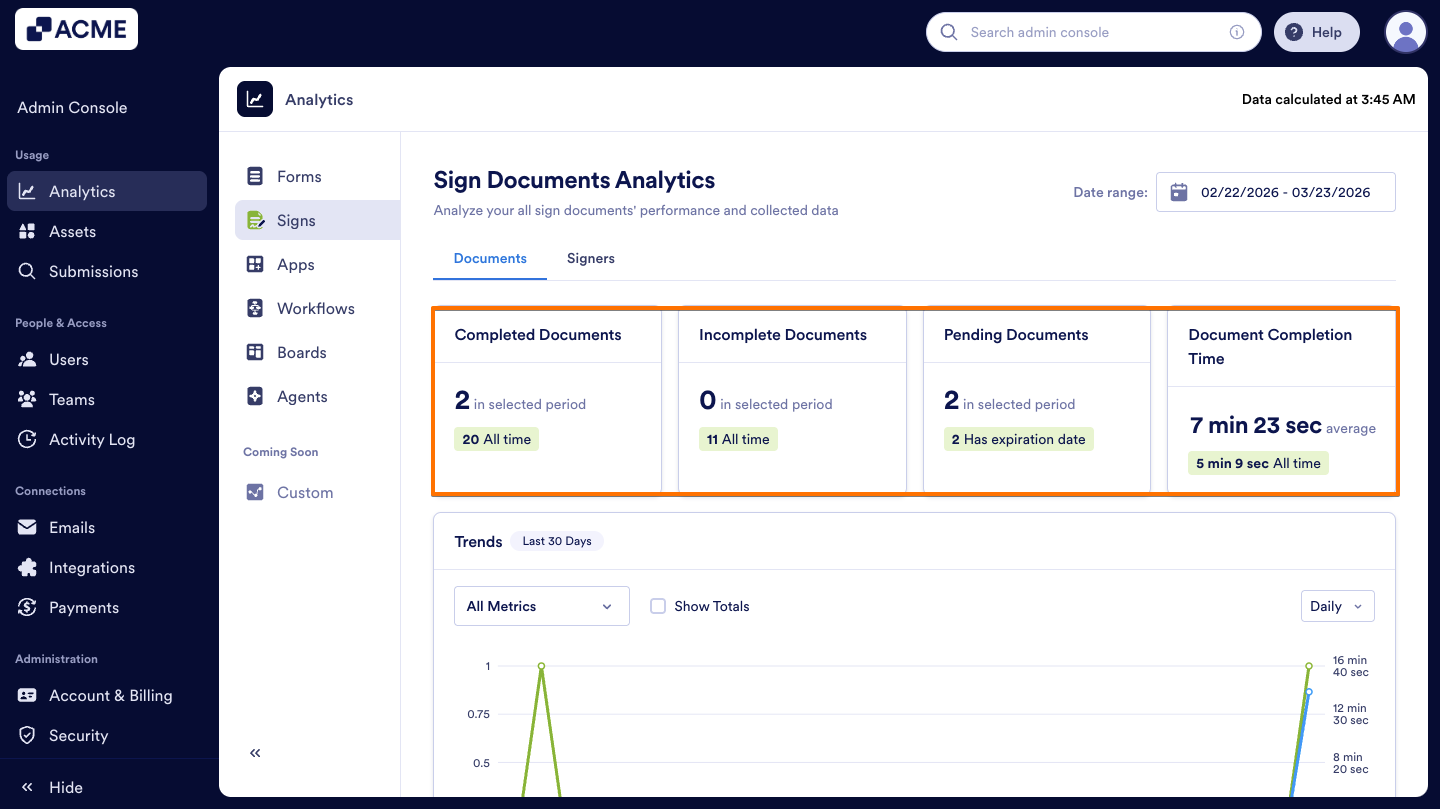
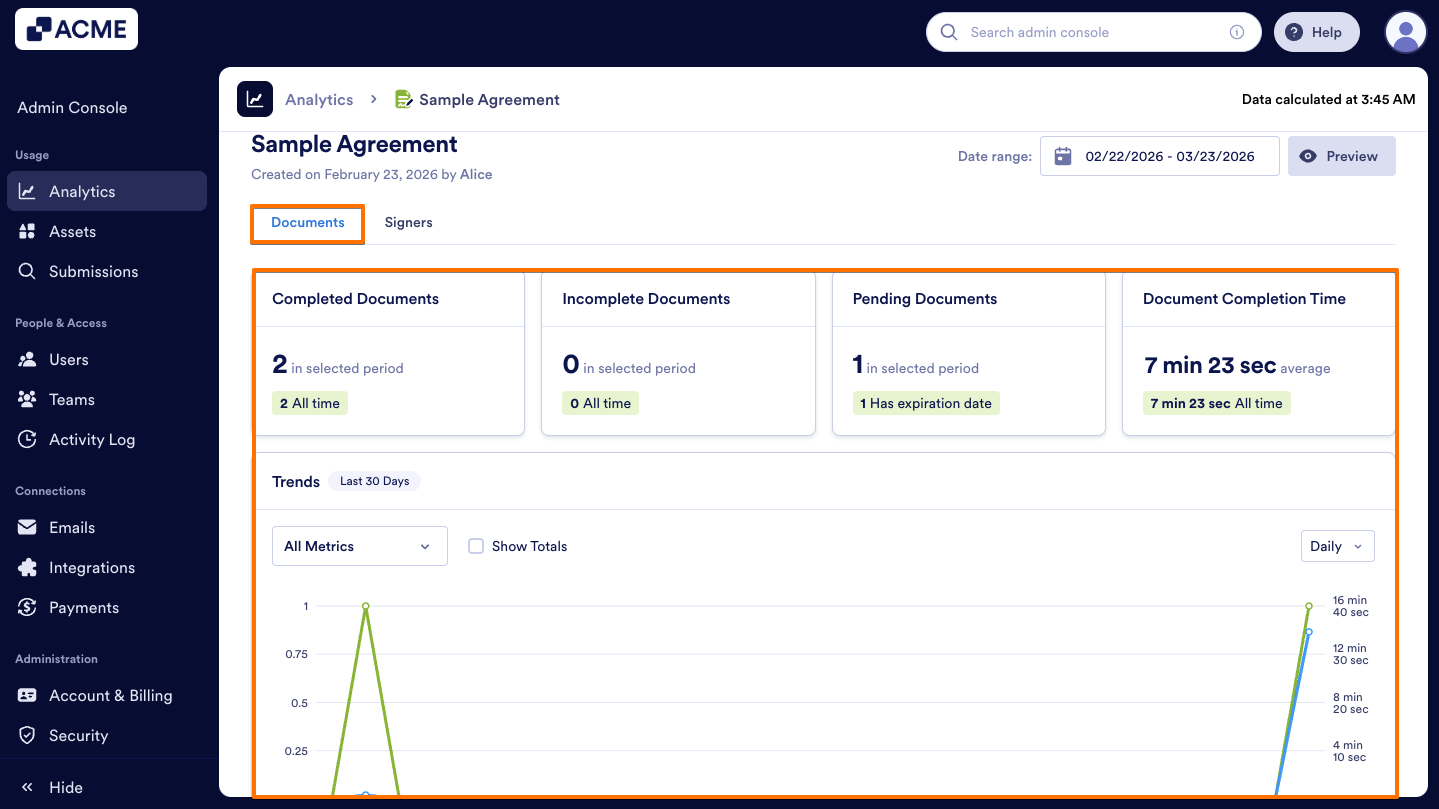
Here is the list of metrics provided for Sign Documents usage analysis:
- Completed Documents: The total number of documents that have completed the signing process.
- Incomplete Documents: The number of documents that could not be completed due to cancellations, declines, or expirations. (If a document is sent to multiple signers, a single cancellation or decline will mark it as incomplete.)
- Pending Documents: The total number of documents that are waiting to be processed or signed.
- Document Completion Time: The average time it takes for documents to be completed.
Trends Chart
The Trends Chart, located beneath the document metrics, is a line chart that visualizes the metrics above and helps track your organization’s document signing performance over a selected date range. As an admin, you can monitor performance across this period, customize which metrics are displayed or hidden, and adjust the chart view by daily, weekly, monthly, or yearly intervals.
Let’s walk through how to reach the Trends chart:
- In the Documents tab, on the upper right side of the page, click on the Date Range to select it.
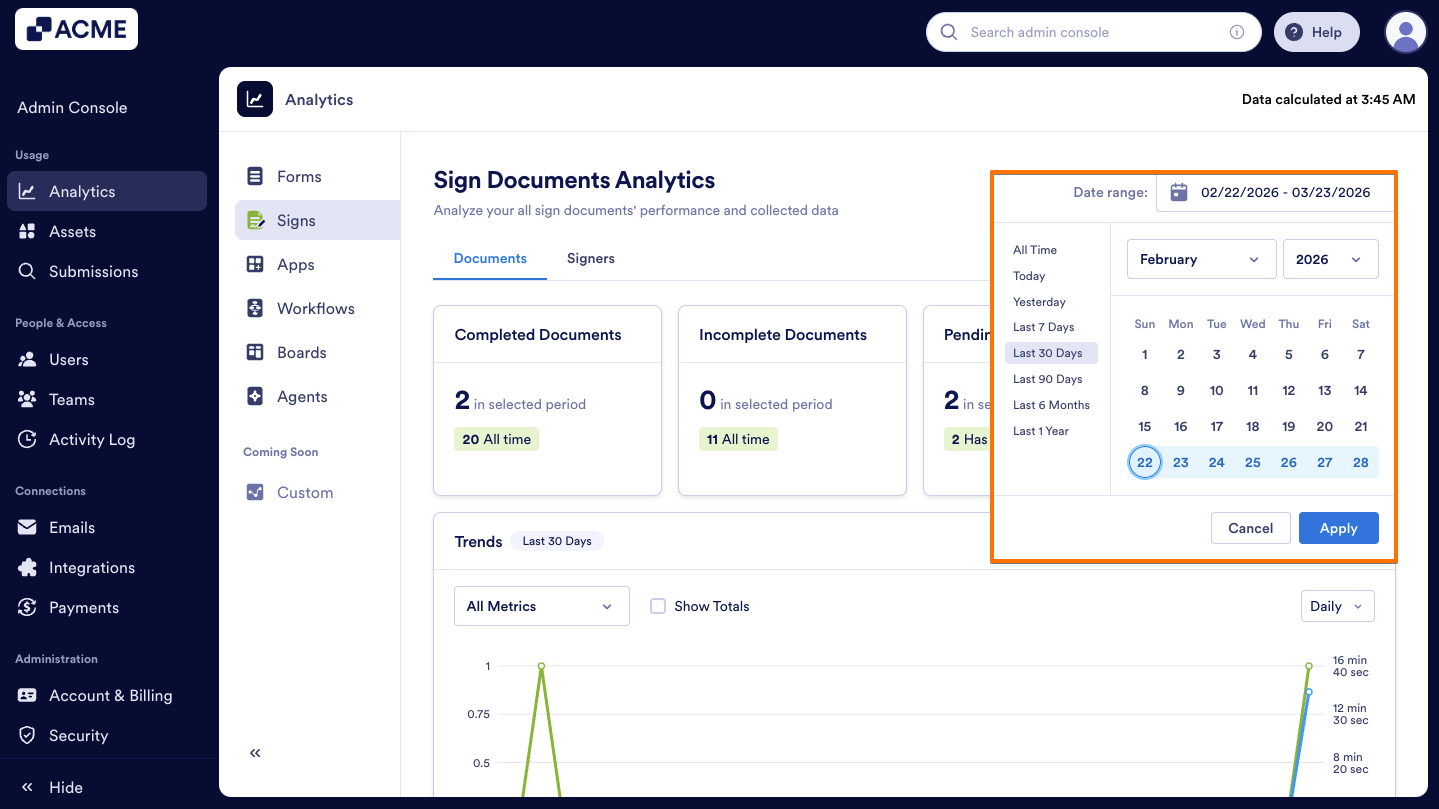
- Next, from the Dropdown menu, choose the metrics to include (e.g., incomplete, completed, average completion time).
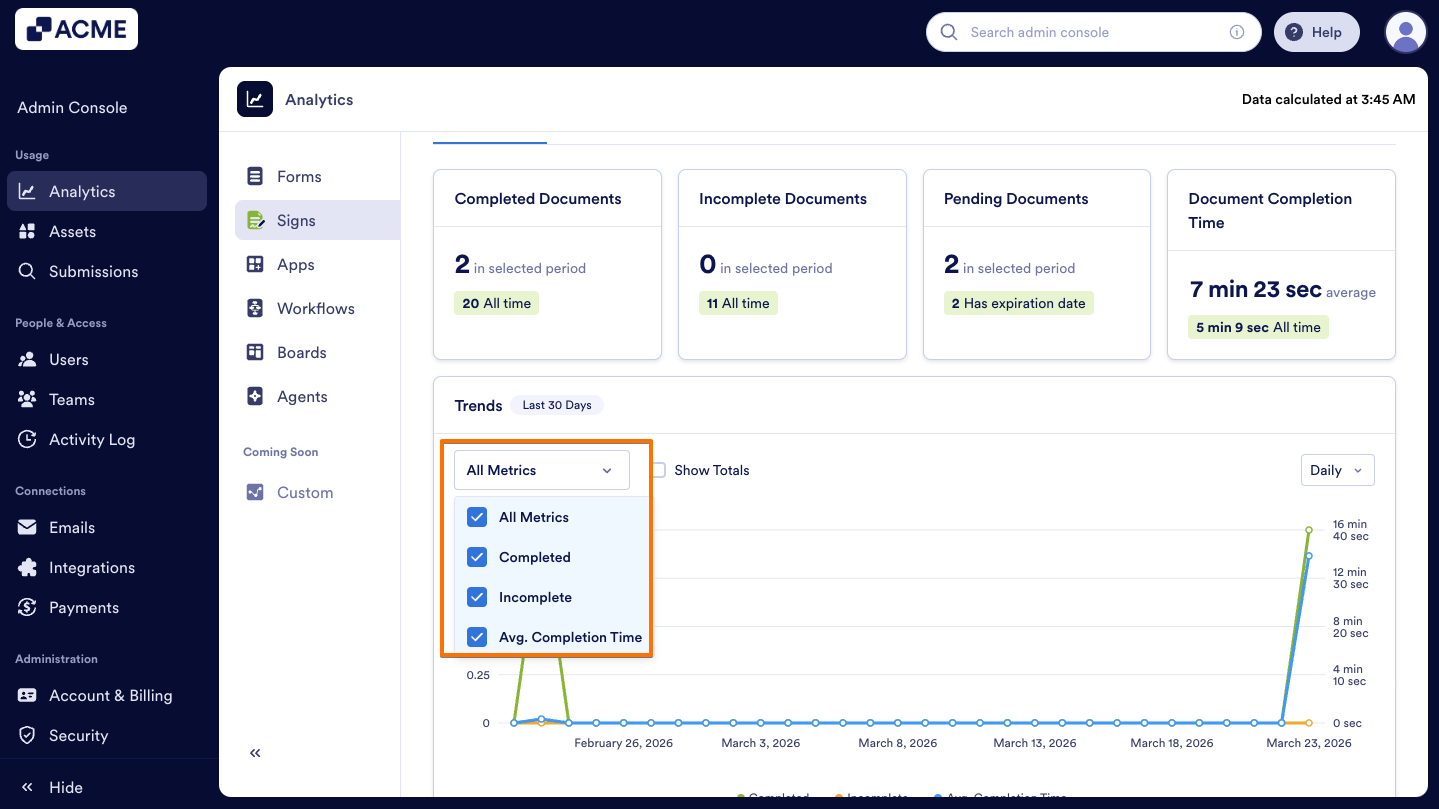
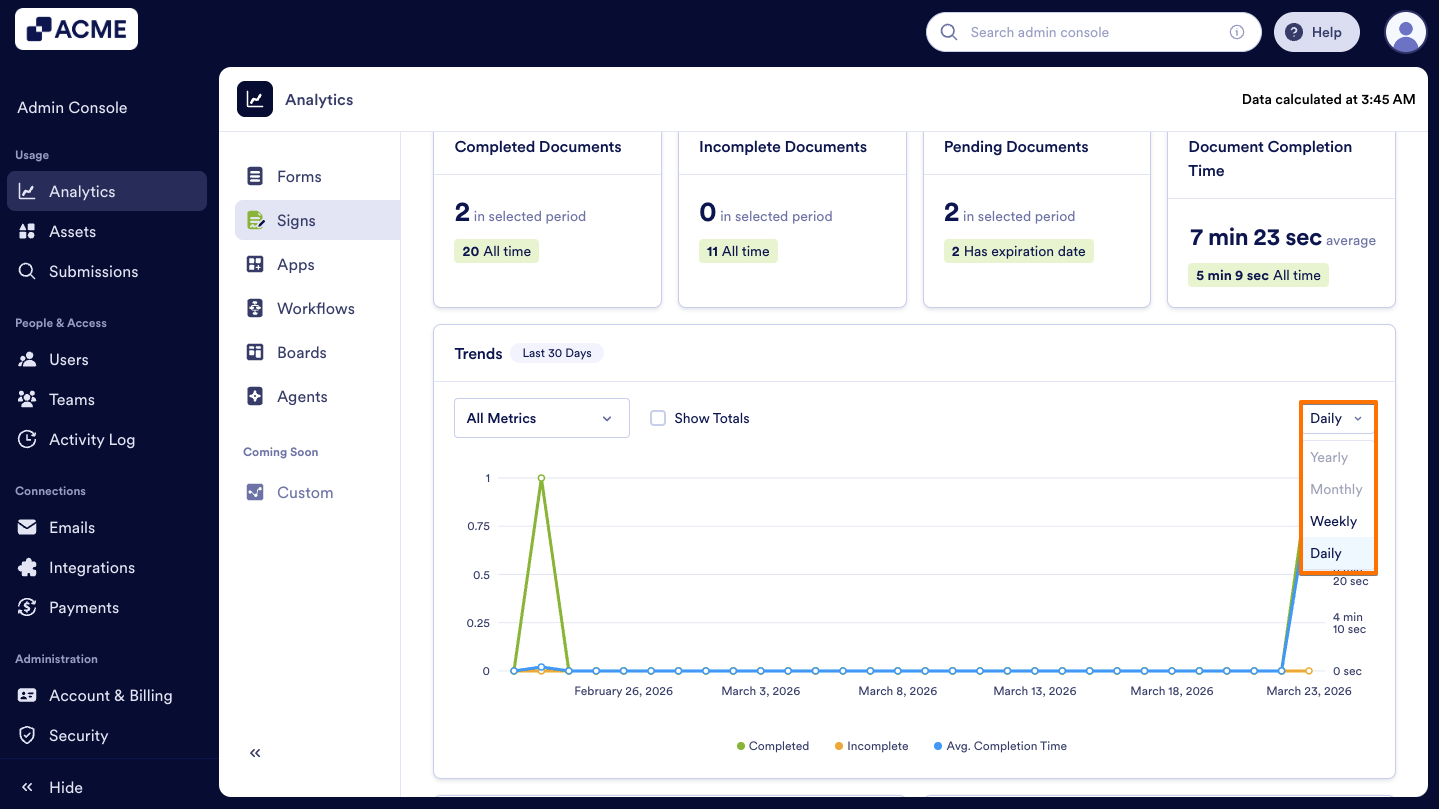
- Finally, set the view to Daily, Weekly, Monthly, or Yearly.
Note
When the date range is selected in the Documents tab, the selection will be applied to the Signers tab metrics.
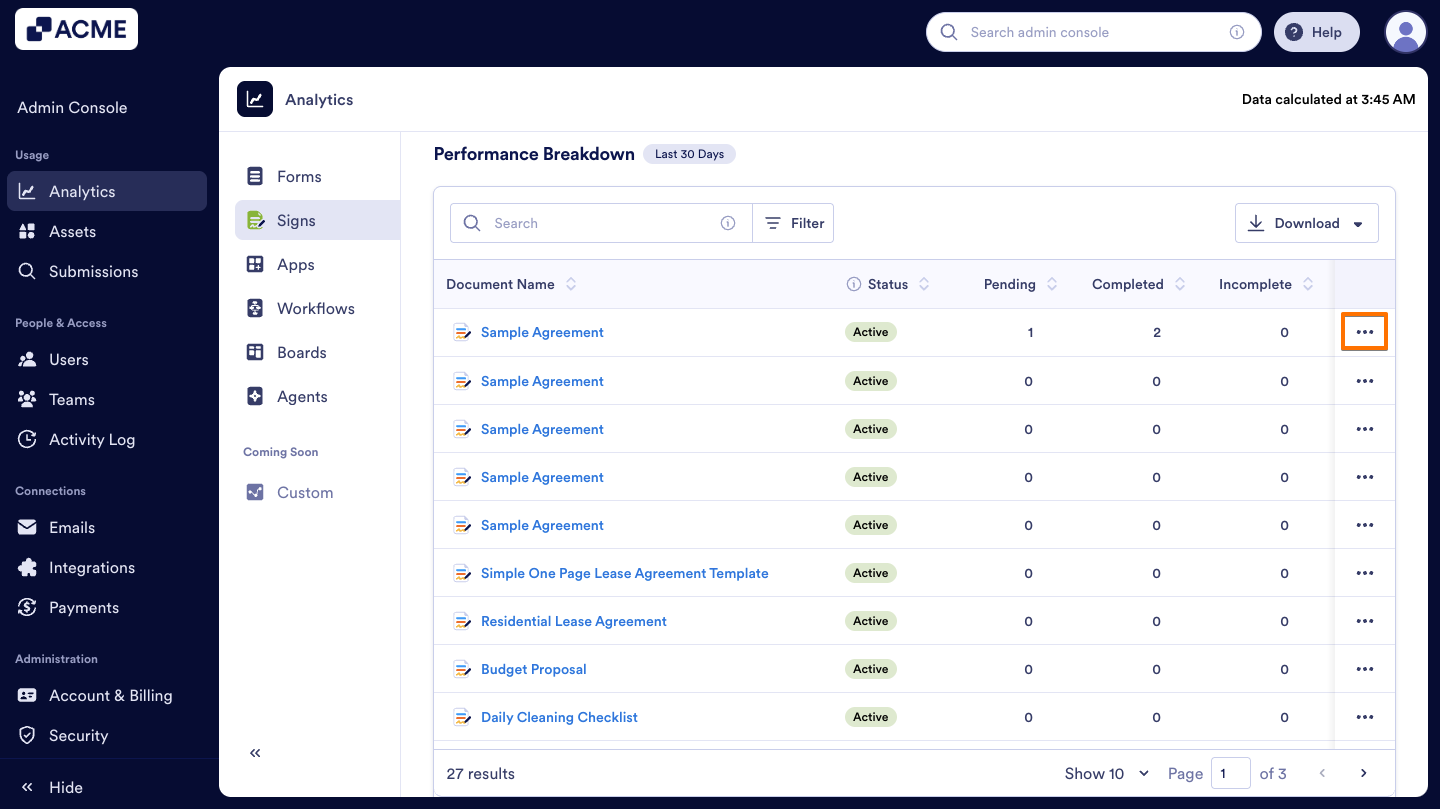
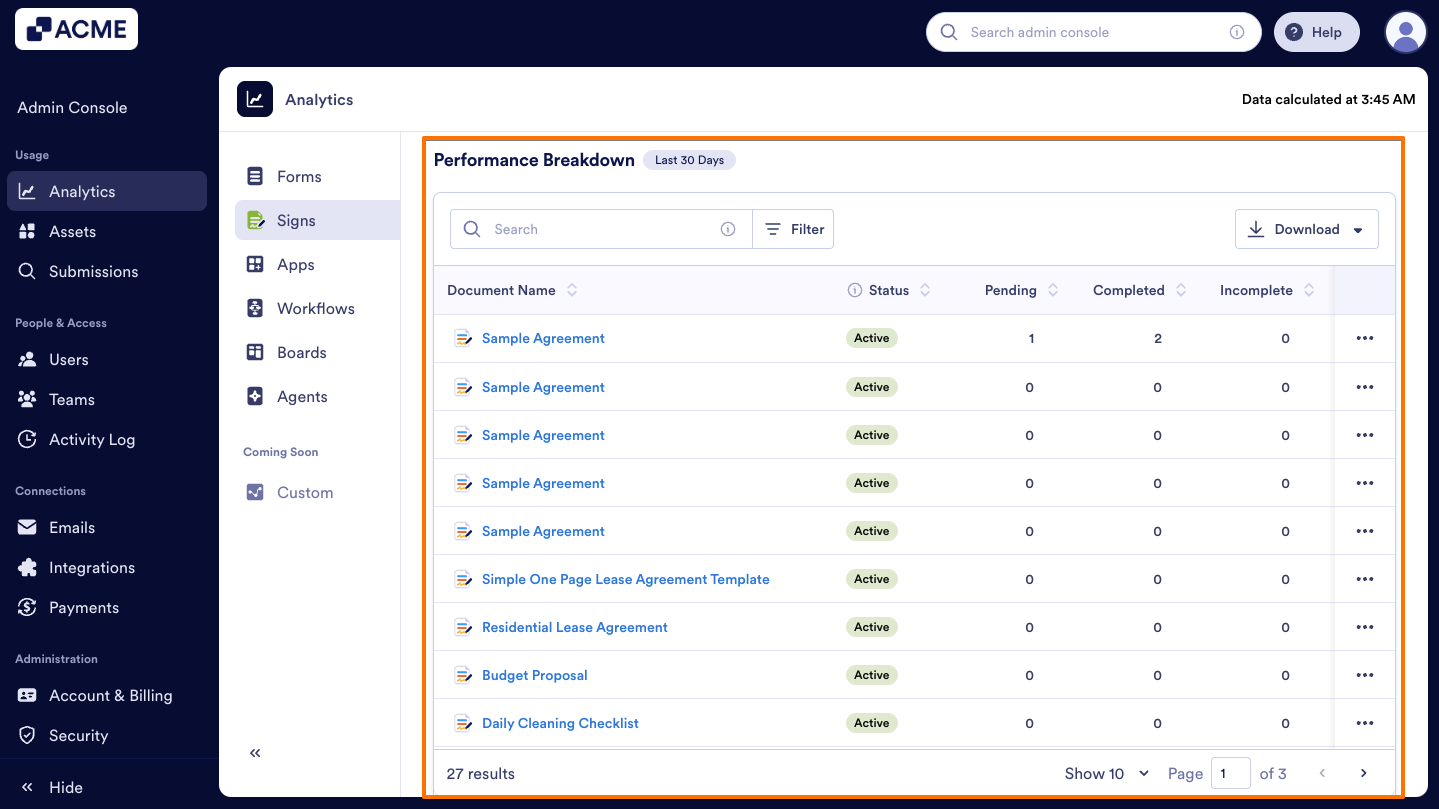
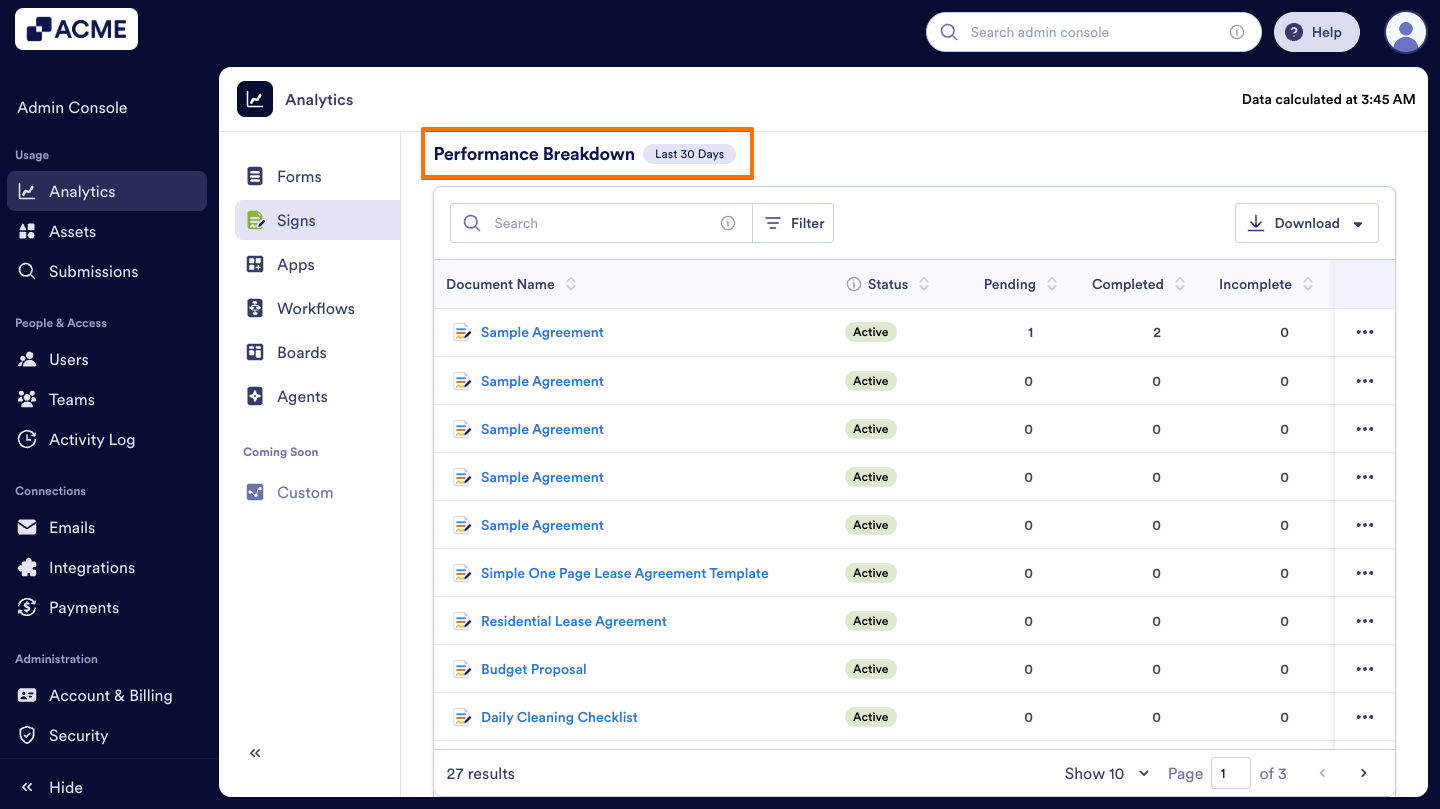
Performance Breakdown
In this section, you will see the distribution of all sign documents created across the organization. The list shows each document’s name, the number of pending, completed, and incomplete documents, the document completion time during the selected period, and the document owner.
Let’s walk through the steps together:
- In the Sign Document Analytics page, click on the Documents tab.
- Then, scroll down to the Performance Breakdown list to see all Sign Documents.

- If you want to view analytics or preview a specific Sign Document, click on the Three dots icon beside the document.
Tip
The Performance Breakdown section always displays the most up-to-date information, regardless of the selected time range.
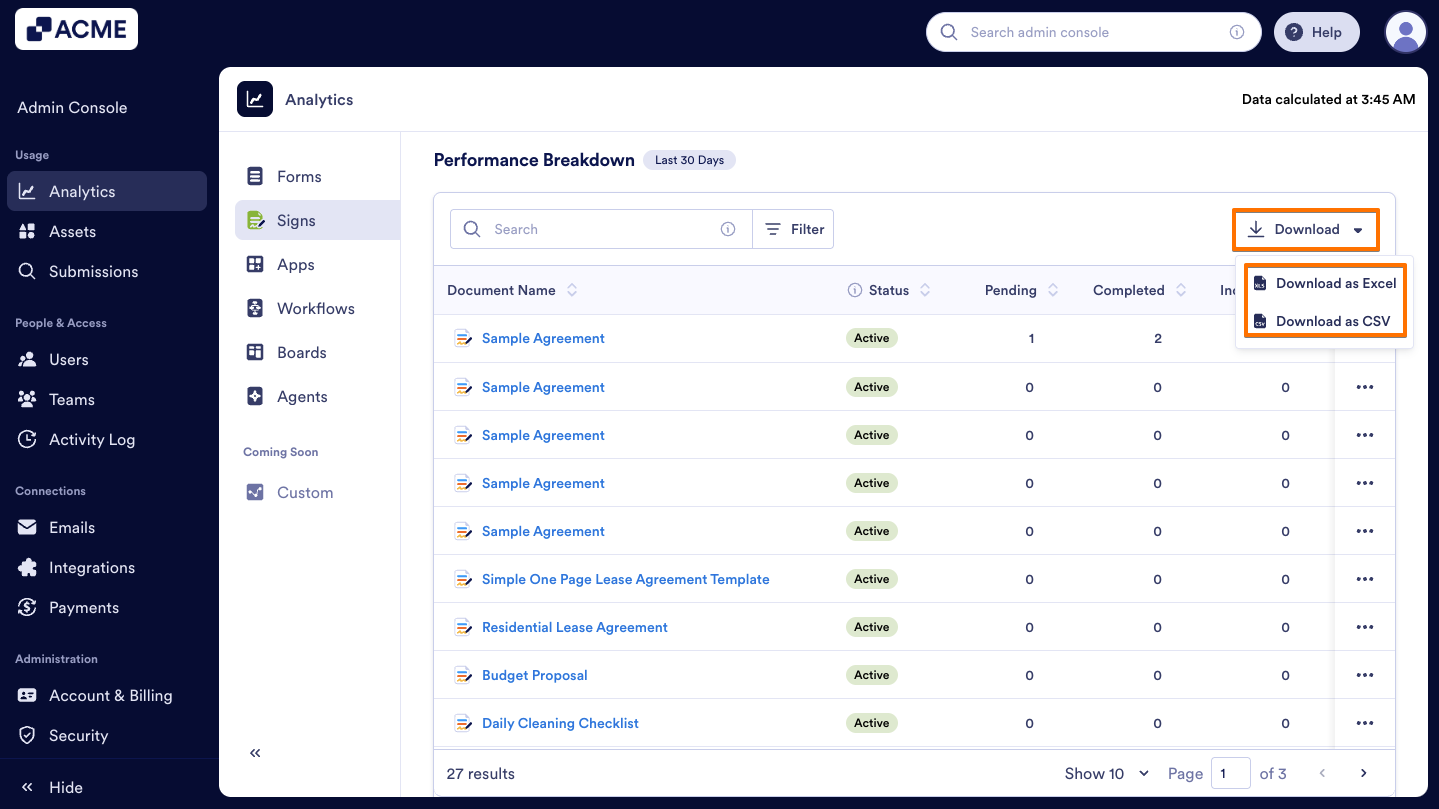
Download Sign Documents Data
In the Performance Breakdown section, you can also download Sign Documents data, which includes document name, completion status (pending, completed, or incomplete), document completion time, Last Edit, Creation Date, and Owner.
- In the Sign Document Analytics page, under Documents, scroll to Performance Breakdown section at the bottom of the page.
- Click on Download and select how you’d like the file to be downloaded.
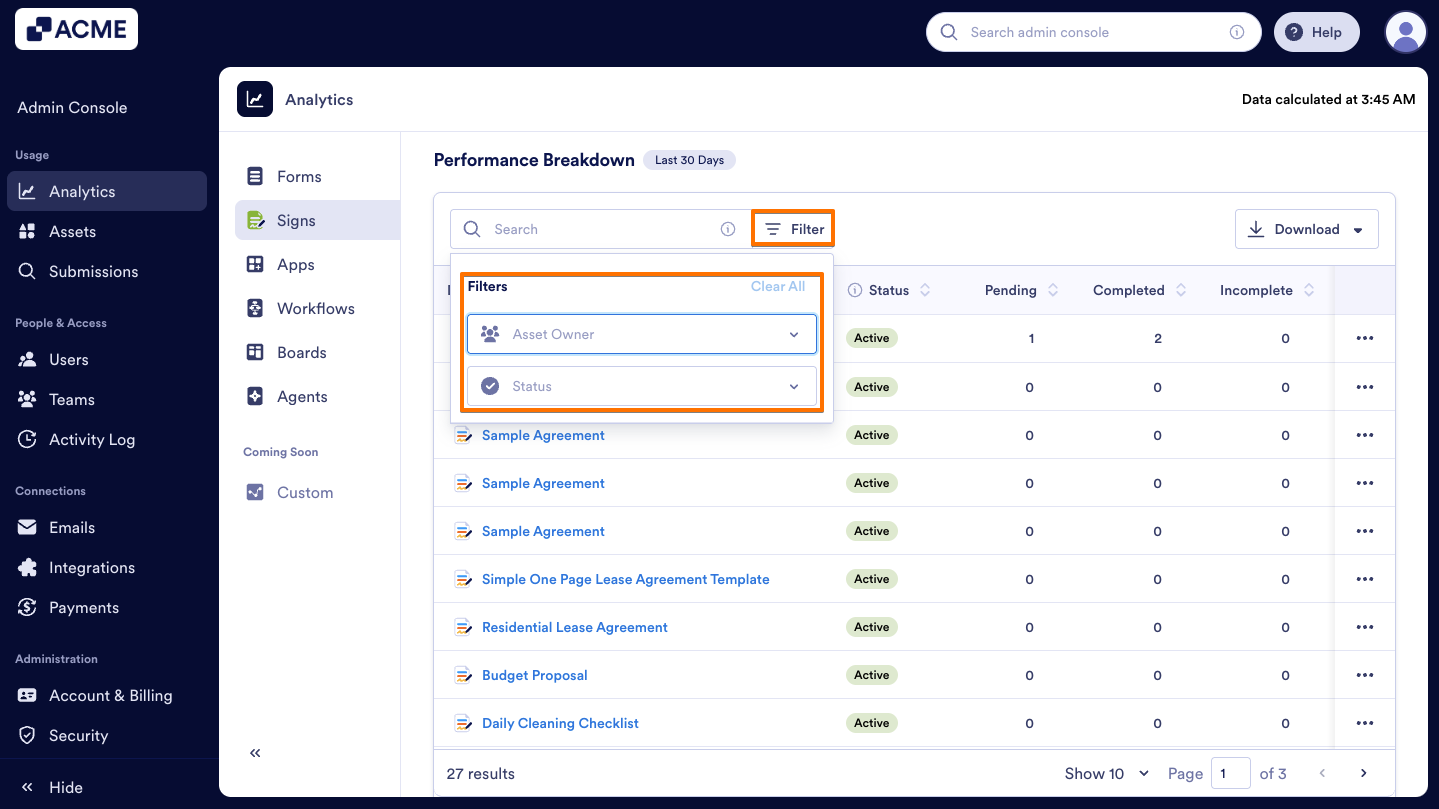
Filter Sign Documents Data
You can use filters to quickly locate the Sign Document you want to view and check details such as its status, pending, completed, and incomplete counts, as well as its completion time and owner. Here’s how:
- In the Sign Document Analytics page, under the Documents tab, scroll down to Performance Breakdown.

- On the right side of the Search bar, click on Filter.
- Select the Asset Owner or the document’s Status (Active or In Trash) based on your needs.
Signers Tab
The Signers tab provides insights into how and where your organization’s documents are being completed and the status of the documents (sent, opened, and signed).
- Select the Signers tab to view the insights of all Sign Documents.
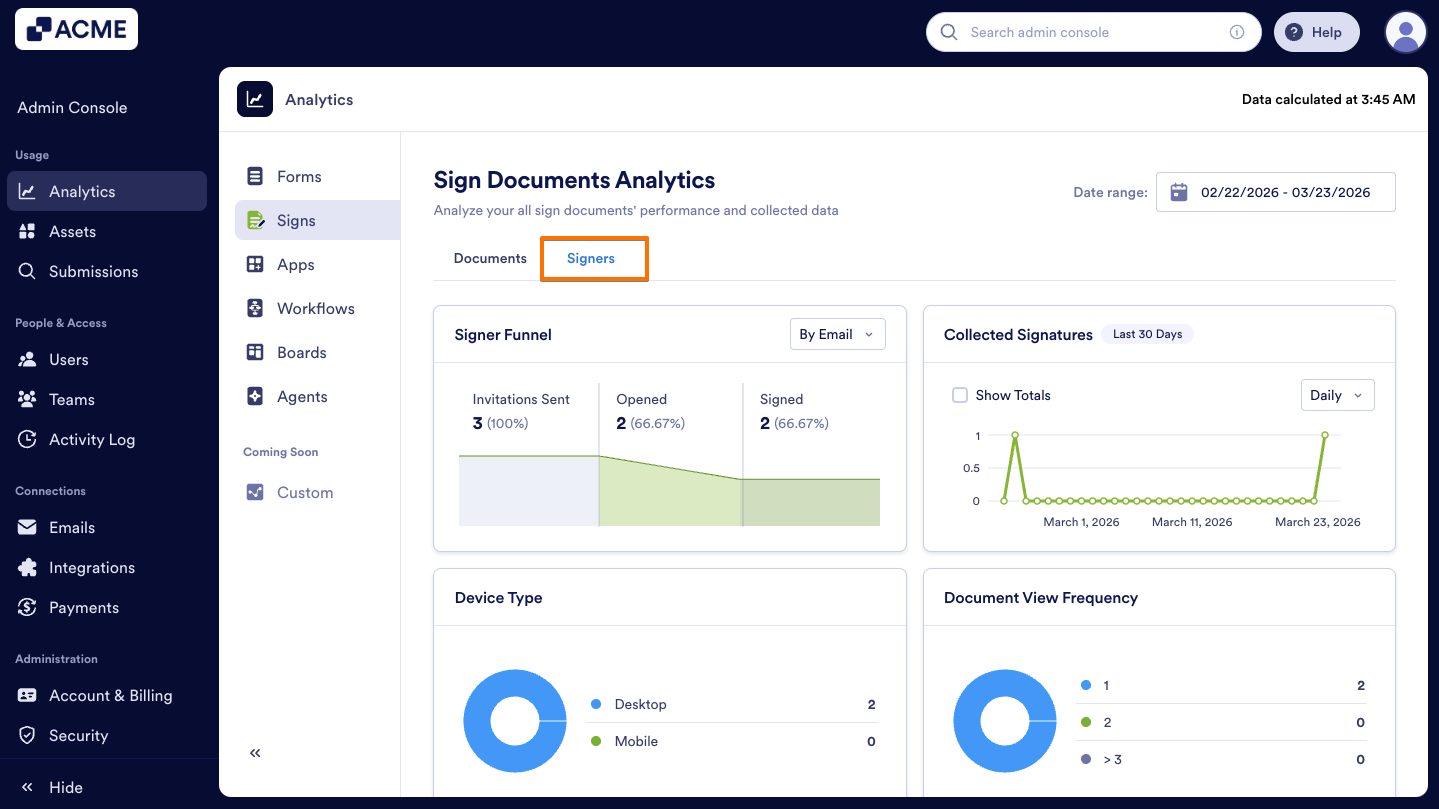
- You will be taken to the Signers Analytics dashboard, where you can explore detailed metrics on signer activity.
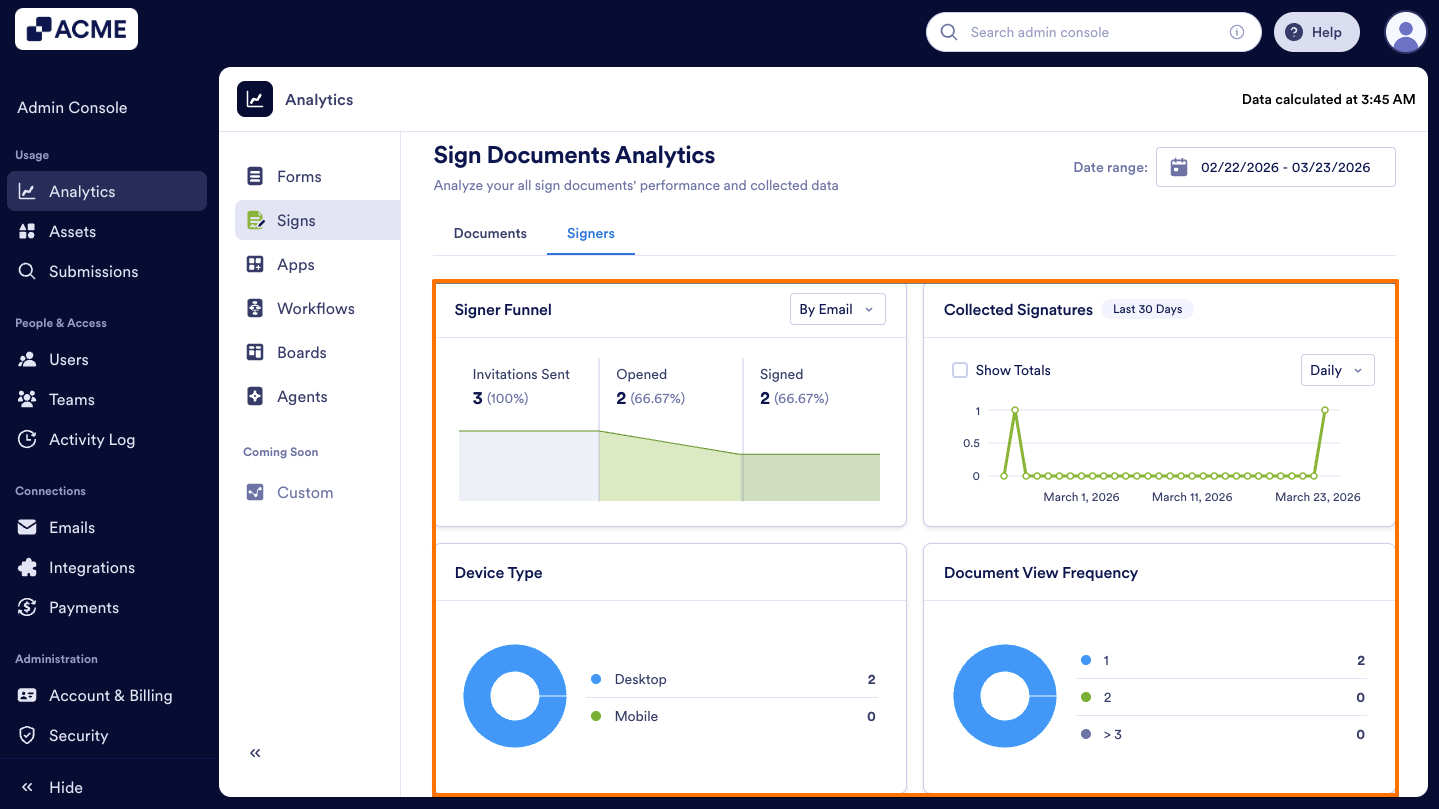
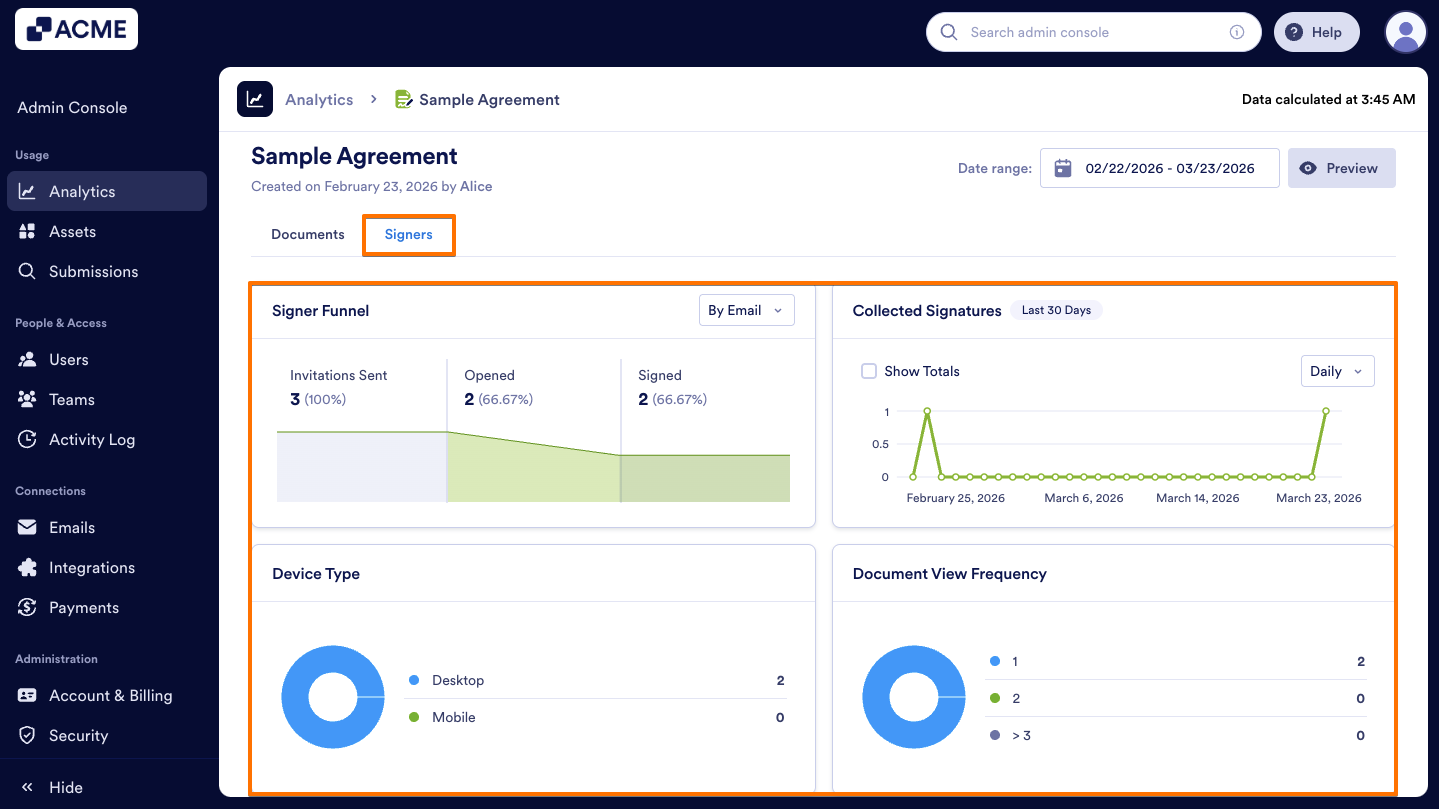
Here is the list of metrics provided for Sign Documents Signers analysis:
- Signer Funnel: The percentages of sign documents distributed by the status. (Invitations Sent, Opened, Signed)
- Collected Signatures: The number of signatures collected through time in a line chart.
- Device Type: Signer distribution numbers by device type (Mobile vs. Desktop) in the organization.
- Document View Frequency: Distribution of viewers in a pie chart on how many times they viewed a Sign Document (once, twice, or more than three times)
- Country: Signer distribution numbers by country in the organization.
- Browser: Signer distribution numbers by browser in the organization.
- Operating System: Signer distribution numbers by operating system (e.g., Windows, macOS, iOS, Android) in the organization.
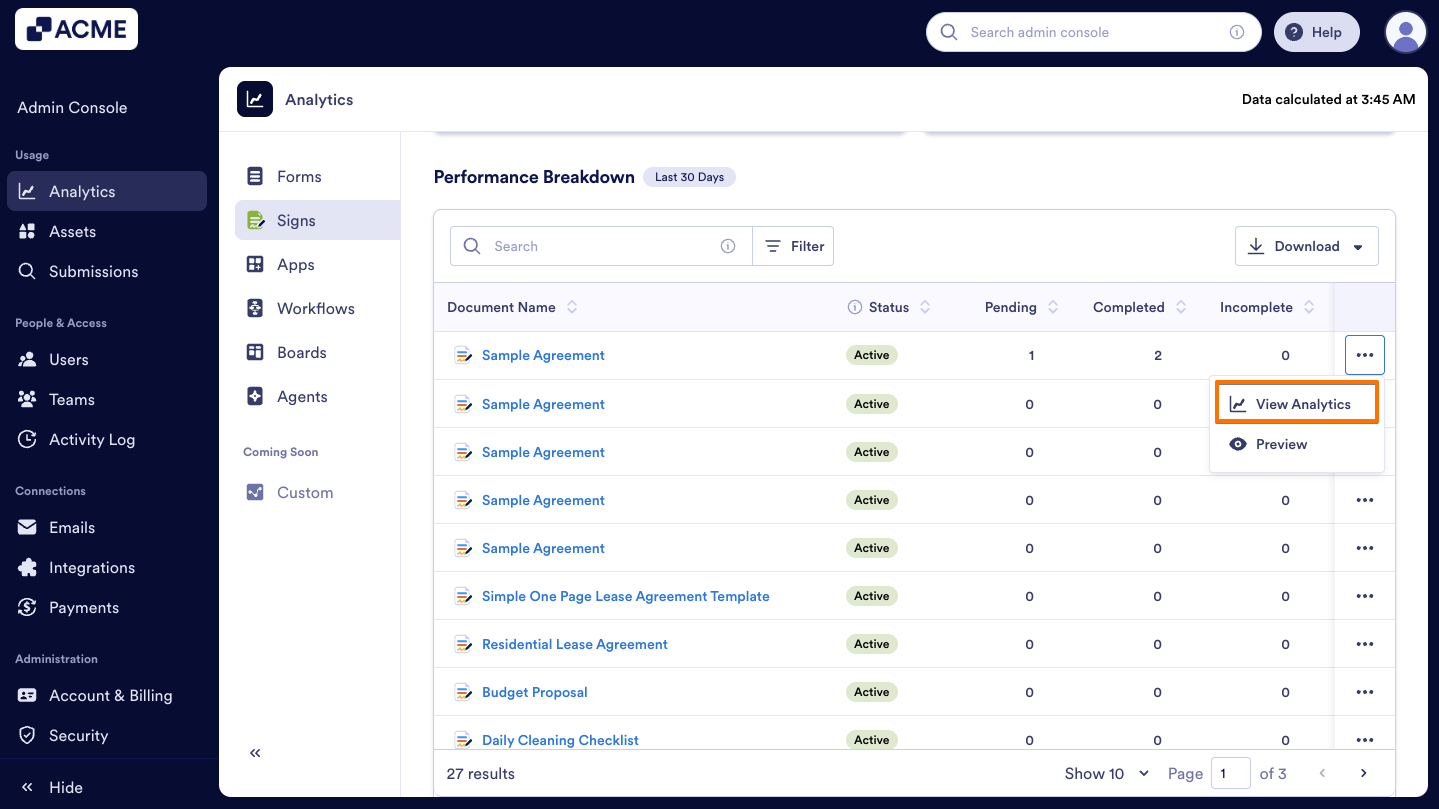
View Analytics for a Single Sign Document
You can also view the data for a specific document in the Documents tab. We’ll walk through steps together:
- In the Sign Document Analytics page, under the Documents tab, scroll to the Performance Breakdown section.
- Click on the Three dots menu next to the Sign Document you’d like to view analytics for.

- Then, click on View Analytics.

- Finally, under a single sign document analytic’s Documents tab, you will see cards displaying Completed Documents, Incomplete Documents, Pending Documents, and Document Completion Time, along with a Trends chart visualizing these metrics.
View Signers Analytics for a Single Sign Document
You can also view the analytic data for a specific document in the Signers tab. We’ll walk through steps together:
- In the Sign Document Analytics page, under the Documents tab, scroll to the Performance Breakdown section.

- Click on the Three dots icon next to the sign document you’d like to view analytics for.

- Then, click on View Analytics.
- Finally, go to the single sign document’s Signer tab, you will see cards displaying the Signer Funnel, Collected Signatures, Device Type, Document View Frequency, Country, Browser, and Operating System metrics' cards.

Send Comment: