AI Agents do a lot of work. If you’re curious about how they’re performing, including the number of sessions they’ve been in, the duration, and the average user interaction, you can check out AI Agents’ Performance Metrics. Here, you’ll find data to help analyze performance across specific date ranges, compare metrics, and drill down into trends.
Accessing AI Agent Performance Metrics
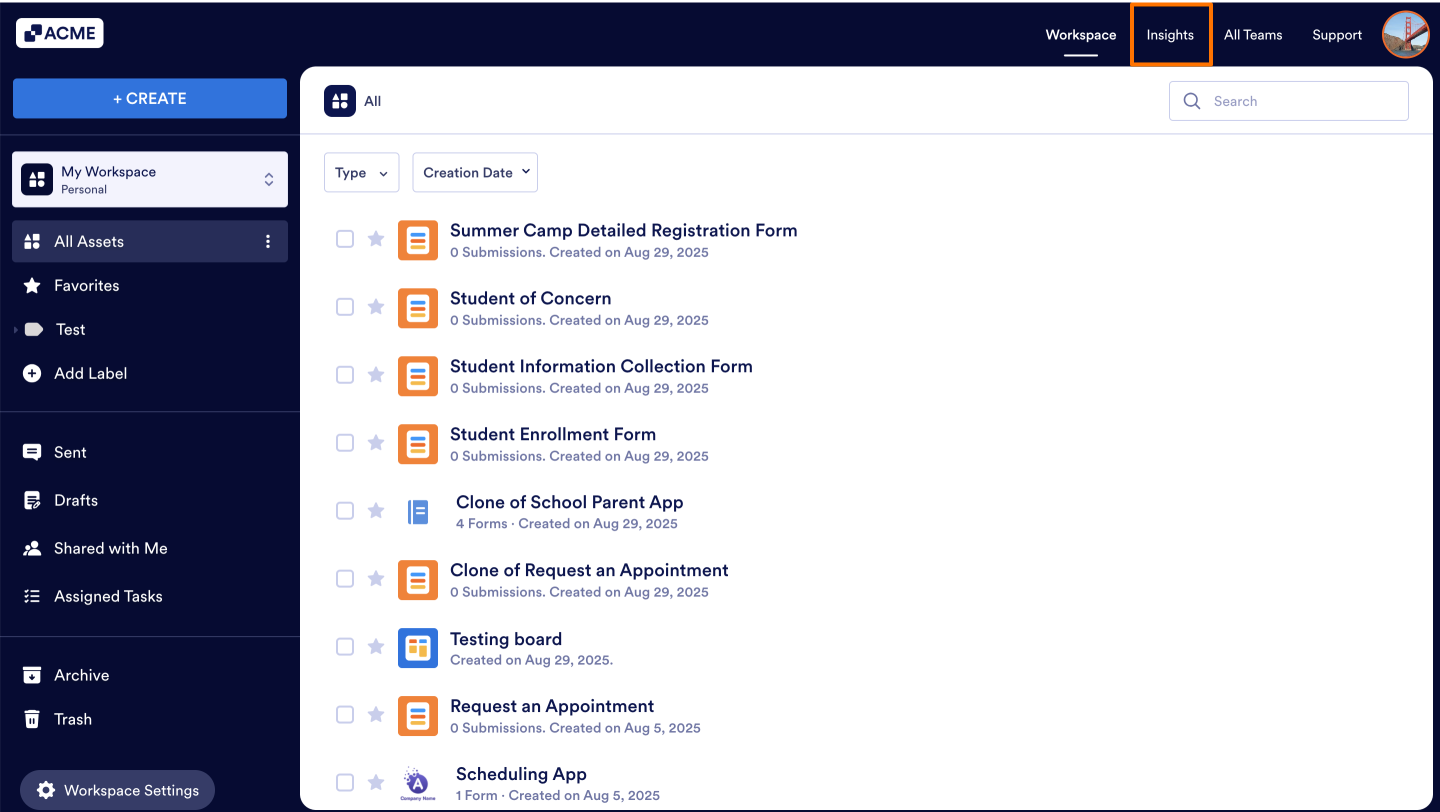
- In My Workspace, click on Insights in the upper right-hand corner of the page.
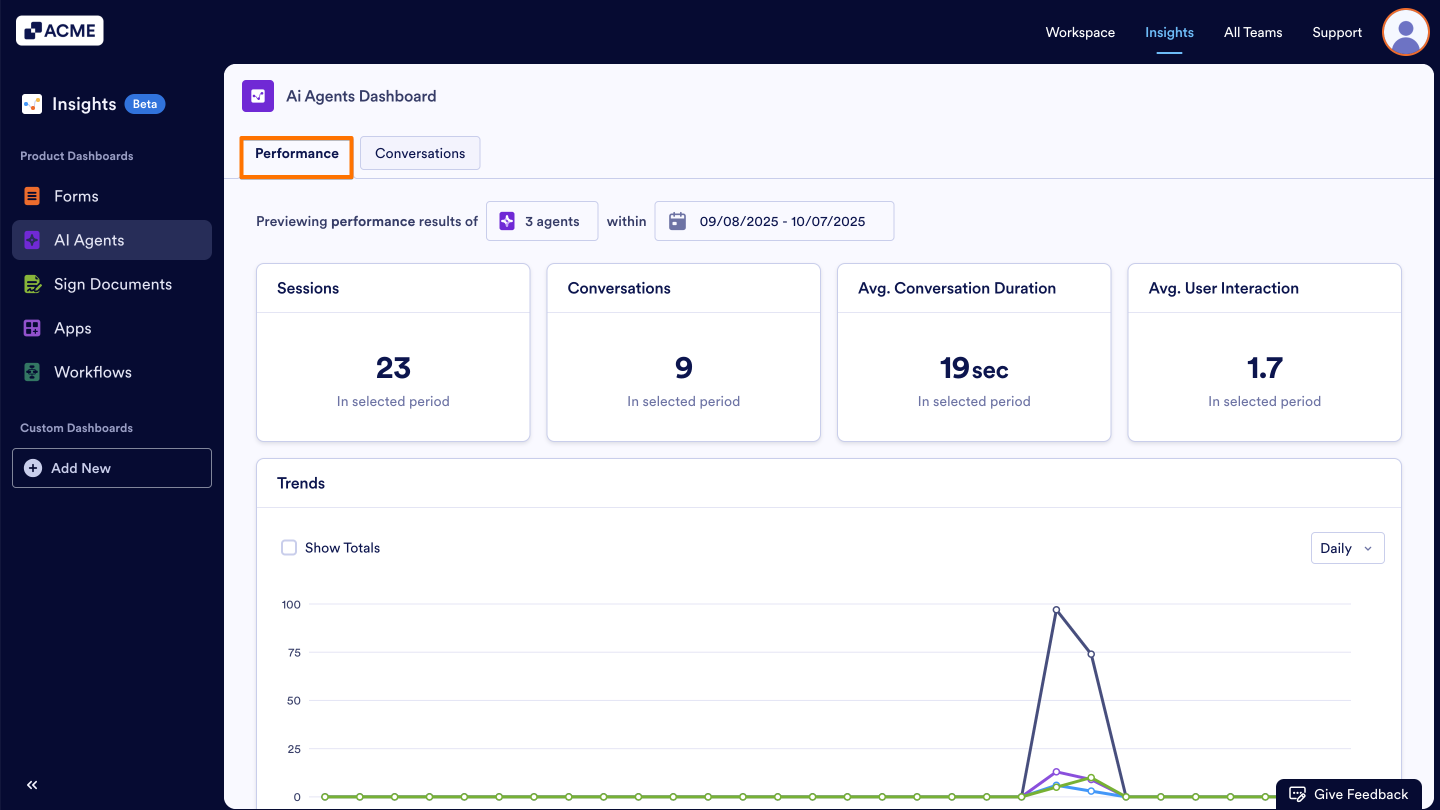
- Next, click on AI Agents from the menu on the left.
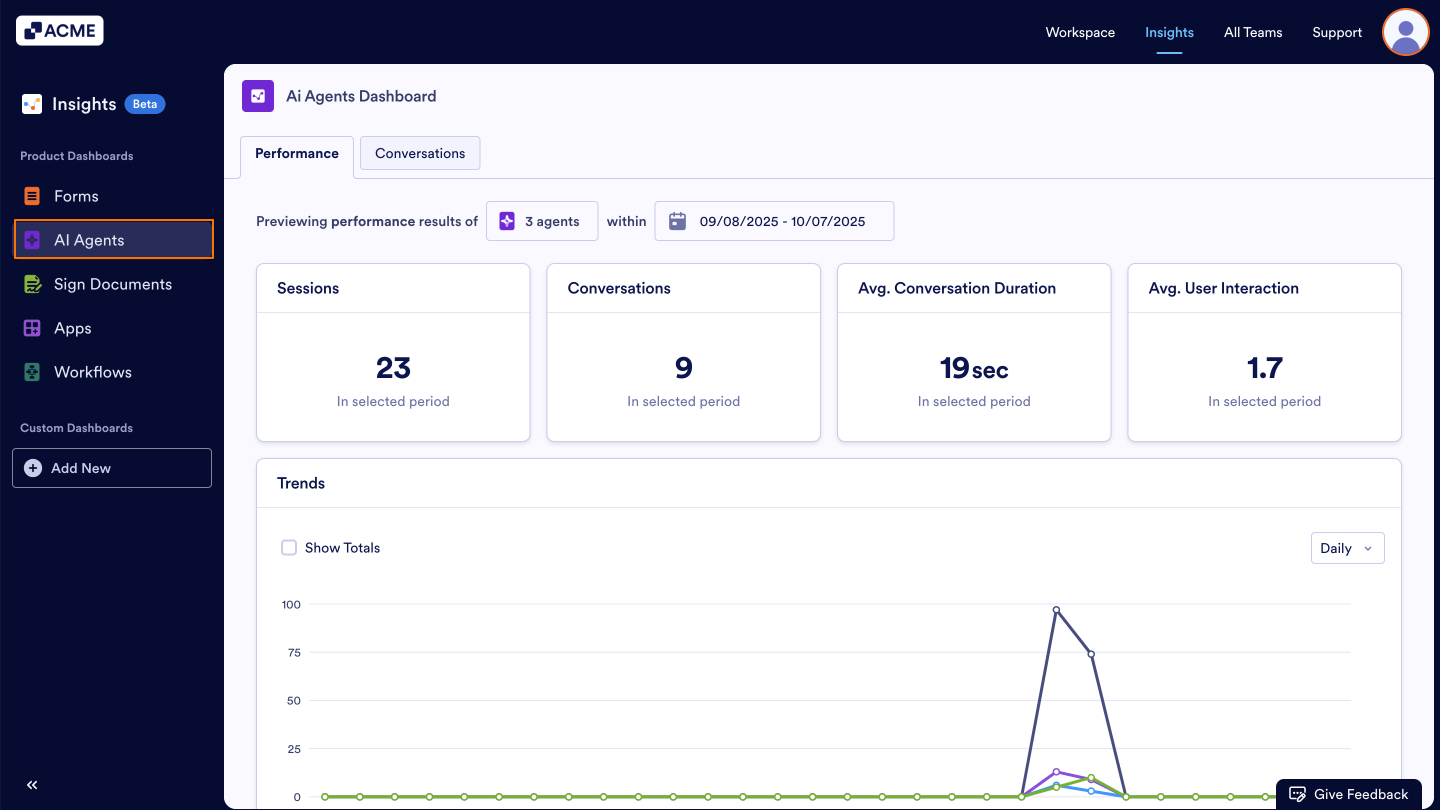
- Under AI Agents Dashboard, select the Performance tab.
What metrics do we provide?
All metrics in this tab track Key Performance Metrics, such as the total sessions, the total conversations, the average duration of those conversations, and the average user interaction. These metrics are specific to the date range selected at the top of the page.
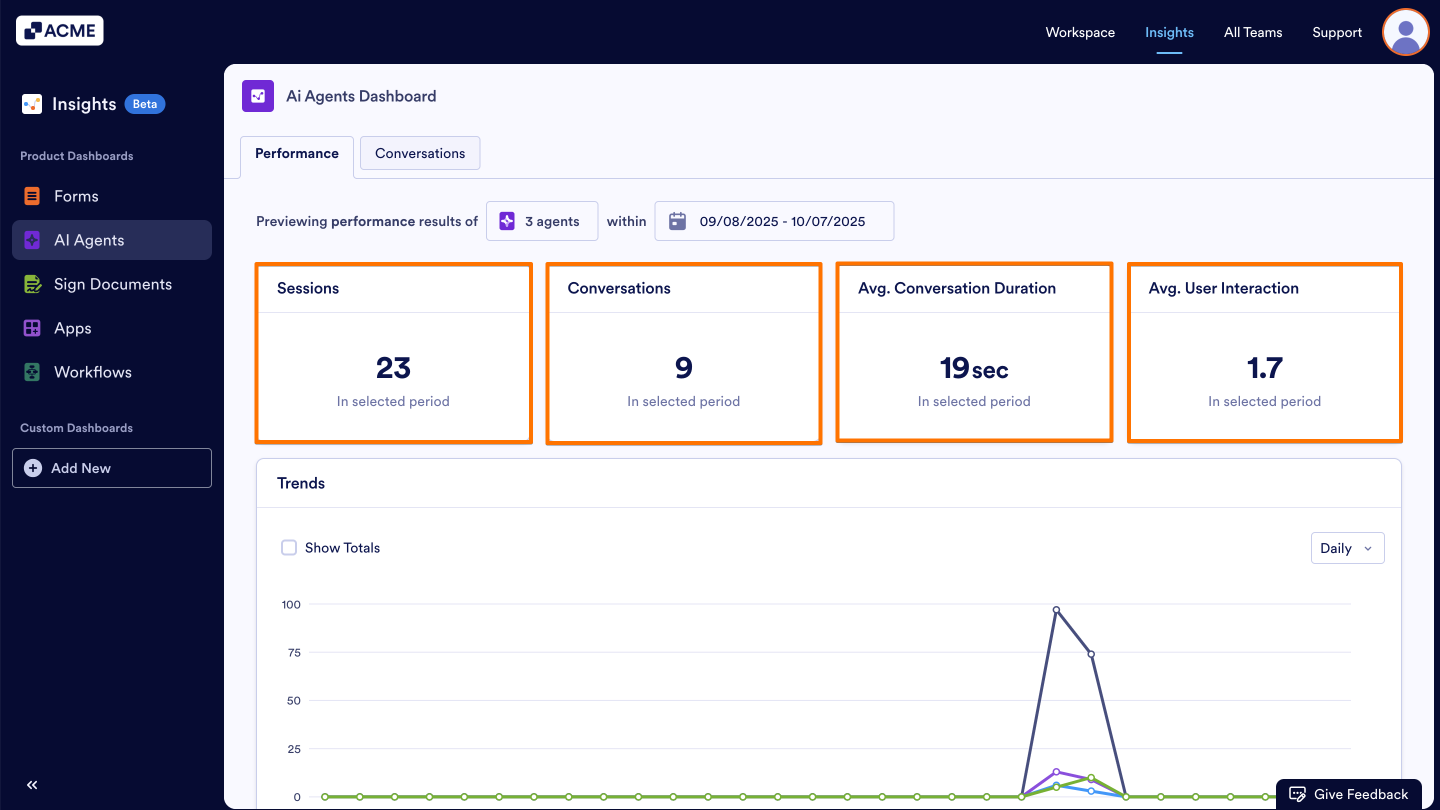
- Sessions: This metric tracks the total number of sessions that started when a page with an AI Agent was opened, regardless of whether or not a chat started.
- Conversations: This metric tracks the total number of conversations a visitor started with an AI Agent.
- Average Conversation Duration: This metric tracks the average length of conversations between users and the agent. For example, if one agent has a conversation that lasts 10 minutes and another that lasts 26 minutes, the average conversation duration would be 18 minutes.
- Average User Interaction: This metric tracks the average number of messages sent to an agent by users. For example, if the agent is sent 10 messages in one chat, 15 in another, and 13 in a third, the average user interaction would be 19 messages.
Trends
Want to see a more detailed breakdown, day-to-day or month-to-month? Under Trends, you can view the above metrics in a line chart and based on a time interval you choose.
Trends, by default, shows all metrics in a daily breakdown, but you can customize this based on your needs.
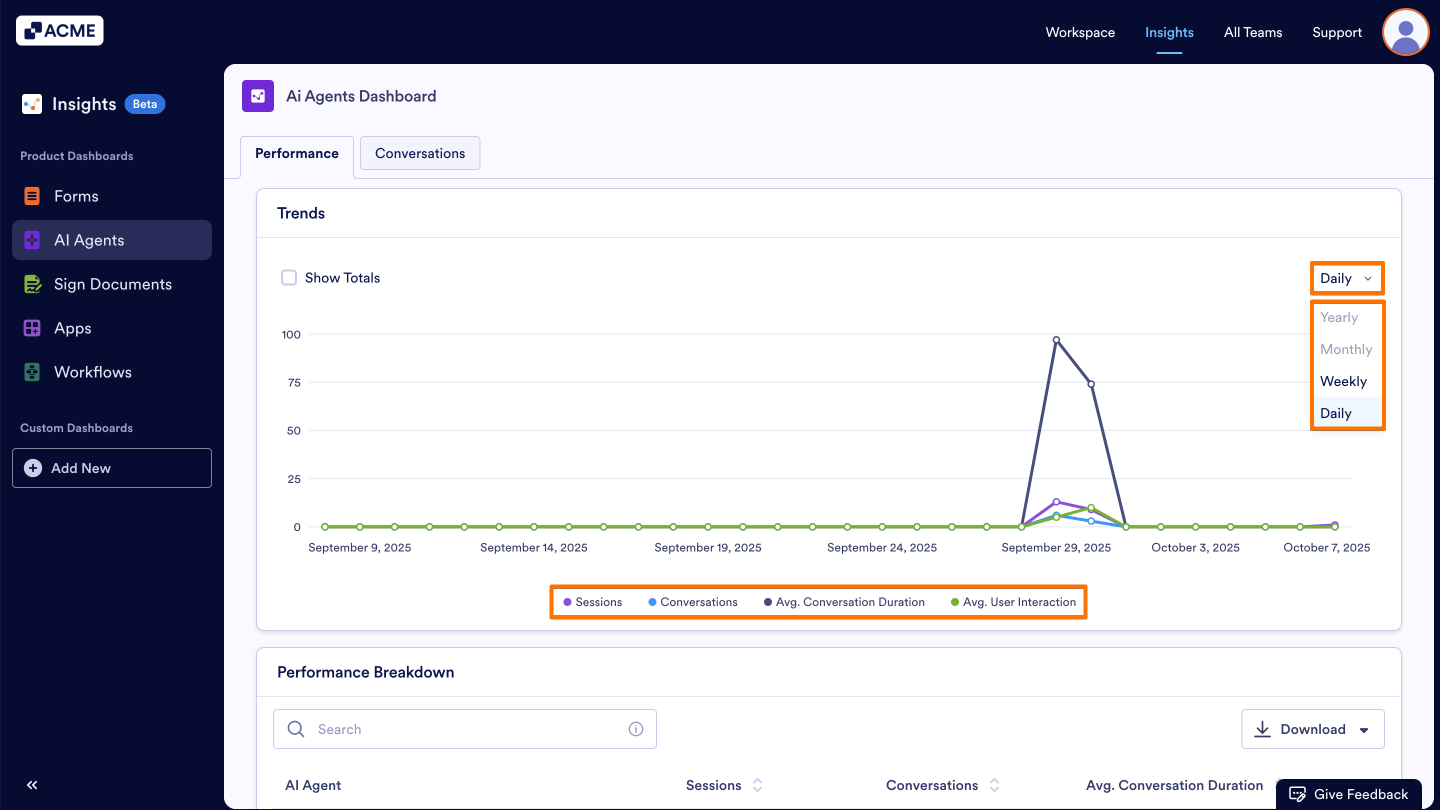
- Add/Remove Metrics: Click on the metric name at the bottom of the chart to add or remove it from the chart.
- Changing the Time Interval: Click on the drop-down menu at the top of the chart and select daily, weekly, monthly, or yearly.
- Depending on the date range you’ve selected, some options might not be available. For example, if your date range for the tab is set to last seven days, you won’t be able to select monthly or yearly.
Performance Breakdown
Need an even more detailed overview for each AI Agent? Within the Performance Breakdown List, you can view all agents in the selected date range along with their individual metrics. These metrics include Total Sessions, Total Conversations, Average Conversation Duration, and Average User Interactions.
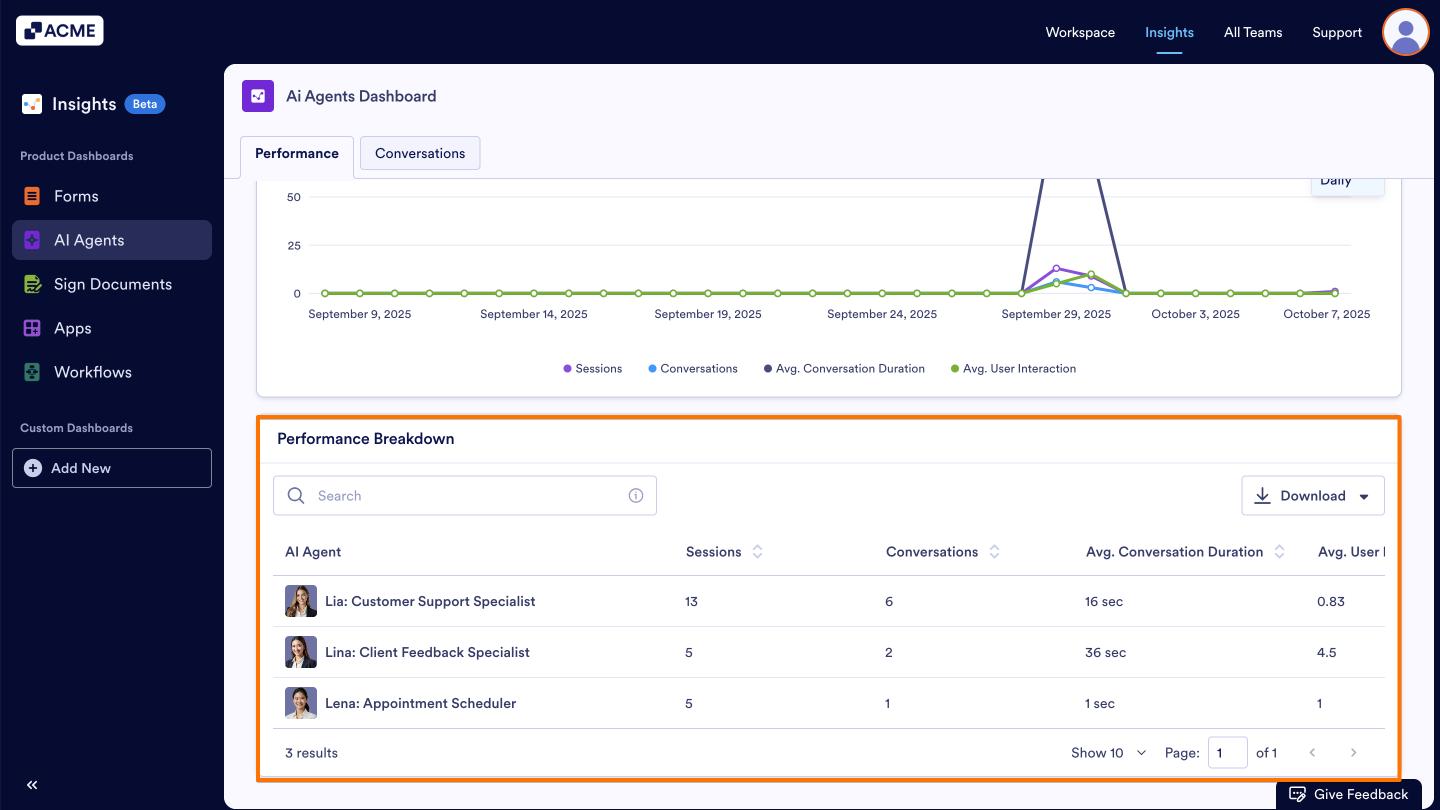
- These metrics are per agent and are specific to the date range selected at the top of the page.
- You can download the entire list by clicking the Download button on the right and saving it as a CSV or Excel file.
See also:
How to filter AI Agent Metrics in a specific date range in Insights?

Send Comment: