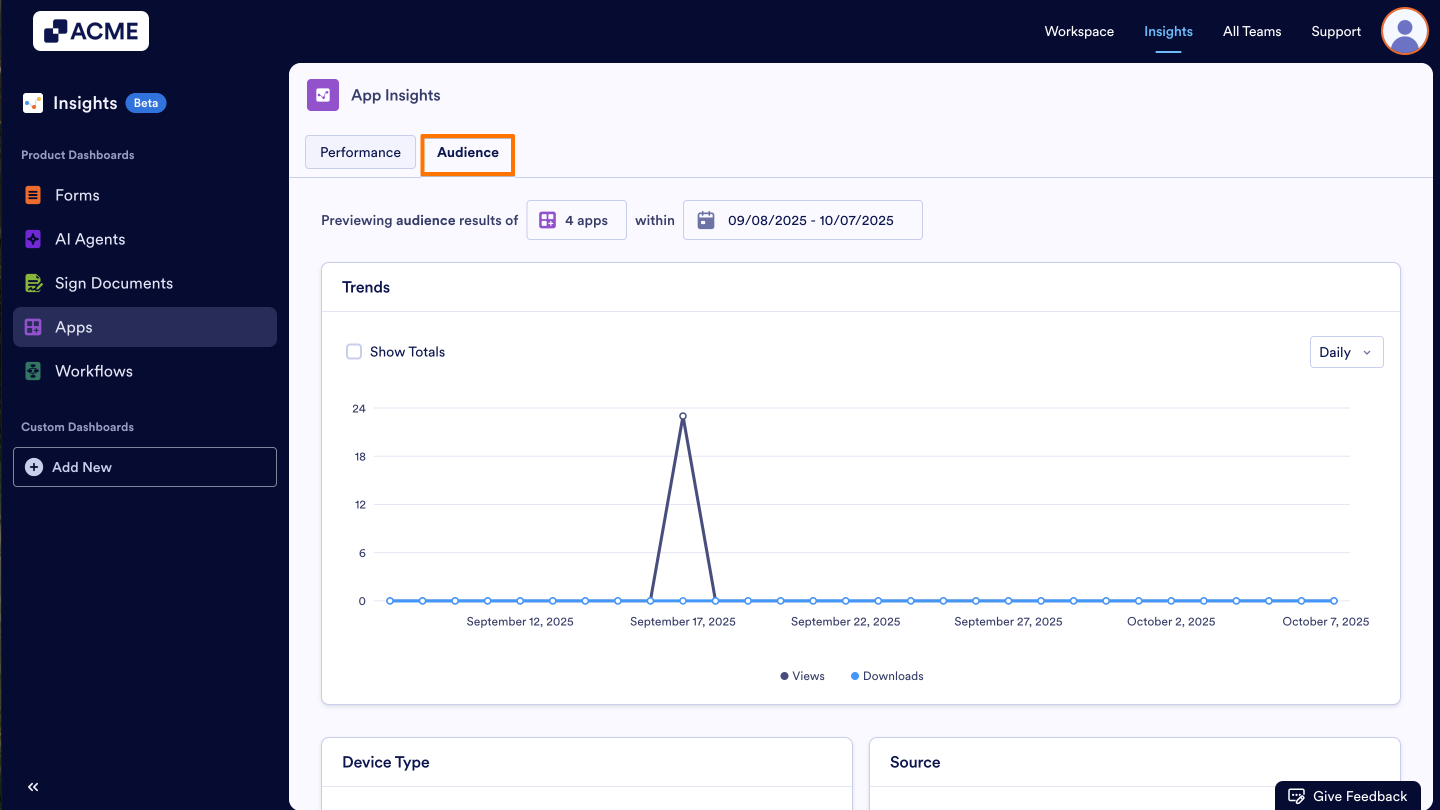
The App Insights Audience tab shows detailed information about how users access and interact with your apps. This view focuses on metrics such as device type, source, country, browser, and operating system, helping you better understand your audience and optimize the app experience.
Accessing Apps Audience Metrics
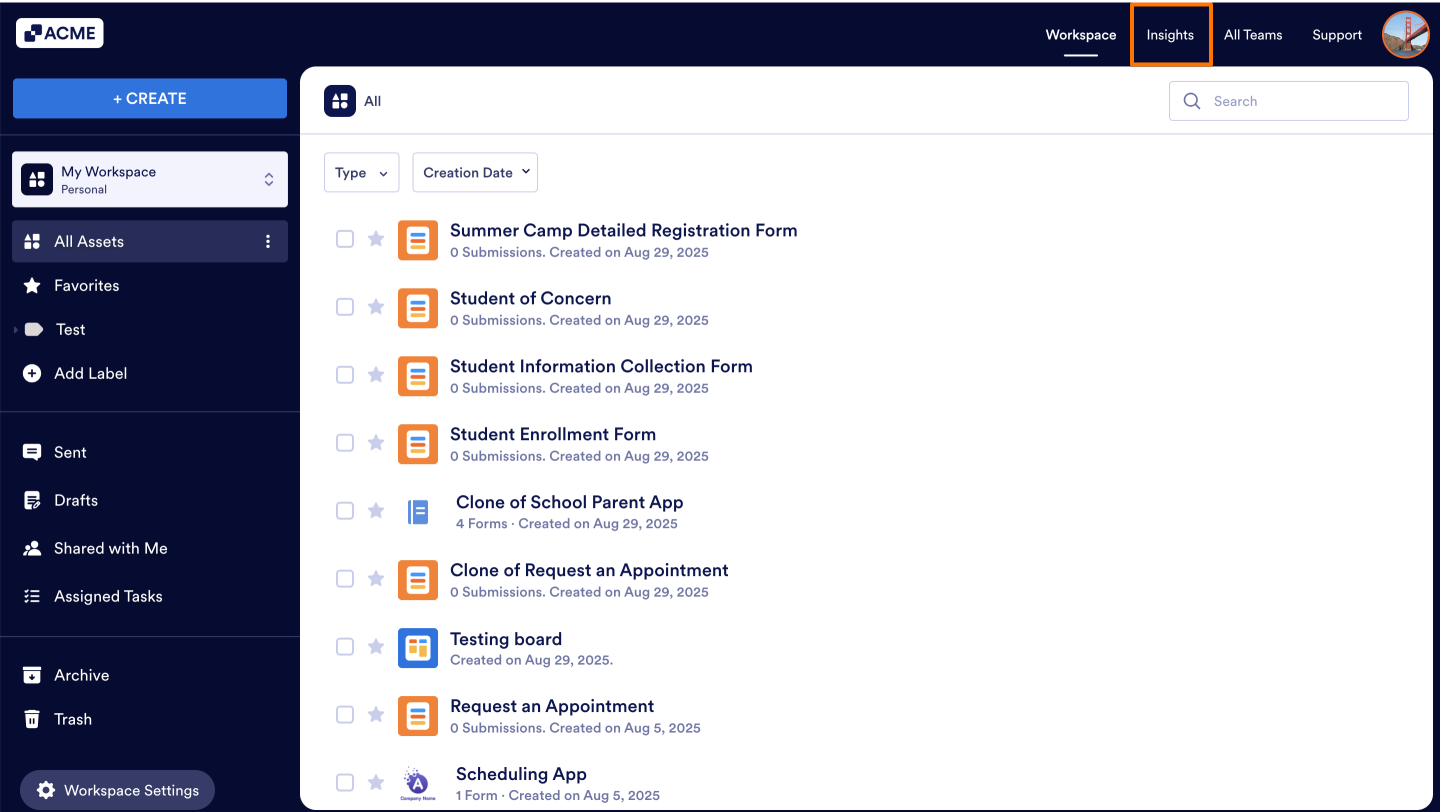
- In My Workspace, click on the Insights in the the upper right-hand corner of the page.
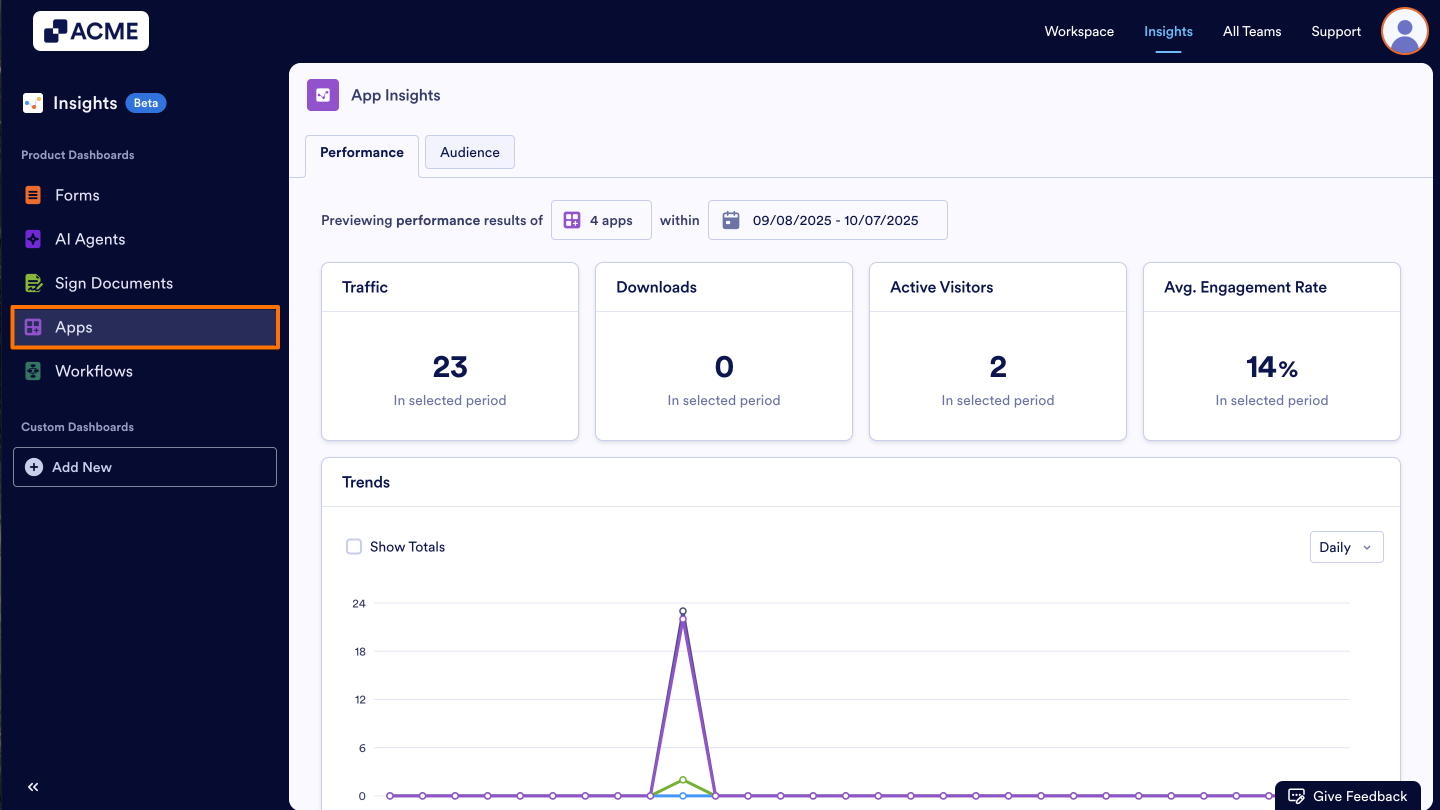
- Next, click on Apps from the menu on the left.
- Under App Insights, click on the Audience tab.
Note: You can also filter the apps you want to analyze and select a date range to view more specific data. When you set a filter for any tab in App Insights, it applies to all tabs, including Performance and Engagement. This makes it easy to see different metrics for the same data set.
What metrics do we provide?
Trends
We provide Trends that displays Audience related numbers such as Views and Downloads throughout the selected time period.
- Views displays the number of views your apps get through the selected date range.
- Downloads displays how many times your apps are downloaded.
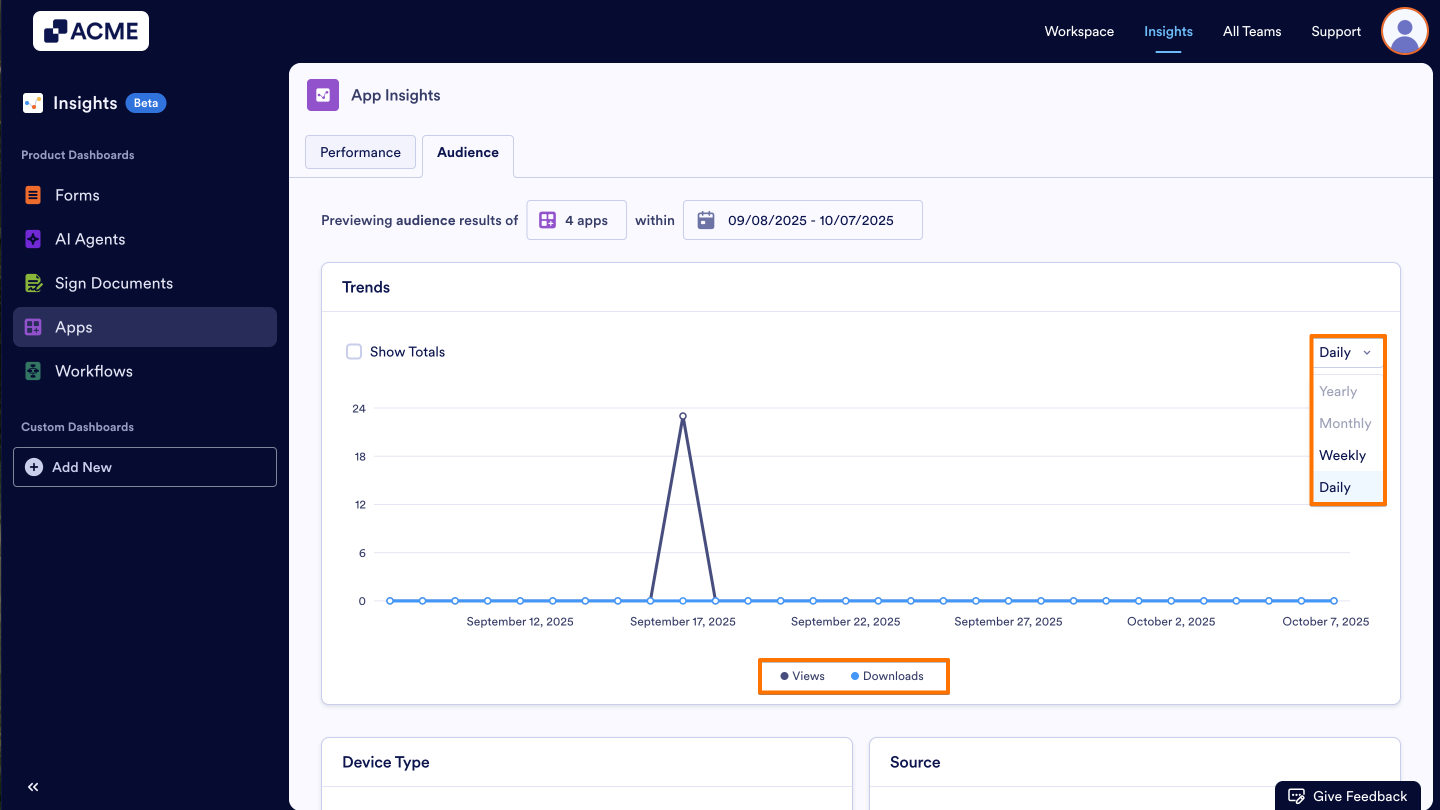
You can change the visibility of the data in the line chart. Let’s move on to the steps together:
- Add/Remove Metrics: Click on the metric name at the bottom of the chart to add or remove it from the chart.
- Changing the Time Interval: Click on the drop-down menu at the top of the chart and select daily, weekly, monthly, or yearly.
- Depending on the date range you’ve selected, some options might not be available. For example, if your date range for the tab is set to last seven days, you won’t be able to select monthly or yearly.
Other Cards Metrics
Under the trends chart, other valuable insights about your app’s audience can be found in card format. We’ve provided a detailed breakdown of each metric below:
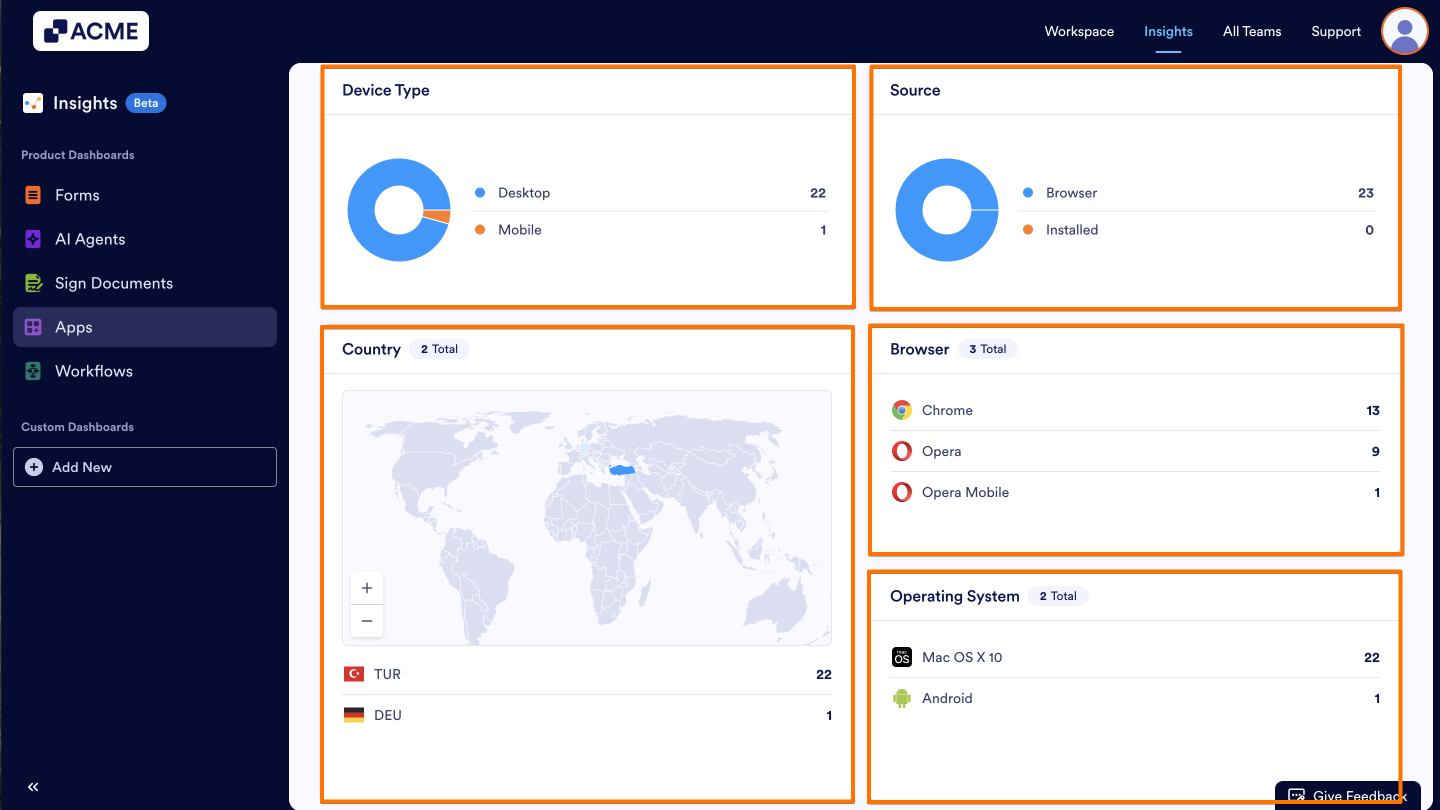
- Device Type: This donut chart shows the distribution of View numbers, divided between desktop and mobile.
- Source: This donut chart shows the distribution of View numbers divided between source (via Browser vs. Installed App).
- Country: This card shows the distribution of View numbers divided between countries in a map and country list format.
- Browser: This card shows the distribution of View numbers by browsers, such as Chrome, Chrome Mobile, Safari, Edge, and DuckDuckGo.
- Operating System: This card shows the distribution of View numbers by by operating system (e.g., Windows, macOS, iOS, Android).

Send Comment: